Work with Data Wrangler
Data Wrangler is a no-code tool that simplifies data cleaning and preparation.
It offers an interactive user interface that allows you to view and analyze the data, displays column statistics and visualizations, and automatically generates Python code.
Open Data Wrangler
Open a Jupyter notebook.
Run a code cell to create a
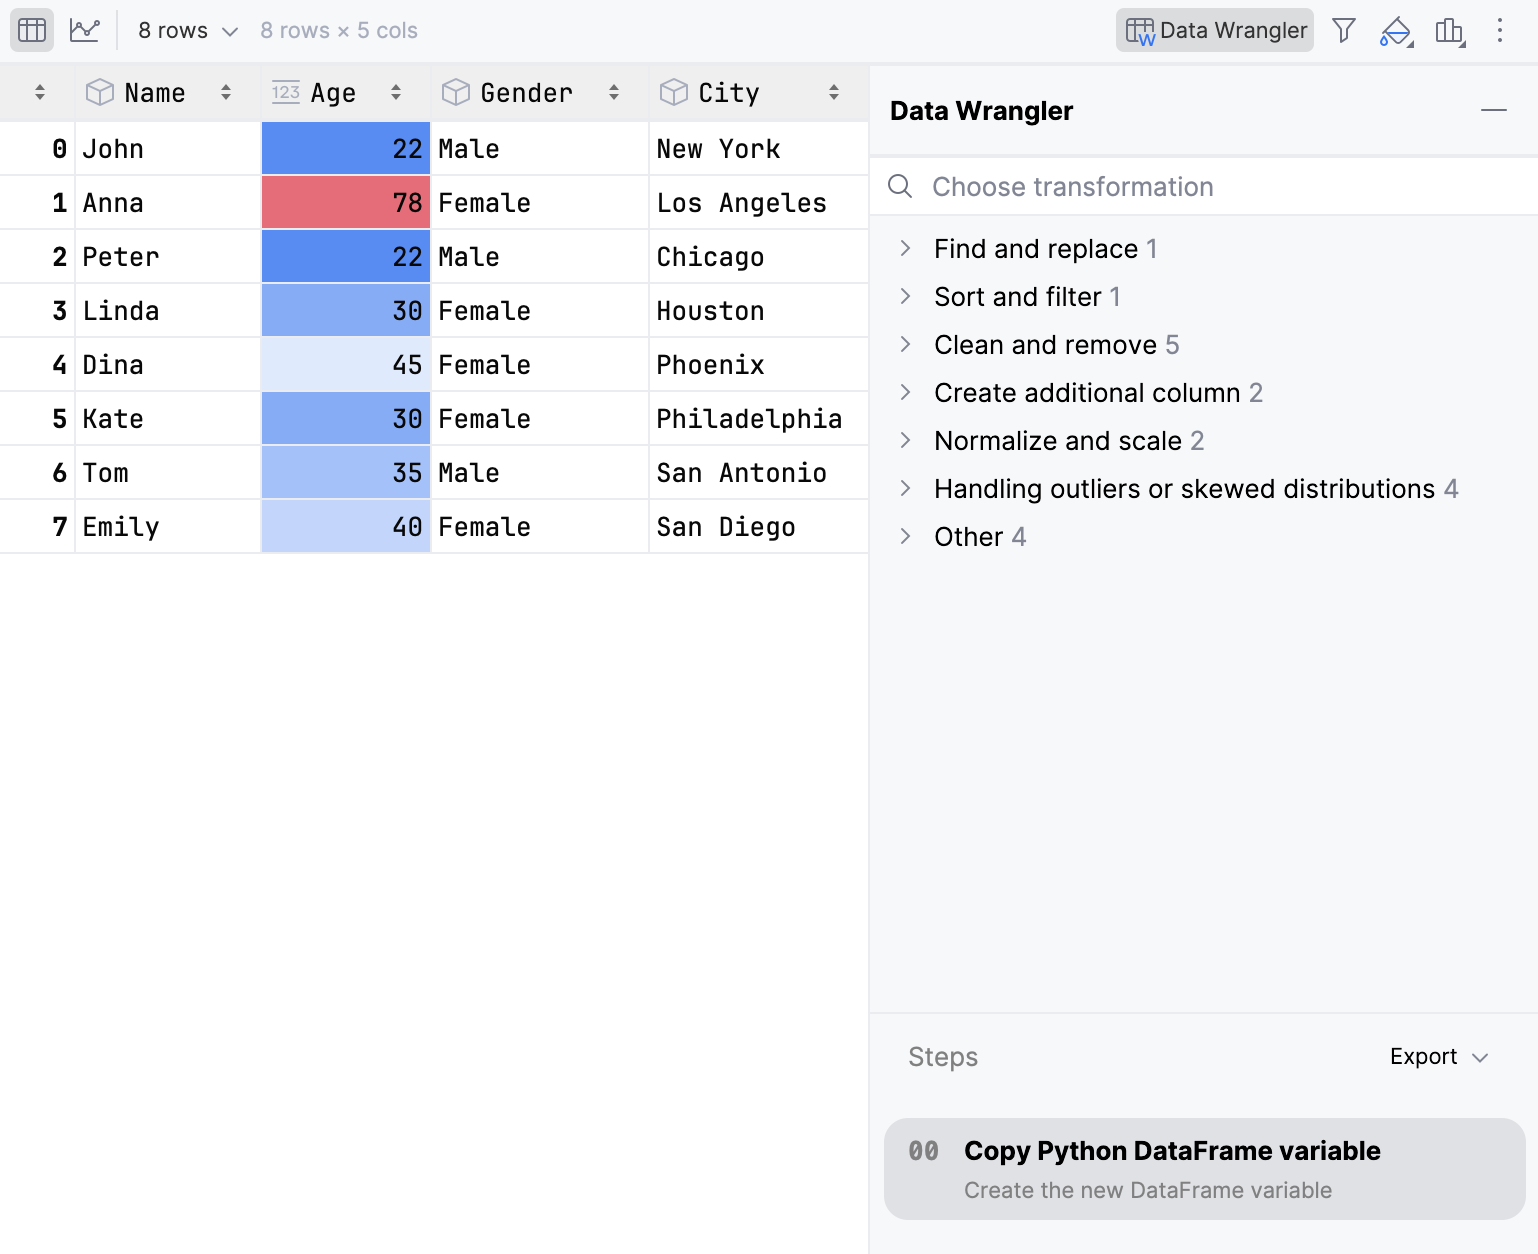
pandasdataframe. For example, run the cell with the following code:import pandas as pd # Data data = { 'Name': ['John', 'Anna', 'Peter', 'Linda', 'Dina', 'Kate', 'Tom', 'Emily'], 'Age': [22, 78, 22, 30, 45, 30, 35, 40], 'Gender': ['Male', 'Female', 'Male', 'Female', 'Female', 'Female', 'Male', 'Female'], 'City': ['New York', 'Los Angeles', 'Chicago', 'Houston', 'Phoenix', 'Philadelphia', 'San Antonio', 'San Diego'], 'Occupation': ['Engineer', 'Doctor', 'Teacher', 'Nurse', 'Architect', 'Lawyer', 'Accountant', 'Scientist'] } # Create a DataFrame df = pd.DataFrame(data) # Display the DataFrame dfIn the upper-right corner of the output cell, click
More Actions and select
 Edit in Data Wrangler from the context menu.
will open in a new tab:
Use Data Wrangler transformations
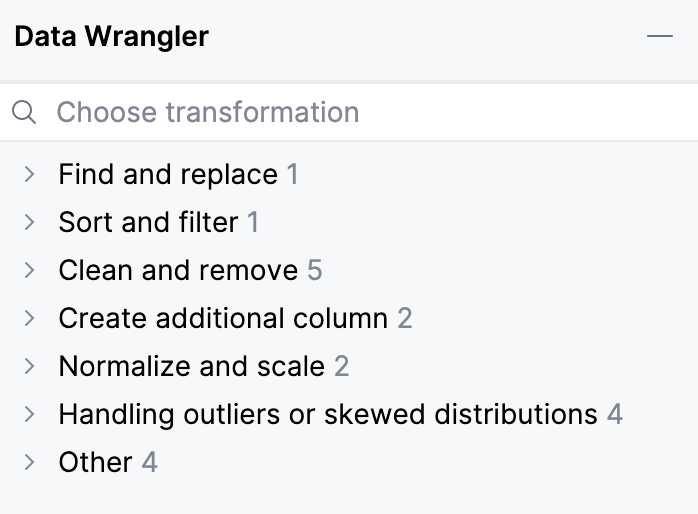
Transformation | Description | |
|---|---|---|
Find and replace | Replaces cells with a specified matching pattern from a selected column | |
Filter | Filters rows in a selected column based on a specified condition and value | |
Drop column | Removes a selected column from a table | |
Remove duplicates | Removes all rows that have duplicate values from a selected column | |
Drop missing values | Removes all rows with missing values from a selected column | |
Remove rows with NaN values | Removes rows that contain empty values from a table | |
Drop rows | Removes selected rows from a table | |
Transform column with string | Transforms strings in a selected column. You can select one of the following transformations:
| |
One-hot encoding categorical variables | Splits categorical data from a selected column into a new column for each category | |
Min-Max scaling | Rescales a selected numerical column between a minimum and maximum value | |
Z-Score normalization | Transforms the data from a selected column into a distribution with a mean of 0 and a standard deviation of 1 | |
Outlier detection with IQR | Detects outliers in a selected column using Interquartile Range | |
Reduce skewness | Reduces skewness by applying logarithmic or square root transformation to the data in a selected colum | |
Outlier detection with MAD | Detects outliers in a selected column using Median Absolute Deviation | |
Outlier detection with Euclidean distance | Detects outliers in a selected column using Euclidean Distance | |
Fill missing | Replaces cells with missing values with a new value in a selected column | |
Round numerical | Rounds numbers in a selected column to the specified number of decimal places:
| |
Split column | Splits a selected column into several columns based on a user defined delimiter | |
Change a type of column | Changes the data type of the selected column | |
Manage transformed data
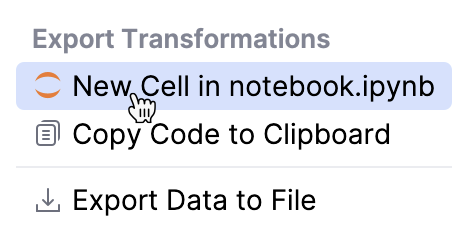
You can create a new cell in your Jupyter Notebook with the generated data transformation code, copy the code to your clipboard, or save the transformed dataset as a new file.
Click Export in the upper-right corner of the Steps pane.
In the pane you can view the history of changes applied to your data.
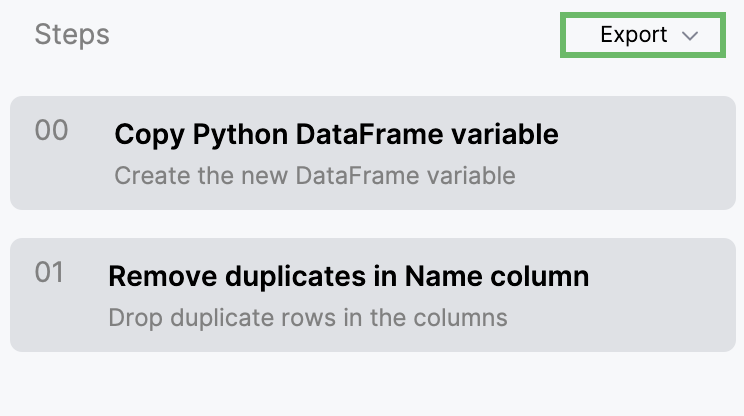
Select the option from the dropdown menu that opens.
Example: remove duplicate entries
One of the common data cleaning tasks is to remove duplicate entries to prevent biased results from your analysis.
You can use Data Wrangler to transform your data through the interface. Data Wrangler will automatically generate the Python code required for the removing of duplicates.
Open Data Wrangler.
Select from the list of Transformations.
Select the column from the Column drop-down list.
Check the generated code.
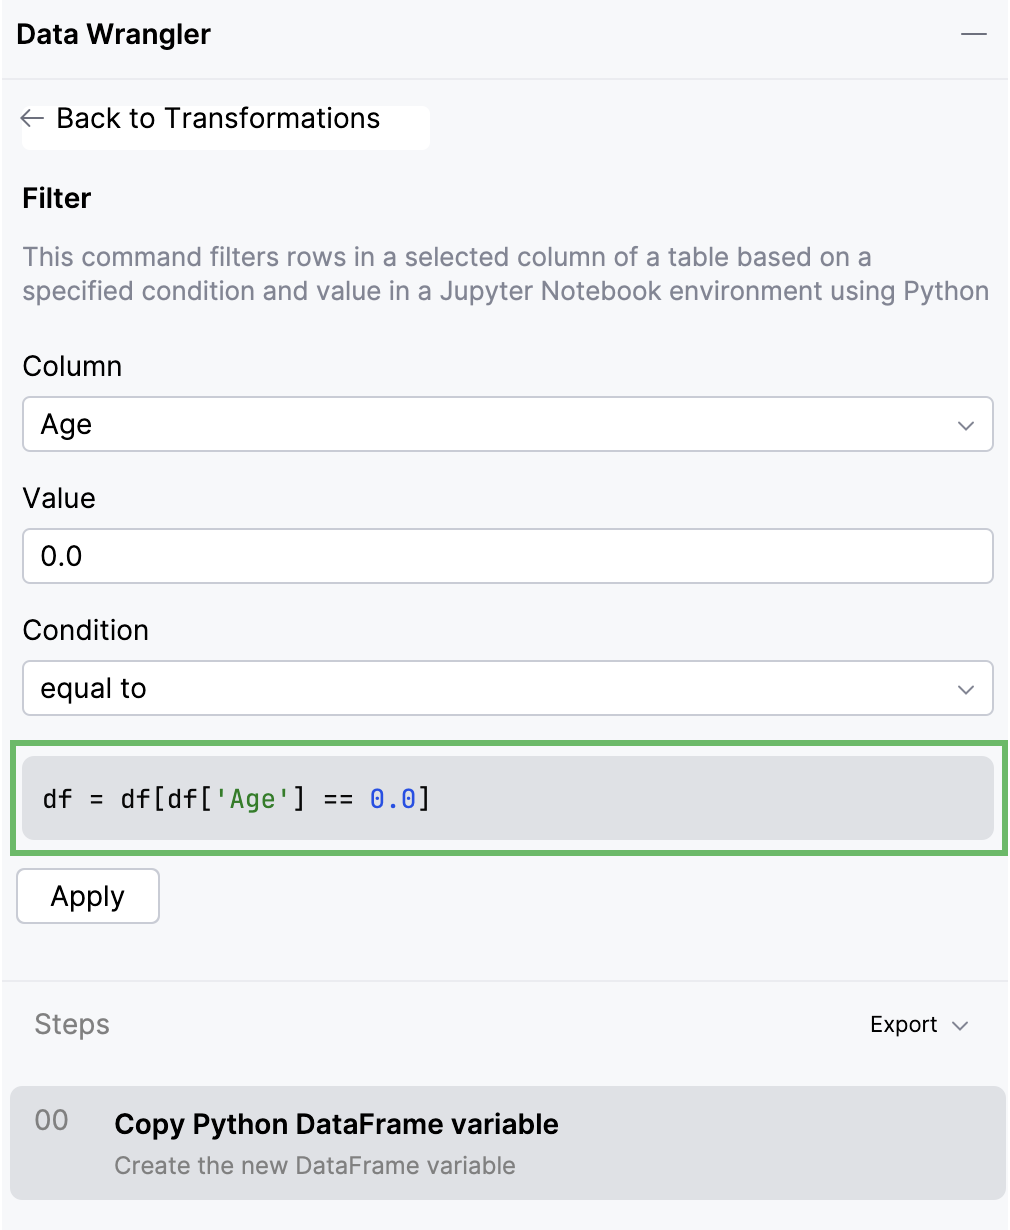
Click Apply.
Click Export if you want to add a new code cell with generated code to your notebook, copy your code to the clipboard, or save transformed data as a file.