Analysis reports
Qodana lets you review analysis reports in an interactive and user-friendly form either locally or in Qodana Cloud.
Report UI overview
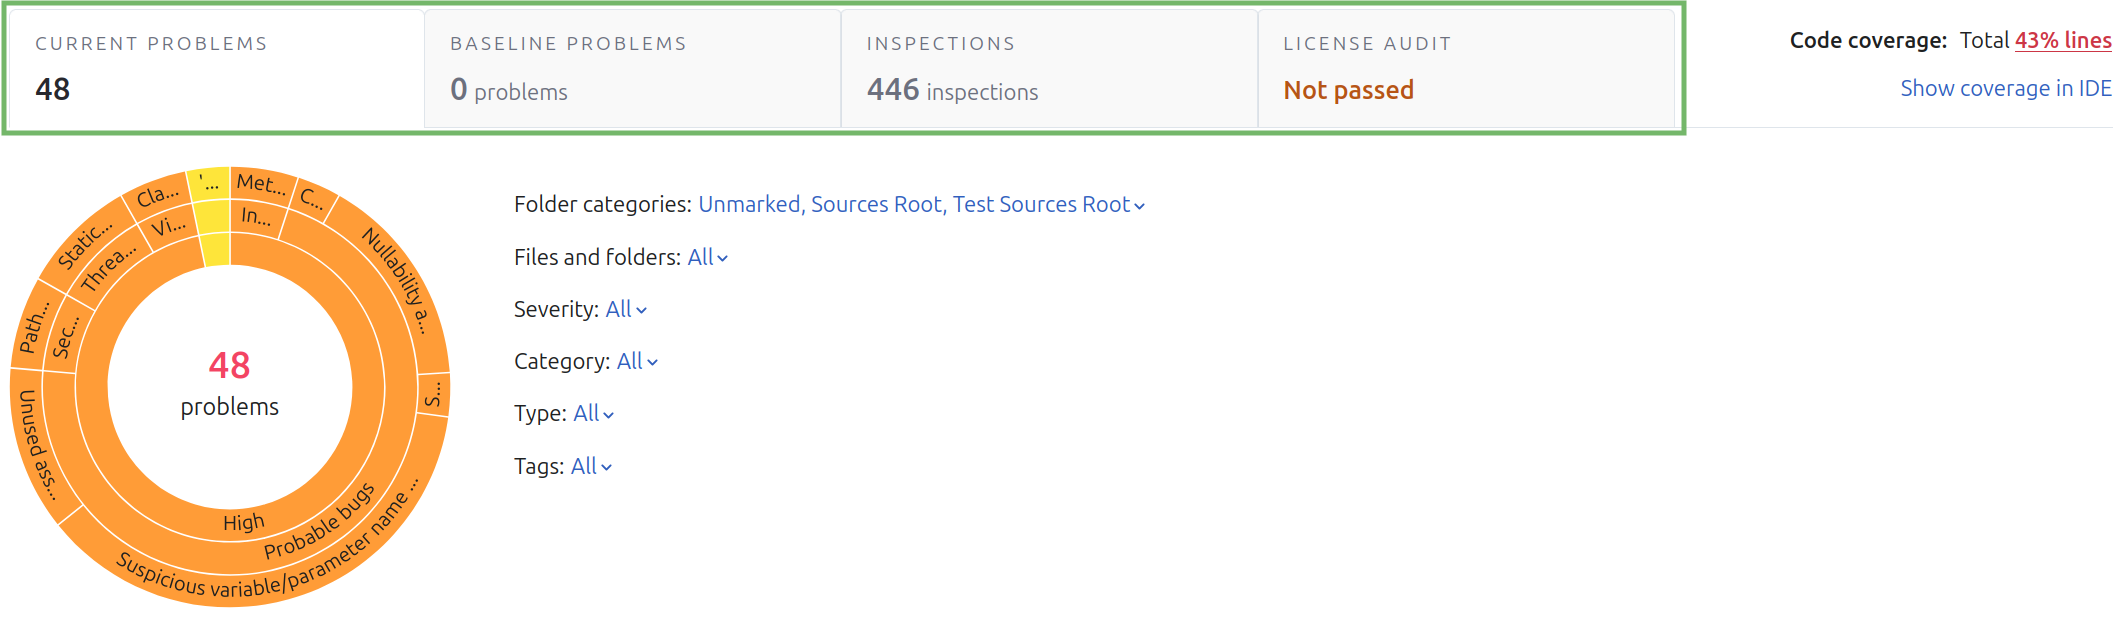
Each report contains the following tabs:
Current problems exposes the problems that Qodana detected during the latest analysis.
Baseline problems lists the problems that were marked as baseline and were not fixed since then.
Inspections lets you configure Qodana for future use.
License audit reveals license audit reports and shows the dependency licenses that are incompatible with the project license.
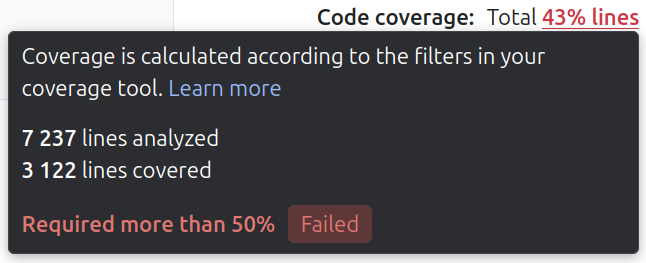
The upper-right corner of the report shows a code coverage analysis report.
Current problems
Using this tab, you can see the problems found as a result of the latest analysis.
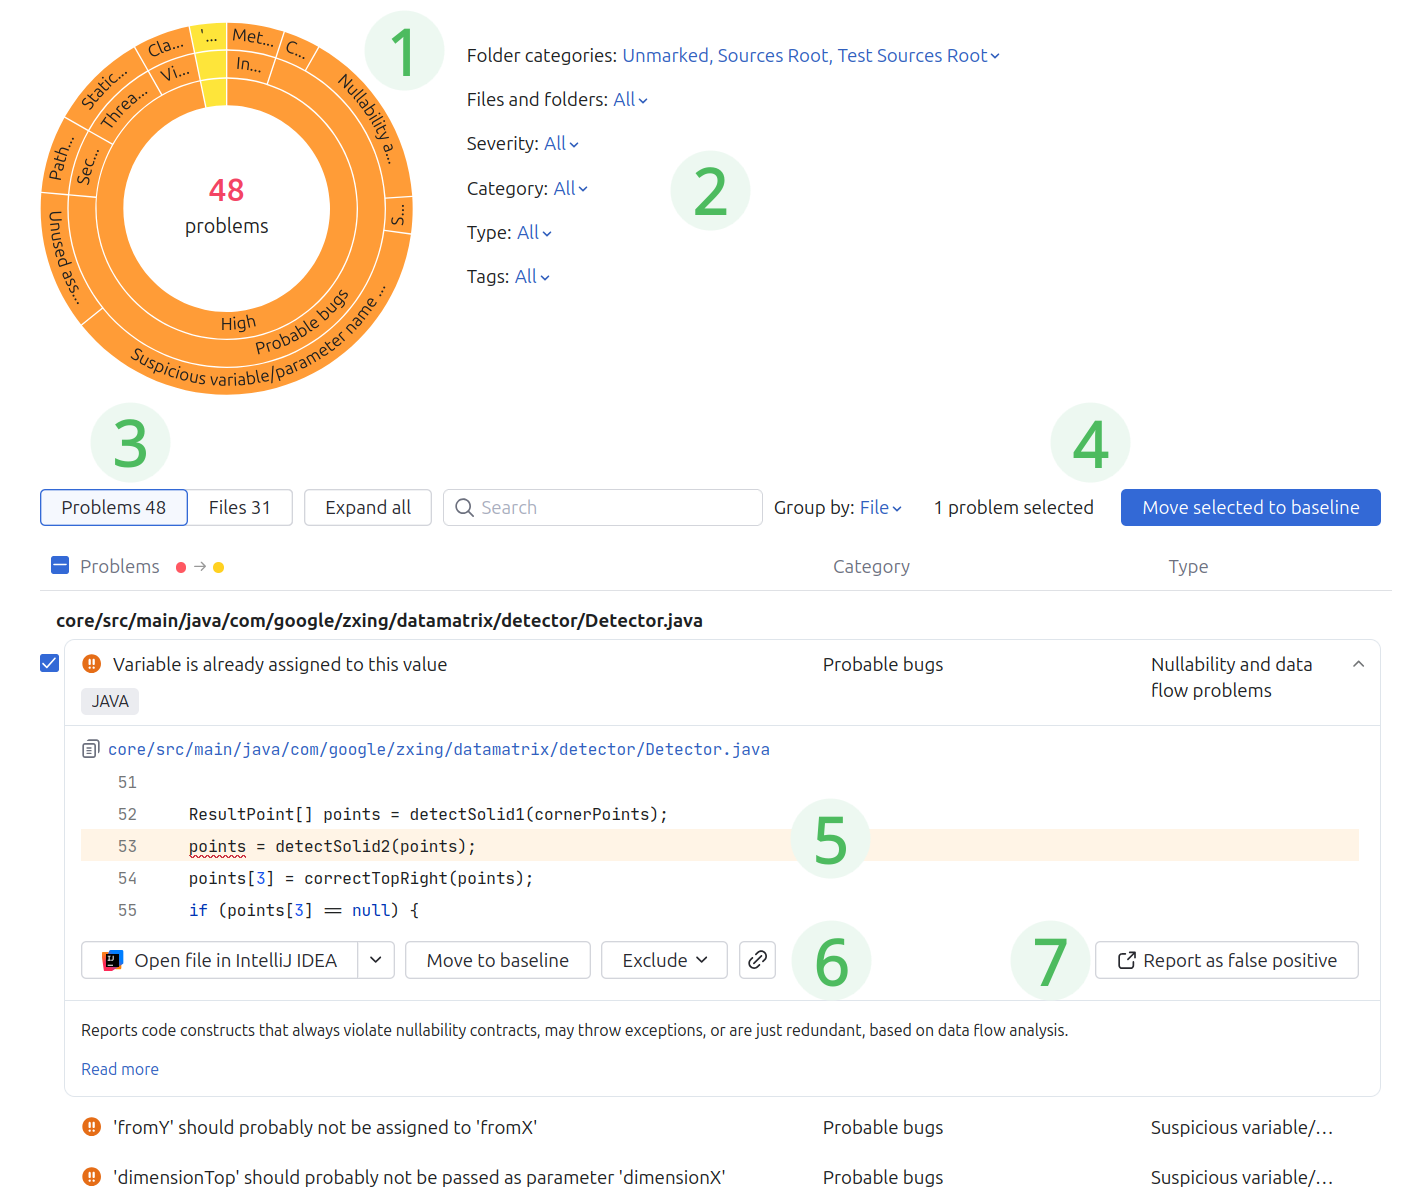
On this tab, you can find several elements:
The sunburst diagram provides a graphical overview of the problems and allows you to drill down into the cause of the issue.
The group of filters lets you filter the report data using various criteria.
You can navigate between the list of problems and files, as well as group them.
Using the search field, you can filter the list of problems by their names.
Clicking a problem in the list expands the underlying code fragment containing the detailed description.
The Demote to baseline button moves the selected problem to a baseline and becomes visible on the Baseline problems tab.
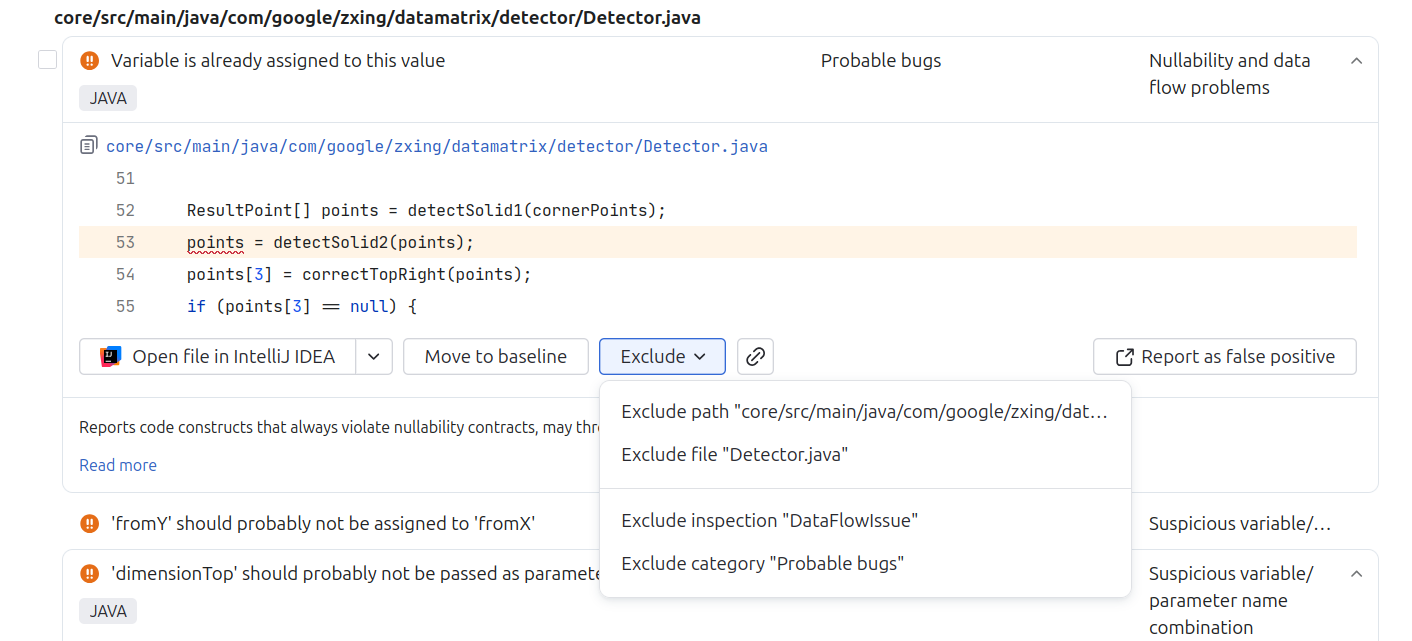
The Exclude dropdown list lets you exclude a path, file, inspection, or category from the analysis, see the Adjust the analysis scope section for details.
The Hide button lets you hide the selected problem from the report for your account. Other people will still see it.
The Find similar problems button lets you filter problems by type.
Finally, you can use the Copy button to copy a link to a specific problem contained in the report.
The Report as false positive button lets you create a related issue in YouTrack.
Baseline problems
When you click the Demote to baseline button on the Current problems tab, the selected problems move to this tab.
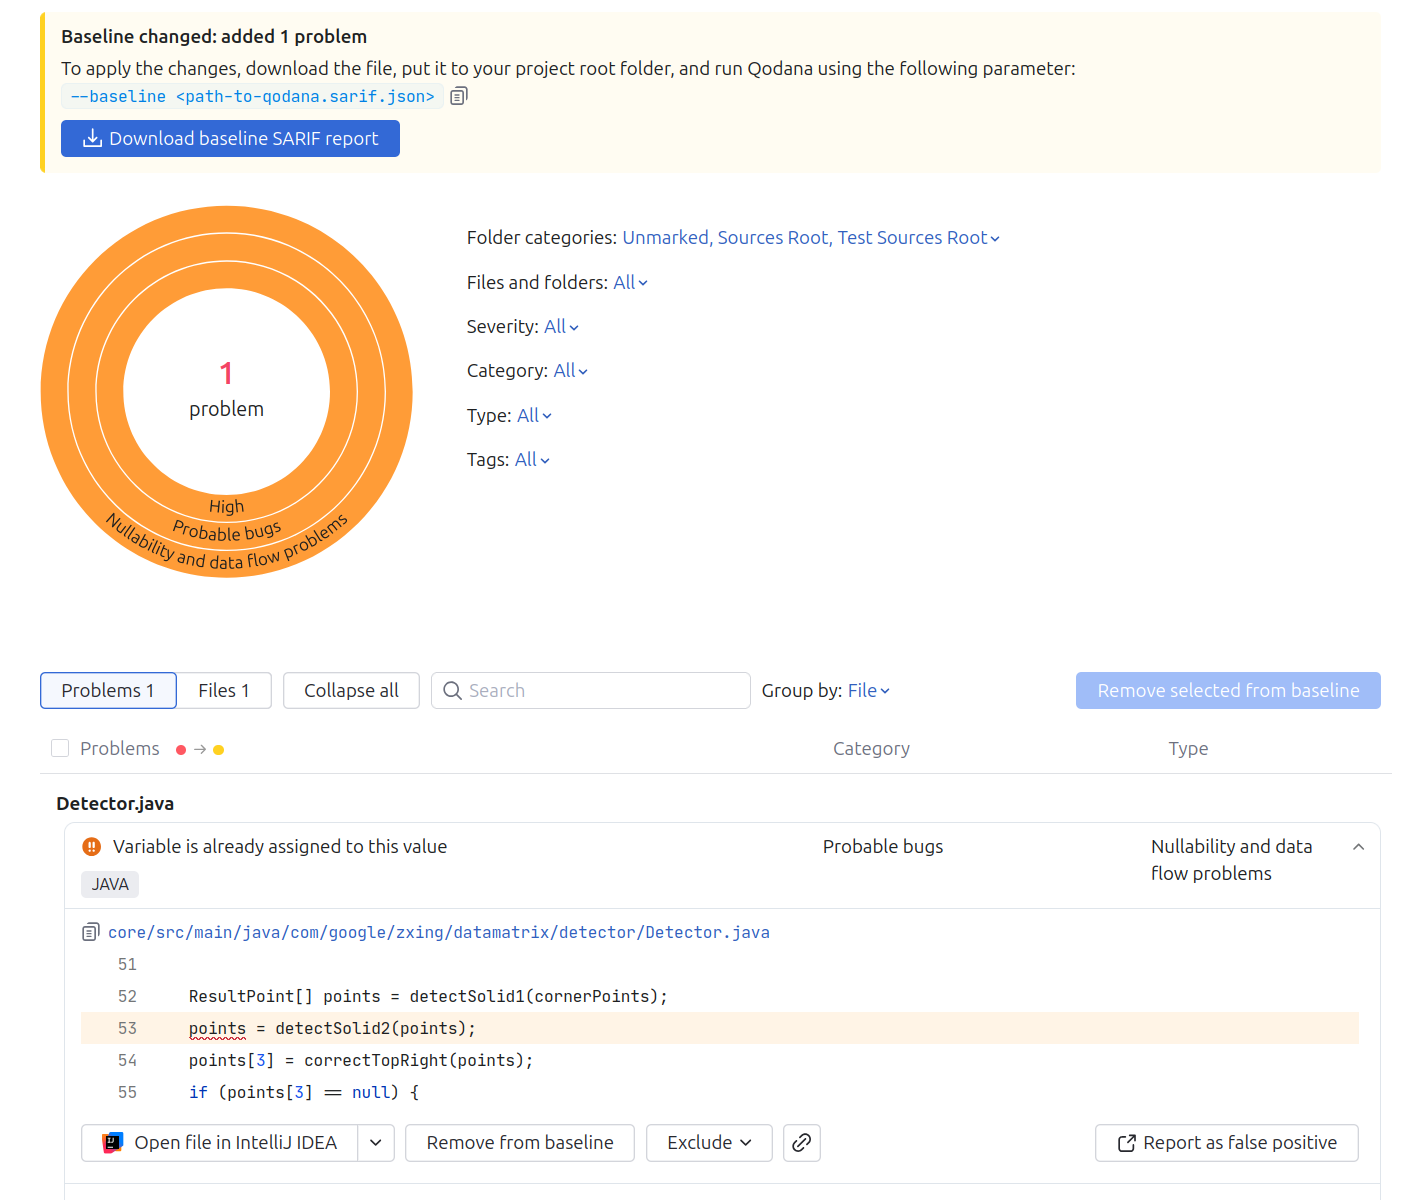
Here, you can download the qodana.sarif.json file containing the baseline state of your project. Apart from that, this tab UI is similar to the Current problems tab.
Inspections
The Inspections tab lists the inspections and lets you adjust your inspection profile by specifying a set of inspections that Qodana will be using the next run.
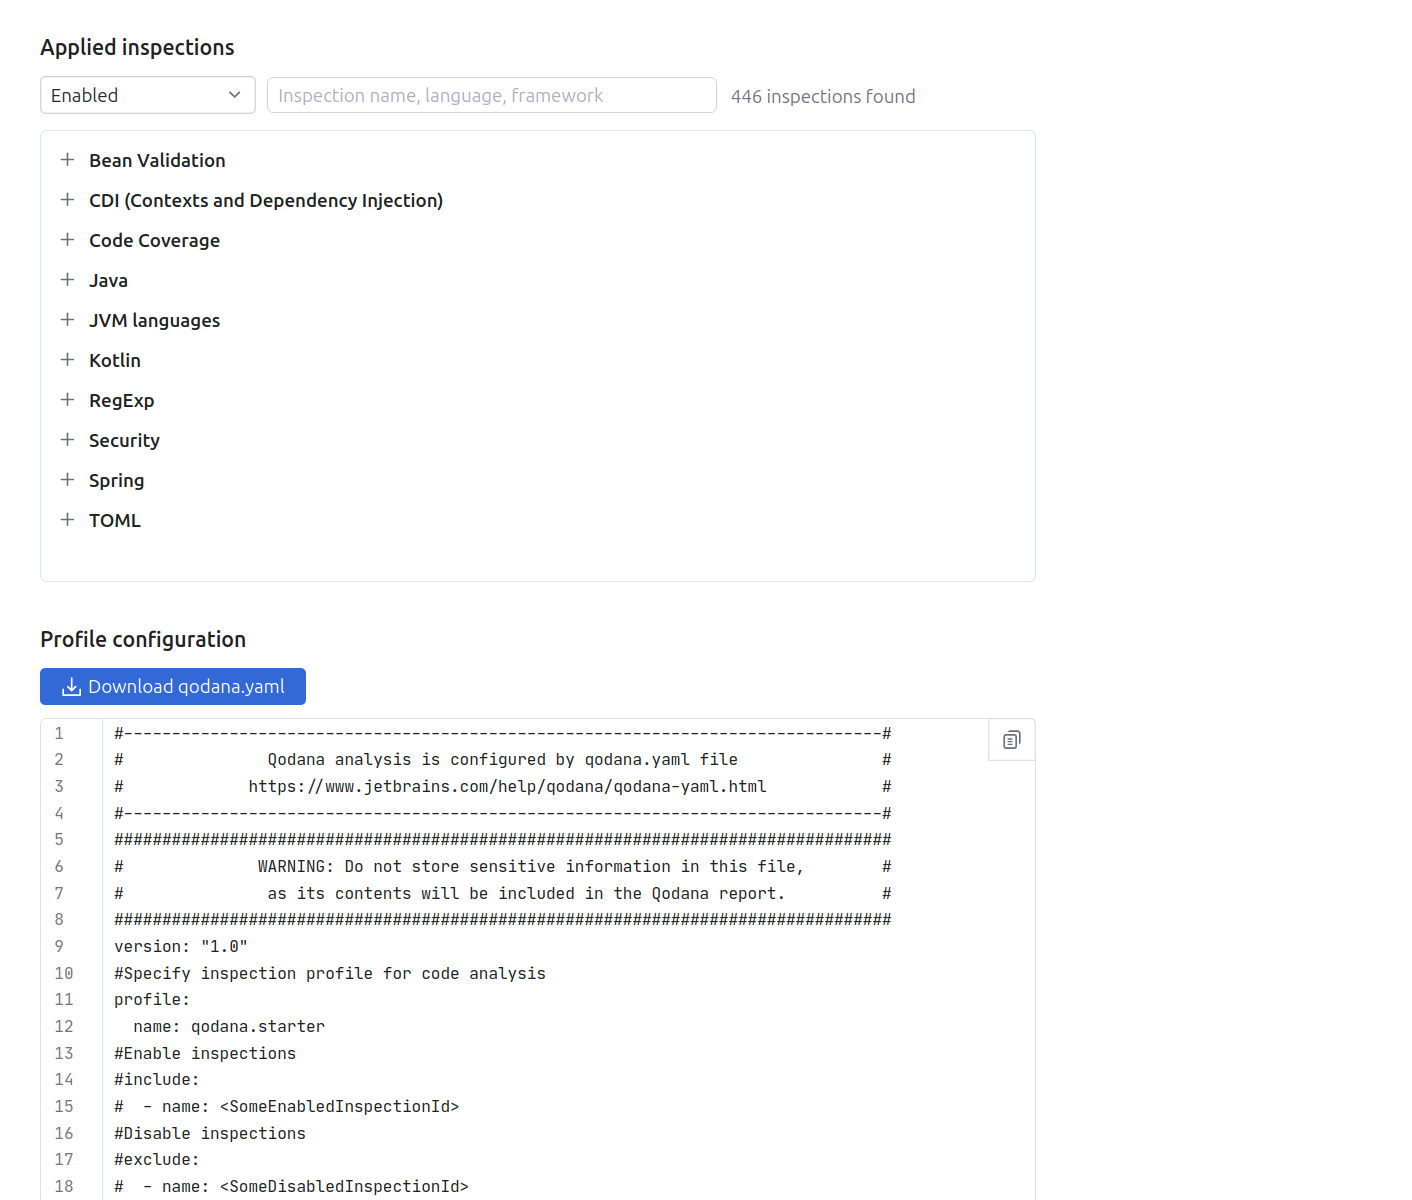
Here, you can learn what each inspection does, as well as enable or disable it. To use this configuration for future use, you can download the qodana.yaml file and save it into your project root directory.
See the Adjust your inspection profile section to learn the best practices.
The lower part of this tab contains the Profile configuration pane that lets you view the actual configuration of Qodana. Once you modify the configuration, it will be updated in this pane accordingly.
License audit
The tab provides an analysis report generated by the license audit feature.
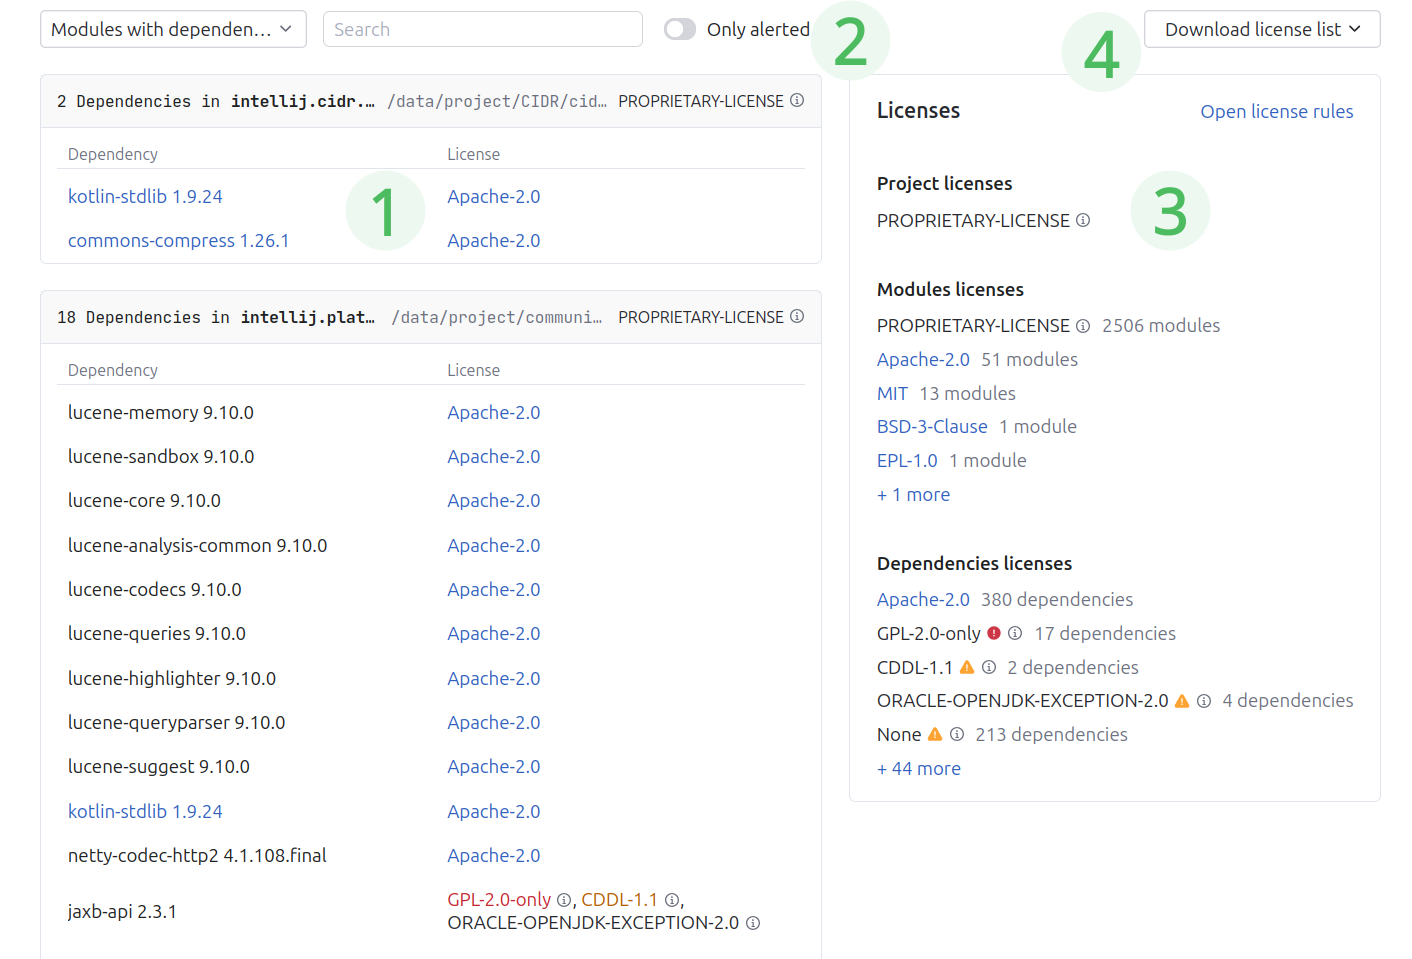
License audit report is grouped into a dependency tree.
If applicable, you can expand a specific dependency to see its dependency tree.
Use to toggle between all project dependencies and those with licenses incompatible with the project license.
In the section, you can find the list of project, module and dependency licenses. Using , you can view the rules of license compatibility.
You can download the list of licenses in various formats. Select
.jsonto download the SPDX 2.3 JSON format.
Severity levels
This table shows the relation between severities in JetBrains IDEs, SARIF files, and Qodana reports.
IDE severity | SARIF severity | Qodana report severity | Code Climate severity | Bitbucket severity |
|---|---|---|---|---|
ERROR | ERROR | Critical | Blocker | High |
WARNING | WARNING | High | Critical | High |
WEAK WARNING | NOTE | Moderate | Major | Medium |
TYPO | NOTE | Low | Minor | Low |
INFORMATION | NOTE | Info | Info | Info |
OTHER | NOTE | Info | Info | Info |
Adjust your inspection profile
We believe that the ability to see what was checked is as important as the list of problems found. For example, if you haven't checked for typos, you can be happy to see zero typos in your project. There may be many of them – you just don't check.
If the number of problems is manageable, you can fix them and consider the 'problem-free code' goal achieved. We suggest that you follow that goal and fix new problems as soon as they appear.
In case the number of problems is above your expectations, we suggest using the Qodana features to examine them.
When you have no possibility to fix old problems and want to prevent the appearance of new ones, you can run Qodana in baseline mode.
Adjust the analysis scope
Reduce the scope of analyzed issues
When viewing a code fragment with a detected problem, you may decide that it is irrelevant. You can make sure that more problems of the same type are omitted in the future. For this purpose, you can edit qodana.yaml or use the Current problems tab as shown below.
Exclude from the future analysis
Reason: The analysis of the file containing the error, or even the directory containing this file, doesn't make sense in your project. For example, it's actually not the source code but some generated or downloaded content.
How to: Under the code fragment view, expand the Exclude dropdown list and select the necessary option.
OR:
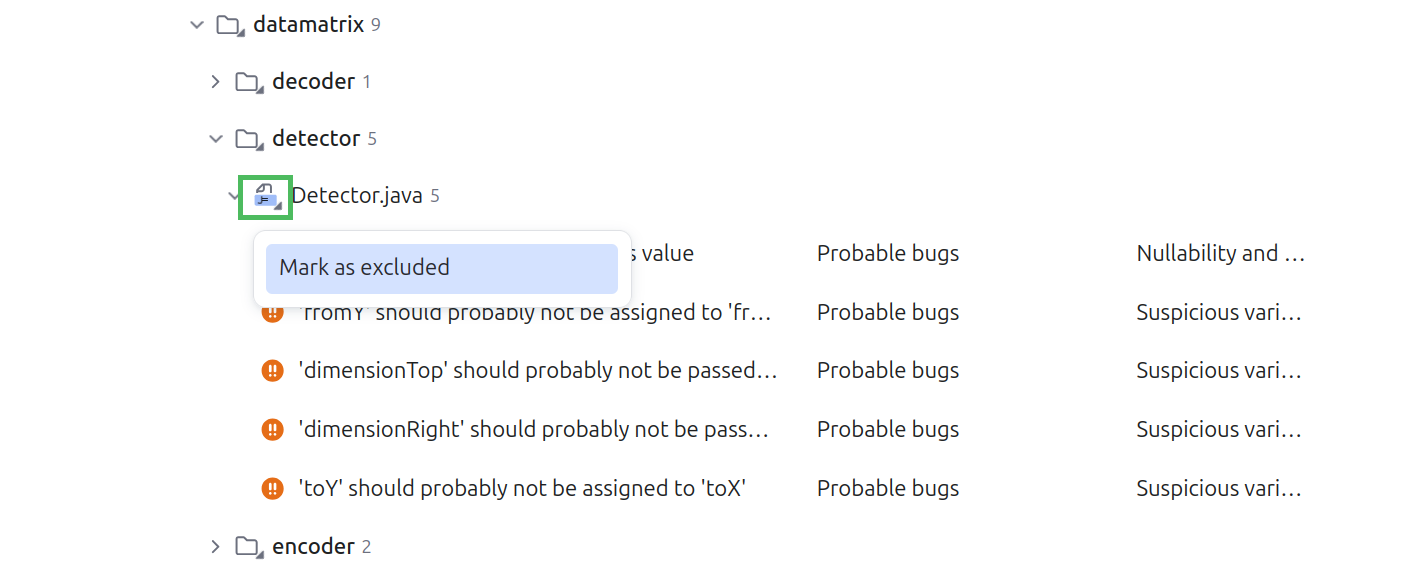
Above the code fragment view, click the file path to navigate to the File explorer.
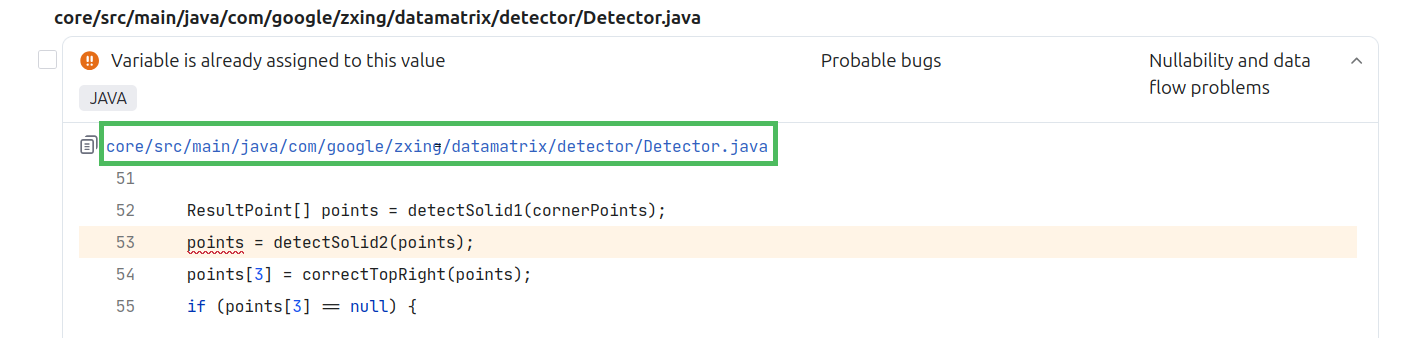
On the File explorer, click the icon to the left of the filename, and then select Mark as Excluded.
Exclude a problem type or category from the list of problems
Reason: You suppose that the error type or its category is not relevant or want to get back to it later.
How to: Under the code fragment view, expand the Exclude dropdown list and select the necessary option.
Enable excluded problems
To reverse the exclusions you made, download qodana.yaml on the Profile configuration pane, edit it as necessary, put it in the project root directory, and then run Qodana again with this new configuration.
To learn how to configure Qodana using qodana.yaml, see the Inspection profile section.
Open an HTML report
You can open HTML-formatted Qodana reports using JetBrains IDEs and shell commands.
You can open HTML reports using IntelliJ IDEA, PhpStorm, WebStorm, Rider, GoLand, PyCharm, and Rider as explained in the Qodana report overview section.
In this case, your IDE needs to be installed via JetBrains Toolbox App.
See the Visual Studio Code section for details.
When you run Qodana with the --save-report option, it stores an HTML version of the report in /data/results/report. This directory is typically mounted via Docker to let you view the HTML report later, independently of running Qodana. Due to JavaScript security restrictions, you cannot browse the HTML report by double-clicking the index.html file. Instead, the HTML report needs to be served via a web server, and you can run the Dockerized version of nginx, or invoke the Python or PHP built-in web servers as shown below.
After running Qodana, navigate to the
reportdirectory and make sure that theindex.htmlfile is present there.Serve the report using the web server of your choice:
docker run -it --rm -p 8000:80 \ -v $(pwd):/usr/share/nginx/html nginxIn your browser, navigate to http://localhost:8000 to see the generated report.
python2 -m SimpleHTTPServerIn your browser, navigate to http://localhost:8000 to see the generated report.
python3 -m http.serverIn your browser, navigate to http://localhost:8000 to see the generated report.
php -S localhost:8000In your browser, navigate to http://localhost:8000 to see the generated report.