Run and debug C# code
ReSharper for Visual Studio Code lets you run and debug .NET projects directly from your code editor. It uses the built-in debugging infrastructure and user interface of the host editor and provides all necessary debugger features such as breakpoints, stepping, variable inspection, and expression evaluation.
Start debugging for the first time
To debug your .NET project of executable type for the first time, you can start by clicking Run and Debug in the Run and Debug window Ctrl+Shift+D when a C# file is open in the editor. In the list that opens, pick the ReSharper: Launch .NET Project configuration and then select the target project.
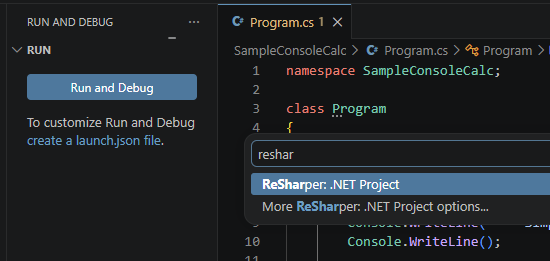
Launch configurations
When you finish the first debugging session, you will notice that the Run and Debug button is no longer available. Instead, you will see the Start Debugging button and the launch configuration selector on the toolbar:
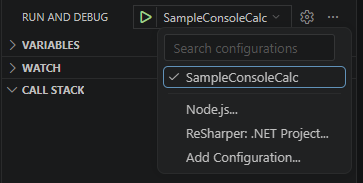
This means that the host editor created a dynamic run configuration with default settings to quickly start your project.
If you want to configure the way your project starts or have multiple configurations for the same project, you will need to create static launch configurations, which will be saved in .vscode/launch.json.
Add new static launch configuration
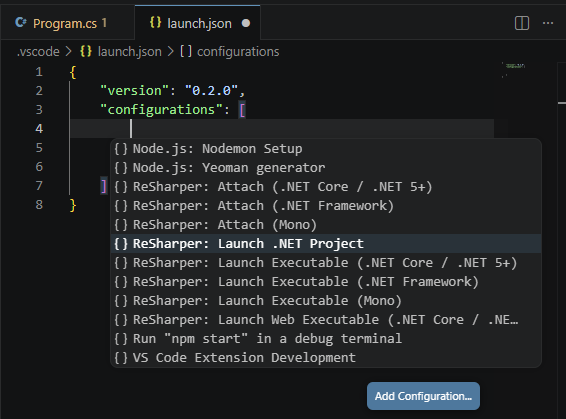
Click the gear icon next to the configuration selector on the toolbar to open the configuration file and then click Add Configuration inside the launch.json file that opens.
Select one of the ReSharper: * configurations:
In the new object that is added, use code completion for different properties:
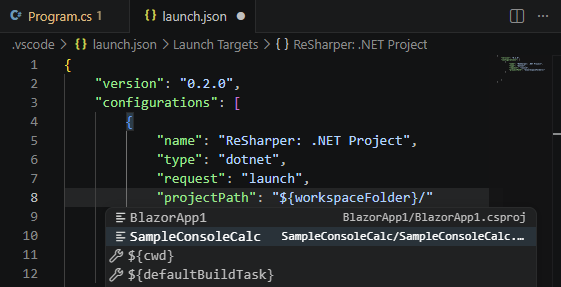
Save the file Ctrl+S and you will see the new configuration in the selector in the Run and Debug window.
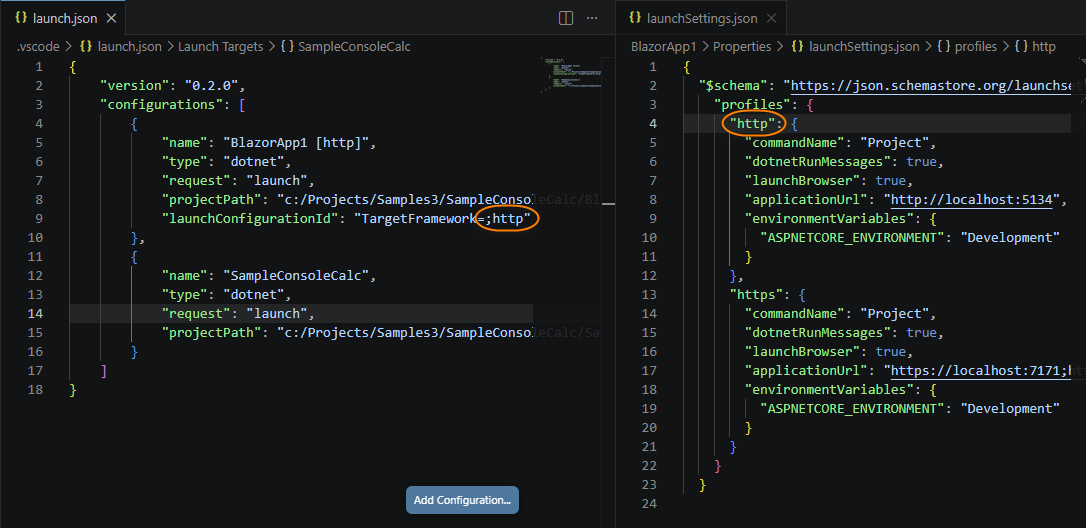
For Web projects that have their settings configured in a launchSettings.json file, you need to add a new ReSharper: Launch .NET Project configuration and reference the desired profile using the launchConfigurationId property:
Launch existing configurations
To launch the configuration selected in the Run and Debug window, use the F5 or Ctrl+F5 commands.
To launch a specific configuration, invoke the command palette F1 and pick Debug: Select and Start Debugging from the list, then select a configuration.
Attach to a process
You can attach the debugger to an already running .NET process.
Attach to a process with default settings
Open the command palette F1
Select the ReSharper: Attach to a .NET Core / .NET 5+ process or ReSharper: Attach to a .NET Framework process command depending on the target process.
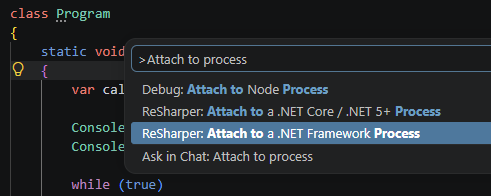
From the list that opens, select a target process.
If you want to configure the way your process is attached to, create a new launch configuration for it.
Attach to a process with custom settings
Click Add Configuration inside the launch.json file that opens.
Select the ReSharper: Attach configuration for the desired type of process:
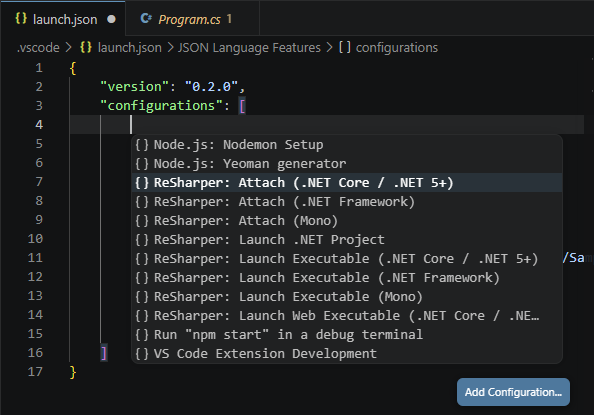
Specify the settings in the new object that is added.
As soon as you save the file Ctrl+S, you will be able to launch the created 'attach' configuration when necessary.
Breakpoints
Breakpoints allow you to pause program execution at specific lines of code so that you can inspect the program state.
Line breakpoints
To toggle a breakpoint, click the gutter next to the line number or place the caret on the desired line and press F9. A red dot appears in the gutter to indicate the breakpoint.

Conditional breakpoints
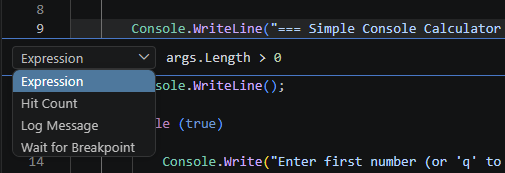
Conditional breakpoints only pause execution when a specified expression evaluates to true. To set a conditional breakpoint, right-click the gutter next to a line of code and select Add Conditional Breakpoint. Type the condition expression in the input field that appears.
Logpoints
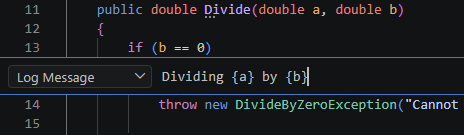
Logpoints (also known as tracepoints) send output to the Debug Console without stopping execution. To add a logpoint, right-click the gutter next to a line of code and select Add Logpoint. Type the message you want to log. Any expression between curly braces ({ and }) is evaluated when the logpoint is hit.
Triggered breakpoints
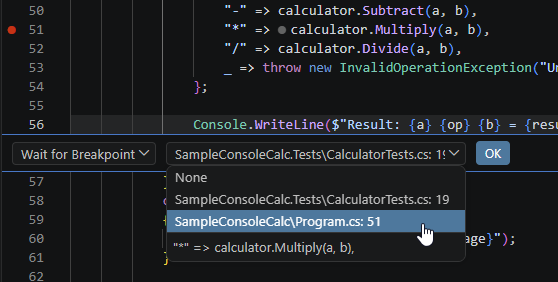
A triggered breakpoint is automatically enabled when another breakpoint is hit. This can be useful when diagnosing failure cases that happen only after a certain precondition.
To set a triggered breakpoint, right-click the gutter, select Add Triggered Breakpoint, and choose which breakpoint enables it.
Debugger features
Stepping
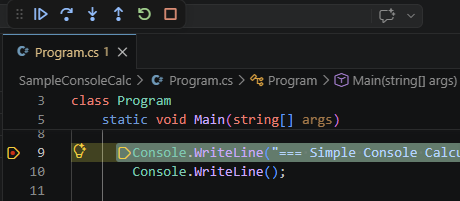
When the debugger hits a breakpoint, you can step through the code using the Debug toolbar or keyboard shortcuts:
Continue F5 — resume program execution until the next breakpoint.
Step Over F10 — execute the current line and move to the next one.
Step Into F11 — step into the function called on the current line.
Step Out Shift+F11 — step out of the current function and return to the caller.
Inspect variables
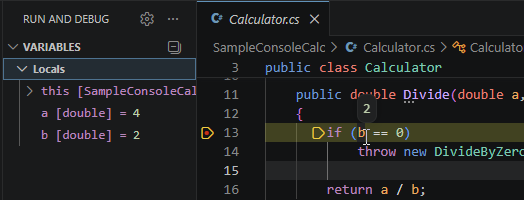
When execution is paused, you can inspect variables in several ways:
Hover over a variable in the editor to see its current value in a tooltip.
Review local and global variables in the Variables section of the Run and Debug view.
Watch expressions
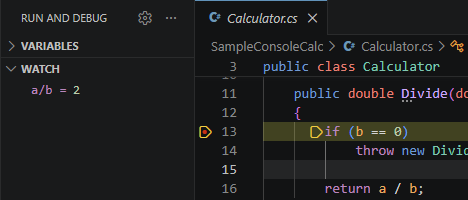
You can track specific expressions during debugging by adding them to the Watch section of the Run and Debug view. Click + in the Watch section and type the expression you want to evaluate. The expression is re-evaluated each time the debugger pauses.
Debug Console
The Debug Console lets you evaluate expressions in the context of the paused program. Type an expression and press Enter to see the result.
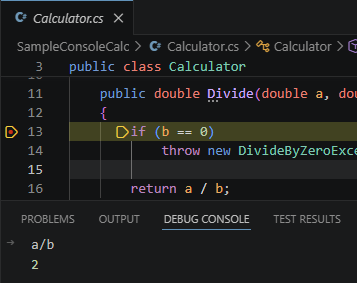
You can open the debug console by clicking the three dots menu on the toolbar of the Run and Debug window.