Detecting Code Issues in Design Time
JetBrains Rider starts analyzing a code file as soon as you open it in the editor, all the way you edit it, until it is closed. All detected code issues are highlighted in the editor according to their severity levels. The map of the issues is also displayed on the marker bar in the right part of the editor window, where you can see instantly the status of the file and click the marks to navigate to specific code issues.
Design-time inspection features
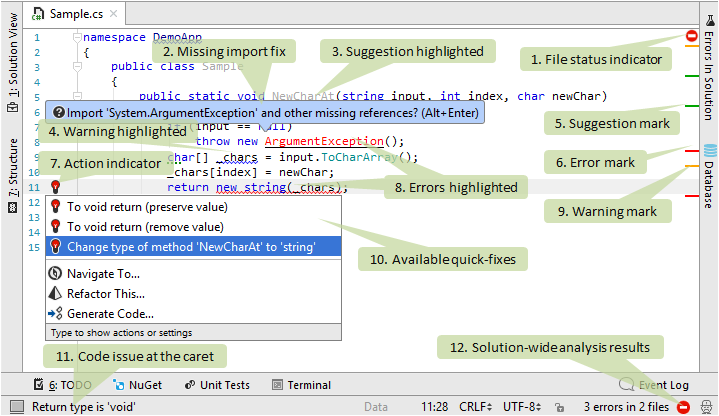
To illustrate the design-time code inspection performed by JetBrains Rider, consider the following code excerpt displayed in the editor:

In this rather simple example, we can see the following features of JetBrains Rider code inspection:
- Status indicator that helps you to see at once whether the current file has errors or warnings.
- A fix pop-up that appears for non-imported types. It is enough to press Alt+Enter or click on this pop-up and JetBrains Rider will add the missing directive for all types in the file. For more information, see Importing Missing Namespaces.
- A low-priority code issue (in this case, a suggestion related to an unused public member) is greyed out.
- A medium-priority code issue (in this case, a warning about a symbol name that does not fit with the naming style) is highlighted with a blue curly underline.
- A marker corresponding to the suggestion issue (3) is displayed on the marker bar.
- A marker corresponding to the error issue (8) is displayed on the marker bar.
- An action indicator that appears to the left of the caret position if JetBrains Rider has anything to suggest there.
- A high-priority code issues (in this case, errors related to an unresolved symbol and an incorrect return type) are highlighted with red text and red curly underline.
- A marker corresponding to the warning issue (4) is displayed on the marker bar.
- The action list, which opens by pressing Alt+Enter or clicking the action indicator (7), contains a list of quick-fixes for the issue at the caret.
- A short description of the issue at the caret appears in the status bar. You can also view descriptions of code issues by hovering the mouse over highlighted code or over the issue markers on the marker bar (5,6,9)
- If the solution-wide analysis is enabled, JetBrains Rider allows you to see even more code issues. In this example, it detects the unused public member (3) and notifies about errors in other files of your solution. You can click on the solution-wide analysis icon to explore the detected issues.
Toggling design-time inspection
By default, design-time code inspection is enabled in all supported languages. However, you can disable it everywhere or turn it off for specific files if needed. For more information on configuring code inspection, see Configuring Code Inspection Settings.
To disable or enable design-time code inspection
- On the page of JetBrains Rider settings (Ctrl+Alt+S), use the Enable code analysis check box to toggle the design-time code inspection. While you are on this page, you can check out which options you can configure for the code inspection.
- If necessary, you can select the Enable solution-wide analysis check box to enable the Solution-Wide Analysis.
- Click Save to apply the modifications and let JetBrains Rider choose where to save them, or save the modifications to a specific settings layer using the Save To drop-down list. For more information, see layer-based settings.
Navigating between code issues
If the design-time code inspection is enabled, you can easily navigate between all issues (except those with the hint severity level) detected in the current file.
To navigate to the next/previous code issue in the current file
- Press Alt+Page Down to go to the next code issue, or Alt+Page Up to go to the previous code issue.
- In the main menu, choose or. .
- Use the marker bar on the right side of the editor window: clicking on markers brings the caret to the corresponding issues; clicking on the status indicator on top of the marker bar brings the caret to the next issue in the file.
To navigate to the next/previous error
- Press Shift+Alt+Page Down to go to the next error, or Shift+Alt+Page Up to go to the previous error.
- If the Solution-Wide Analysis is enabled and there are some errors, the number of errors is displayed in the right corner of the status bar. You can click this number to go to the next error in the solution.
Inspection options menu
Besides suggested fixes, for each configurable code inspection as well as for custom inspections, JetBrains Rider shows the Inspection [name of inspection] ![]() sub-menu in the actions list, with the following items:
sub-menu in the actions list, with the following items:
- Disable once with comment
- Disable and restore with comment
- Configure inspection severity
- Find all issues of this type
- For the most controversial issues, there is the Why is JetBrains Rider suggesting this? item that opens a code inspection index page with detailed description of the corresponding inspection.
![Inspection [name of inspection] sub-menu Inspection [name of inspection] sub-menu](https://resources.jetbrains.com/help/img/dotnet/2017.2/code_inspection_menu.png)
You can disable the 'Inspection options' sub-menu. To do so, clear the Show code inspection options in action list check box on the page of JetBrains Rider options.
Finding similar issues
You can not only fix a highlighted issue with a quick-fix, but also find and investigate all similar issues (all issues detected with the same code inspection) in the whole solution or smaller scope.
To find similar issues
- Set the caret at a highlighted issue in the editor.
- Press Alt+Enter or click on the action indicator to the left of the caret to open the action list.
- To find similar issues in the current file, choose Inspection [name of inspection] | Find similar issues in [file name] file.
- To find similar issues in the current project or solution, expand the submenu and choose the desired scope:

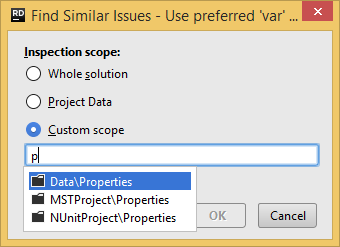
- If necessary, you can search for similar issues in any project or solution folder within your solution. To do so, choose Find similar issues in custom scope in the submenu.
In the dialog that opens, type the name of the desired project or solution folder, and then click OK.
- All found issues will be displayed in the Inspection Results window.