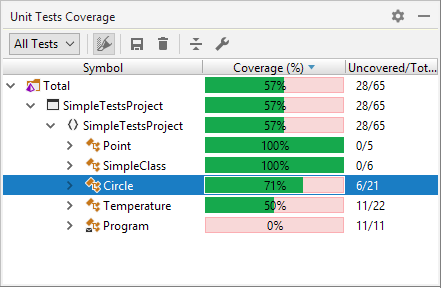
Unit Tests Coverage window
This window allows exploring coverage data obtained during unit tests coverage run. The window shows all code items from a coverage snapshot in a tree structure allowing you to inspect coverage of each item.

In the Coverage column, dotCover uses three colors to display the coverage status:
Green - the percentage of covered statements within the node.
Red - the percentage of uncovered statements within the node.
Grey - the nodes not covered during the test run as they do not have executable code statements.
Toolbar Controls
Control | Name | Description |
|---|---|---|
All Tests | If selected, the tree shows aggregated coverage results from all unit test sessions. | |
All Tests in Active Session | If selected, the tree shows coverage results for all unit tests from the session that is currently selected in the Unit Tests window. | |
Selected Tests in Active Session | If selected, the tree shows coverage results for the test selected in the current session in the Unit Tests window. | |
| Highlight code | Toggles highlighting of the code in the editor for the current coverage snapshot. For more information, see https://www.jetbrains.com/help/dotcover/Visualizing_Code_Coverage.html. |
| Save coverage snapshot as | Saves the current snapshot to a .dcvr file. For more information, see https://www.jetbrains.com/help/dotcover/Saving_and_Loading_Coverage_Snapshot.html. |
| Drop coverage results | Removes the existing coverage results. |