Explore .NET memory while debugging
With JetBrains Rider, you can explore the managed heap while debugging and look into the memory space that is used by your application.
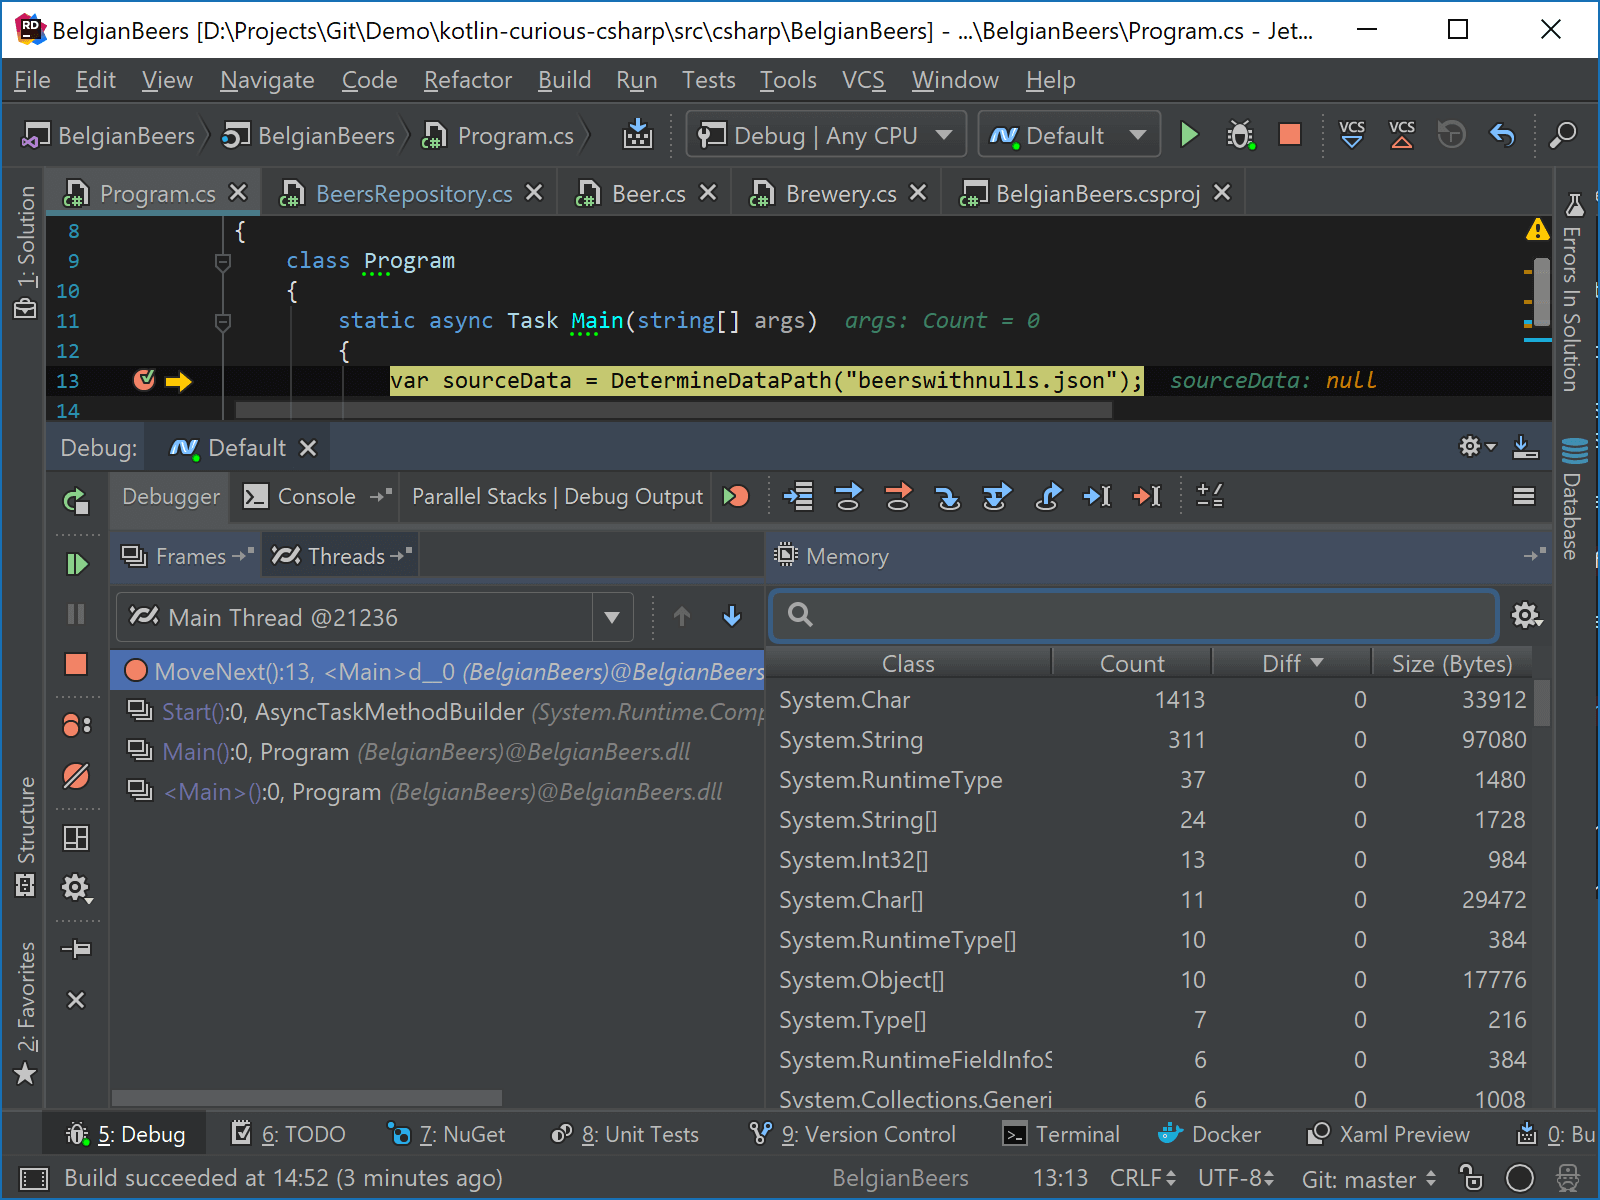
When the debugger hits a breakpoint, you can open the memory view in a separate tab of the Debug window. After clicking the grid, JetBrains Rider shows us the total number of objects in the heap grouped by their full type name, the number of objects and bytes consumed.
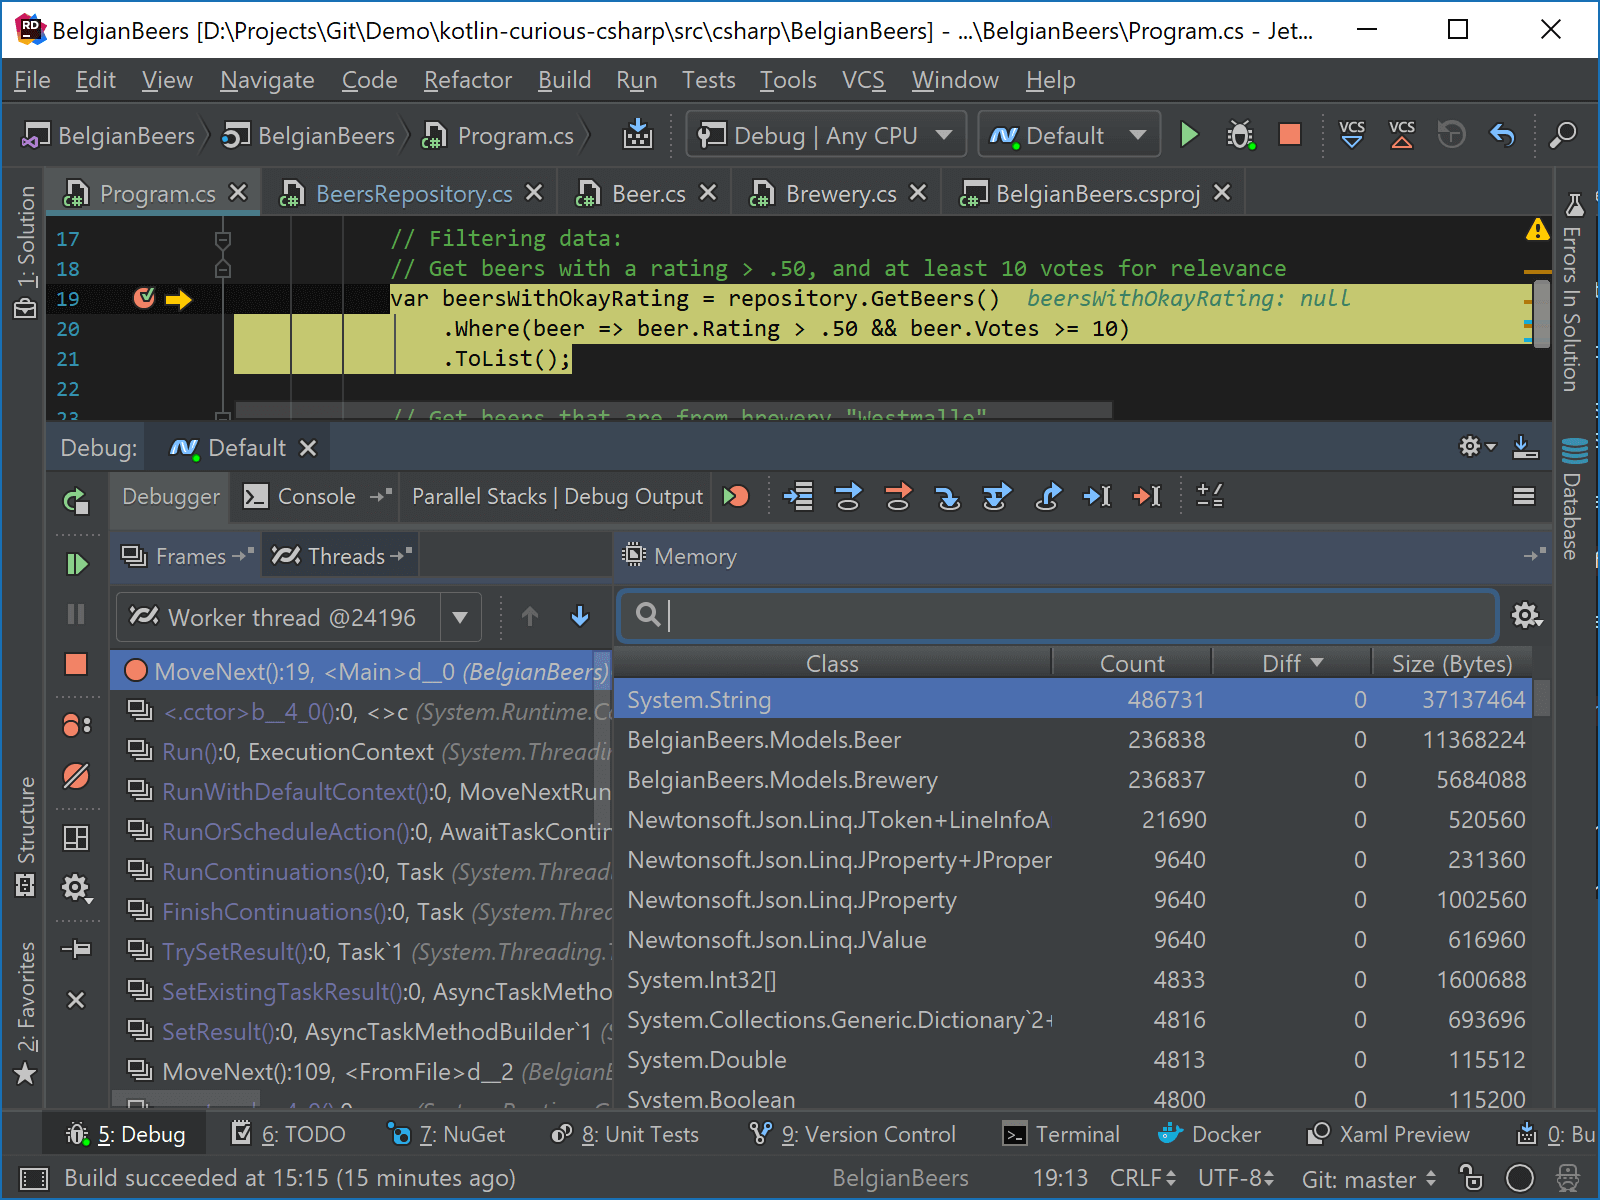
The memory view keeps track of the difference in object count between breakpoints. For example after loading a large amount of data from a JSON file, we can see the number of System.String instances went up dramatically. This gives us an idea of the memory traffic going on in our application, which could potentially influence performance.
By default, the memory is not updated automatically, you have to click the view between each step/breakpoint to update the information. To enable automatic updating of the view, click Memory View Settings ![]() and choose Update Loaded Classes on Debugger Stop.
and choose Update Loaded Classes on Debugger Stop.
In the selector, you can also choose Show Non-Zero Diff Only to hide all classes whose objects were not changed between debugger stops.
From the memory view, you can search for specific types. For example, you can find Beer instances, and then double-click desired one (or press Enter) to open the list of instances, where you can inspect details of the instance or copy its value.
You can also study instances of a type right from the editor — while debugging, set the caret inside a type that interests you, press Alt+Enter and choose Show [type name] Instances.