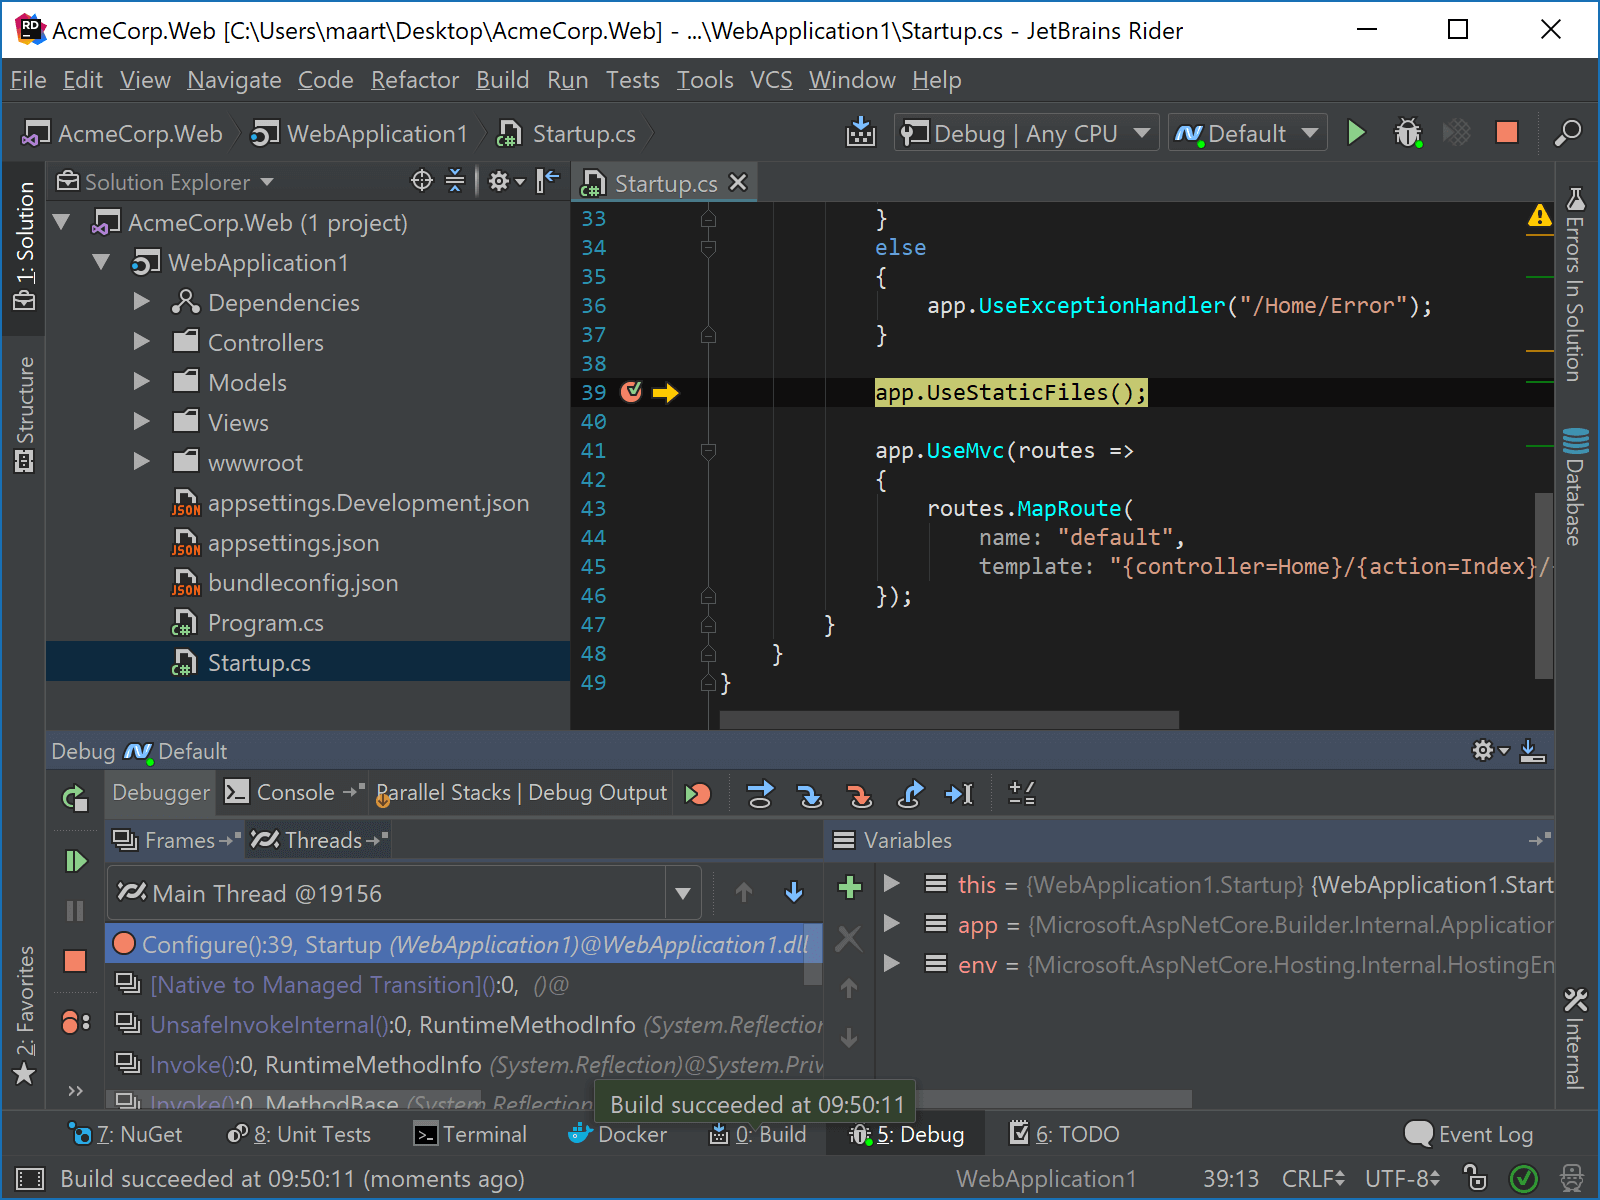
Debug External Code
JetBrains Rider makes debugging external-library code simple, thanks to its integrated decompiler which decompiles external code on the fly and injects it into the debugger.
Debugging external code is supported in full .NET Framework and .NET Core.
You can debug external libraries or .NET Framework following the same general steps as with your own code:
You can start a debugging session or attach the debugger to any running .NET or .NET Core process.
If you attach to a running process, you can debug it even if there are no related source code in your solution. With the debugger attached, use Search Everywhere Ctrl+T to find types and methods in the target application. JetBrains Rider will decompile and display the symbols in the editor, and you will be able to set breakpoints there.You can pause execution at any point in time and examine the program stepping through the code.
Each time you step into code that is implemented externally, JetBrains Rider will automatically decompile it and display the execution point.You can also set breakpoints in decompiled code.
To navigate to symbols in external code from your source code, you can use almost all of the navigation and search features — if the navigation target is in a library code, JetBrains Rider will automatically decompile and display it in the editor. The easiest way to jump to library code is to Ctrl -click any usage of a library symbol or press Ctrl+B.When analyzing stack trace, you can double-click any stack frame, and JetBrains Rider will either navigate to the code directly (if it’s in your own codebase), or decompile the code for that stack frame and open it in the editor.

To disable external-code debugging, clear Enable external source debug on the page of JetBrains Rider settings Ctrl+Alt+S.
If this option is disabled, you can still navigate to external code and set breakpoints there. However, breakpoints in external code will be ignored by the debugger and you will not be able to step into external code. So your debugging experience will be limited by the source code in your solution.