Profile Unity Applications
JetBrains Rider comes with bundled performance profiler that allows finding performance bottlenecks in your Unity games. This includes finding slowest methods in your scripts, determining the cause of CPU starvation, blocking garbage collection, disk I/O, and other issues. The integrated profiler is based on JetBrains dotTrace and is compatible with Unity 2018.3 and later. You can use the profiler via the dotTrace Profiler tool window. For more details on the integrated profiler, refer to Performance Profiling of .NET Code.
Installation and licensing
dotTrace is provided as a bundled plugin for Rider, and installed along with Rider automatically with no additional actions needed. If for some reason you want to disable dotTrace, you can do this via Rider's Plugins settings.
Note that dotTrace is available in Rider only for the owners of dotUltimate or All Products Pack subscriptions.
There are two ways to profile a Unity application:
Profile a project opened in the Unity Editor: in this scenario, the profiler will restart the Unity Editor with profiling enabled. This is the most convenient way in case you need to profile the Unity project that is currently opened in the Unity Editor and Rider. The downside of this method is that you have to close the currently running Unity Editor instance.
Profile a Unity application executable file: if you have a compiled Unity application executable, you can profile it without the need to restart the Unity Editor.
Profile a project opened in the Unity Editor and Rider
Close the Unity Editor if it is open.
In Rider, on the toolbar, choose a run configuration: either Attach to Unity Editor or Attach to Unity Editor and Play.
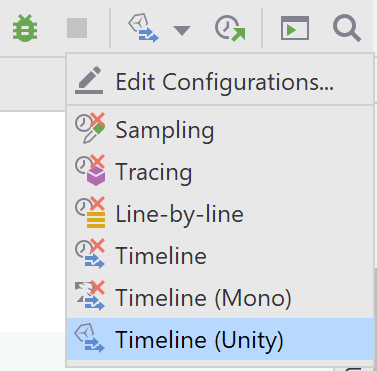
On the toolbar, make sure the Timeline (Unity) profiling configuration is selected.
On Windows, you can also profile the native part of your Unity application. To do this, you should select the Enable native profiling option in the profiling configuration settings. This option may be helpful for finding low-level performance issues related to rendering and other Unity engine subsystems.

Run profiling by clicking the
 Profile 'Attach to Unity Editor' using 'Timeline (Unity)' profiling configuration button on the toolbar.
Reproduce the performance issue you are looking for or, if you just evaluate the overall app performance, go through the desired usage scenarios in your application.
Click
 Get Snapshot. The collected snapshot will be added to the list of snapshots inside the dotTrace Profiler window. To start collecting profiling data again, click
  Start Recording.
After you collect a snapshot(s), you can finish the profiling session. Normally, you do it either by closing the profiled application or using the
 Kill button (it forcibly terminates the profiled app and the session, so, use it only in emergency cases).
Profile an executable file of a Unity app
Create a new run configuration based on Unity Executable.
Select this run configuration on the toolbar.
On the toolbar, choose the Timeline (Unity) profiling configuration.
On Windows, you can also profile the native part of your Unity application. To do this, you should select the Enable native profiling option in the profiling configuration settings. This option may be helpful for finding low-level performance issues related to rendering and other Unity engine subsystems.
Run profiling by clicking the
 Run 'your_config' with 'Timeline (Unity)' button on the toolbar.
Reproduce the performance issue you are looking for or, if you just evaluate the overall app performance, go through the desired usage scenarios in your application.
Click
 Get Snapshot. The collected snapshot will be added to the list of snapshots inside the dotTrace Profiler window. To start collecting profiling data again, click
  Start Recording.
After you collect a snapshot(s), you can finish the profiling session. Normally, you do it either by closing the profiled application or using the
 Kill button (it forcibly terminates the profiled app and the session, so, use it only in emergency cases).