Debugging
Debugger is an integral part of JetBrains Rider that allows you to examine the runtime behavior of your application, identify problematic code, and isolate the source of the problem step by step.
Typical debugging steps
Define a run/debug configuration for the application to be debugged.
Set breakpoints in the source code where the potential problem may lie.
Start a debugging session Shift+F9.
When the program execution breaks, step through your code, evaluate expressions, and set watches.
You can also edit the code of a suspended program and then continue debugging without restarting. The project will recompile in the background. This works in projects targeting .NET Framework and .NET Core on Windows (except WPF) when Enable Edit And Continue is selected on the page of JetBrains Rider settings Ctrl+Alt+S.
There are cases when modifying the code is not possible and a restart is required. These include changing signatures, modifying generic functions, renamings of any kind, and some more. If this happens JetBrains Rider will make you aware by showing a tooltip.
Resume the debugging session F9 to let the program run to the next breakpoint, if any.
To finish the debugging session, press Ctrl+F2, select in the menu, or click Stop
 in the Debug window.
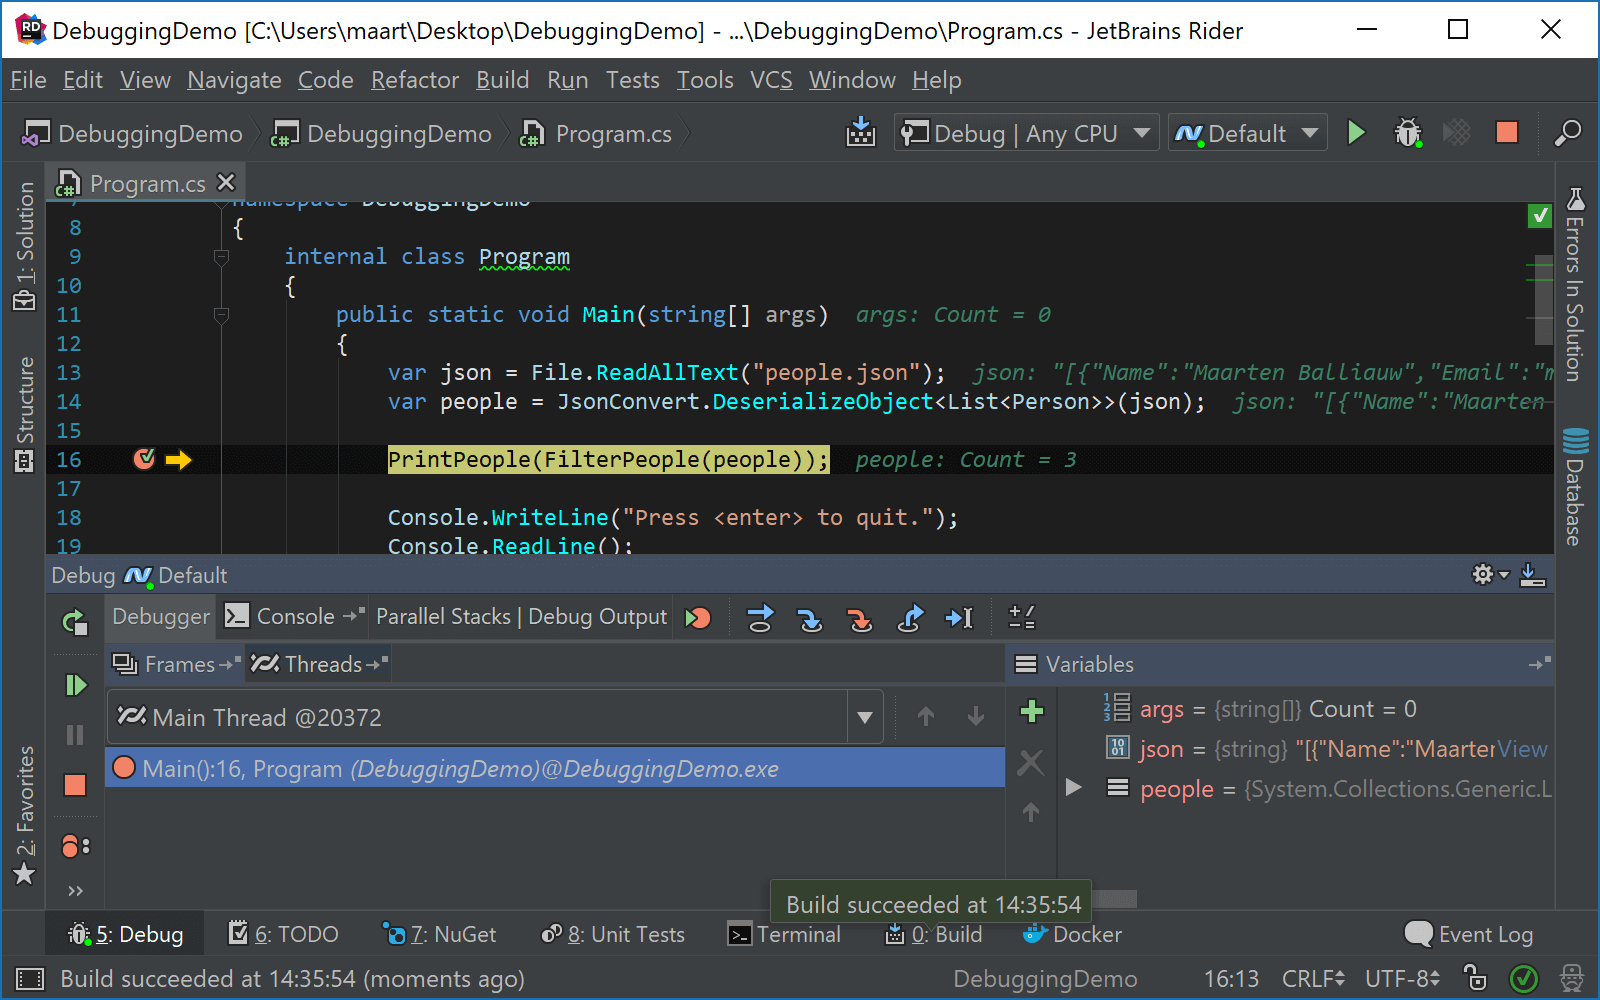
The major part of debugging activities takes place in the Debug window, which becomes available once you start debugging. To open this window, press Alt+5 or select View | Tool Windows | Debug in the main menu.
While debugging, you can also perform the most common debugger actions from the Alt+Enter menu. For example Run to Cursor, Skip to Cursor or Toggle breakpoints:
You may be also interested in the following language- and framework-specific guidelines: