Debug LINQ expressions
When working with LINQ expressions in C#, you can debug them visually with JetBrains Rider, with a clear representation of how data is transformed at each step of the query.
Consider the following example:
Let’s use the Rider LINQ debugging feature to analyze the LINQ expression step by step.
Suspend the program execution at the LINQ expression by setting a breakpoint on the line:
var result = Enumerable.Range(1, int.MaxValue) // Breakpoint here .Skip(skip) .Take(limit) .Where(IsPrime) .ToList();When execution is paused at the breakpoint, you’ll notice the Explore LINQ inlay hint displayed above the LINQ expression:

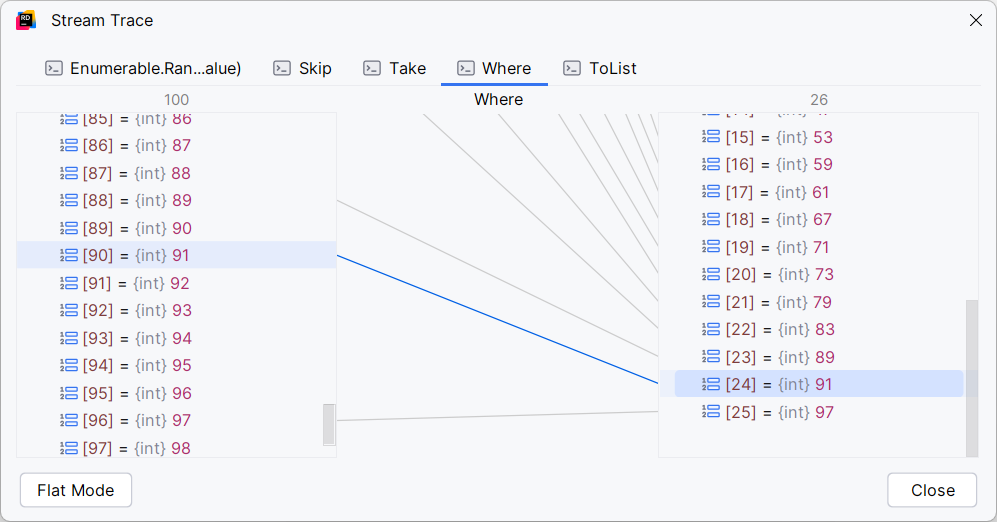
Click Explore LINQ to open the LINQ visualizer. Rider will display a detailed breakdown of how data flows through each step of the LINQ chain in a dialog:

Use this visualization to see how the data changes at each stage:
Range: The initial sequence generated by
Enumerable.Range.Skip: How many items are skipped by the
Skipmethod.Take: The subset of items selected by
Take.Where: Items filtered based on the
IsPrimemethod.
Analyze the intermediate results step by step to uncover issues. For example, in this code, you’ll notice that the number
91is included in the results, which points to the error in theIsPrimemethod.
The Explore LINQ feature is especially helpful for debugging complex LINQ queries by making their transformations visible and comprehensible at a glance.
Enable the LINQ Debugger plugin
This functionality relies on the LINQ Debugger plugin, which is bundled and enabled in JetBrains Rider by default. If the relevant features are not available, make sure that you did not disable the plugin.
Press Ctrl+Alt+S to open settings and then select .
Open the Installed tab, find the LINQ Debugger plugin, and select the checkbox next to the plugin name.