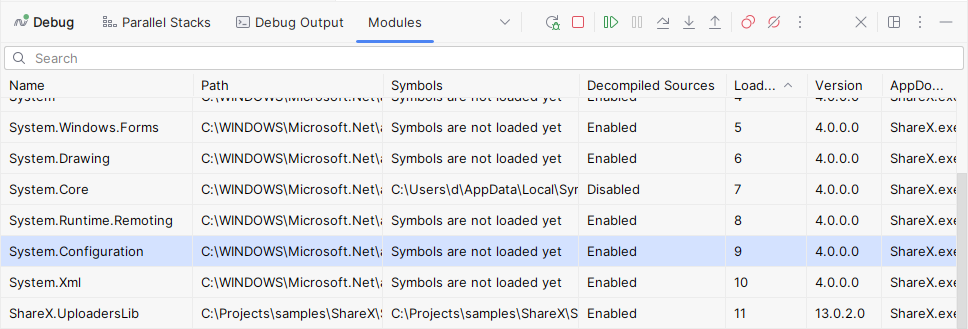
View loaded modules (.exe and .dll)
When you debug a program in Rider, you can see all compiled libraries and executables that are loaded in a dedicated tab of the Debug window, which you can open by pressing Alt+5 or choosing from the main menu.

Load symbols
The Modules view helps you control how to debug the code of each module. By default, when you step into functions of a module, JetBrains Rider tries to load symbols and if they are unavailable, it decompiles the module on the fly.
If you want to use symbols from the module's PDB, right-click it and choose Load Symbols. JetBrains Rider will look for symbols next to the module file and on symbol servers specified on the page of JetBrains Rider settings Ctrl+Alt+S. If symbols are not found, you will be prompted to specify the PDB file location manually.
If symbols are loaded successfully, the path to the PDB will be displayed the Symbols column, and decompiled sources will be disabled.
If symbols for a module become unavailable during debugging, for example, when you load symbols from a symbol server and your Internet connection is lost, you can right-click the module and choose Enable Decompiled Sources. this corresponds to the Enabled state in the Decompiled Sources column.
Find modules and symbols on disk
To locate the module file on disk, right-click it and choose . If symbols of the module are loaded, you can right-click the module and choose .
Study loaded modules
To see what is inside the module, right-click it and choose View in Assembly Explorer. The module will be added to the Assembly Explorer window where you study its contents.