Endpoints tool window
The Endpoints tool window provides an aggregated view of both client and server APIs used in your project for HTTP and WebSocket protocols. The tool window can assist you when developing microservices and backend-frontend communication. It is also helpful for exploring third-party APIs.
To navigate to the endpoint declaration from the Endpoints tool window, do one of the following:
Select Jump to source from the endpoint's context menu.
Select the endpoint and press F4.
Double-click the endpoint.
In the Endpoints tool window, you can filter the list of endpoints by module, type, and framework. To list endpoints from external sources (for example, from remote OpenAPI specifications) , select External under Module.
Endpoints marked as deprecated appear with a strikethrough (crossed out).
Supported frameworks
JetBrains Rider recognizes endpoints from the following frameworks:
gRPC/Protobuf
MicroProfile Rest Client
Micronaut HTTP Controllers
Micronaut HTTP Client
Micronaut Management Endpoints
Micronaut WebSocket
Helidon MP
Helidon SE
Quarkus
OpenAPI 3
Swagger 2
WSDL
Retrofit 2
OkHttp 3+
Toolbar
Item | Description |
|---|---|
Module | Filter endpoints by module or select an external module |
Type | Filter endpoints by type |
Framework | Filter endpoints by framework |
Configure OpenAPI Sources: Add an external OpenAPI specification (for example, from SwaggerHub) to include endpoints from this specification in the Endpoints tool window and highlight them with a yellow background. In the OpenAPI Specifications window that opens, click For more information, refer to Add a remote OpenAPI specification. | |
Show and hide the details panel | |
Configure the tool window layout and filters:
|
Endpoint details
When you select an endpoint, you can see the details in the dedicated pane. Use or
to show and hide the details pane.
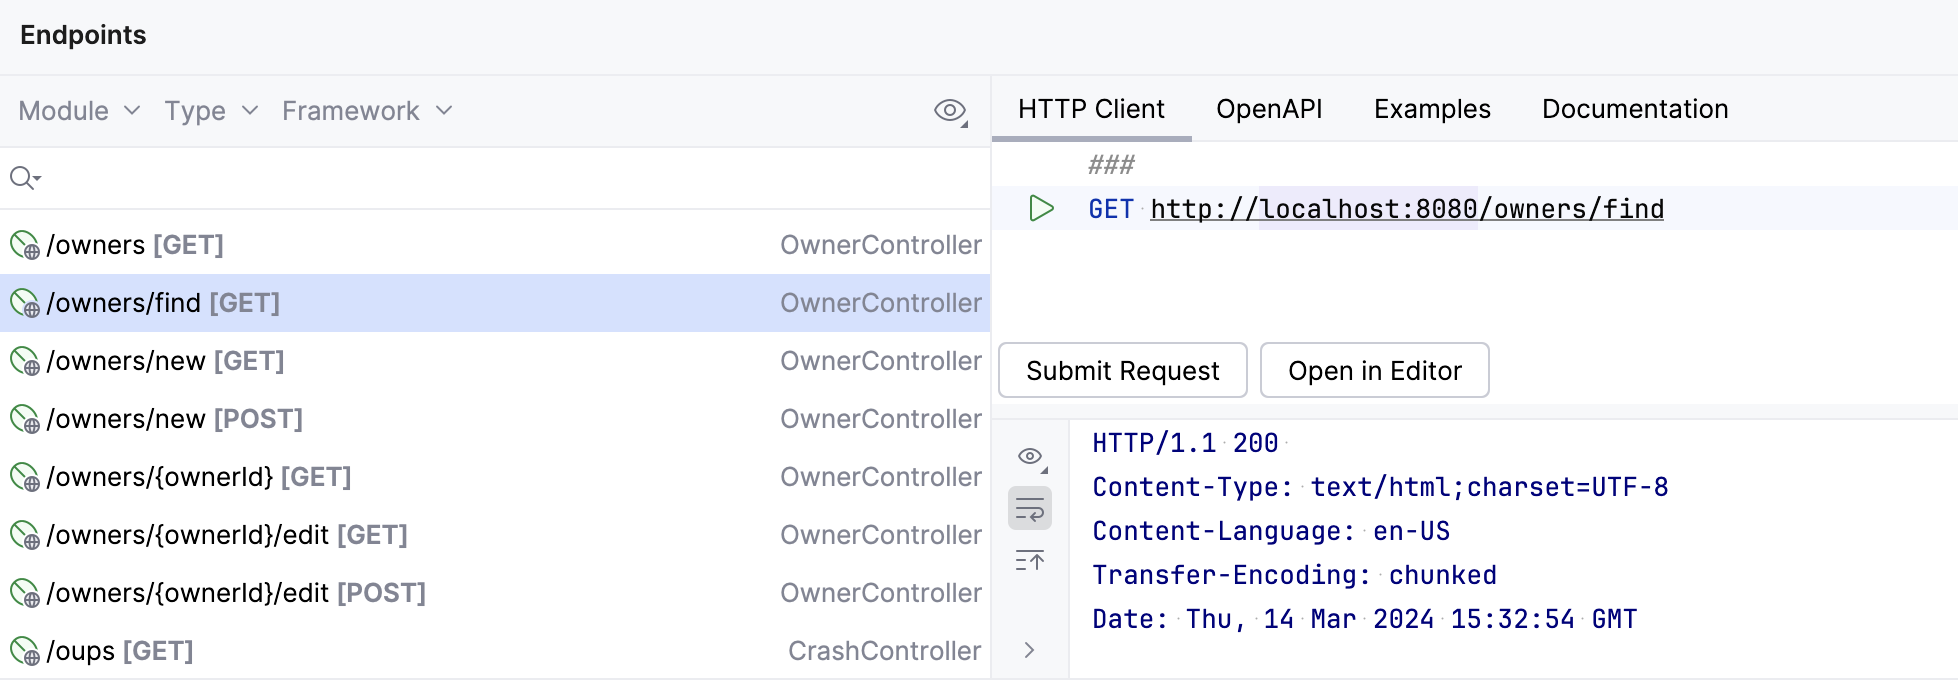
Shows the generated HTTP or gRPC request for the selected endpoint.
If the corresponding server is running, you can click Submit Request to see the response immediately or Open in Editor to edit it in a separate HTTP requests file in the editor. For more information, refer to HTTP Client.

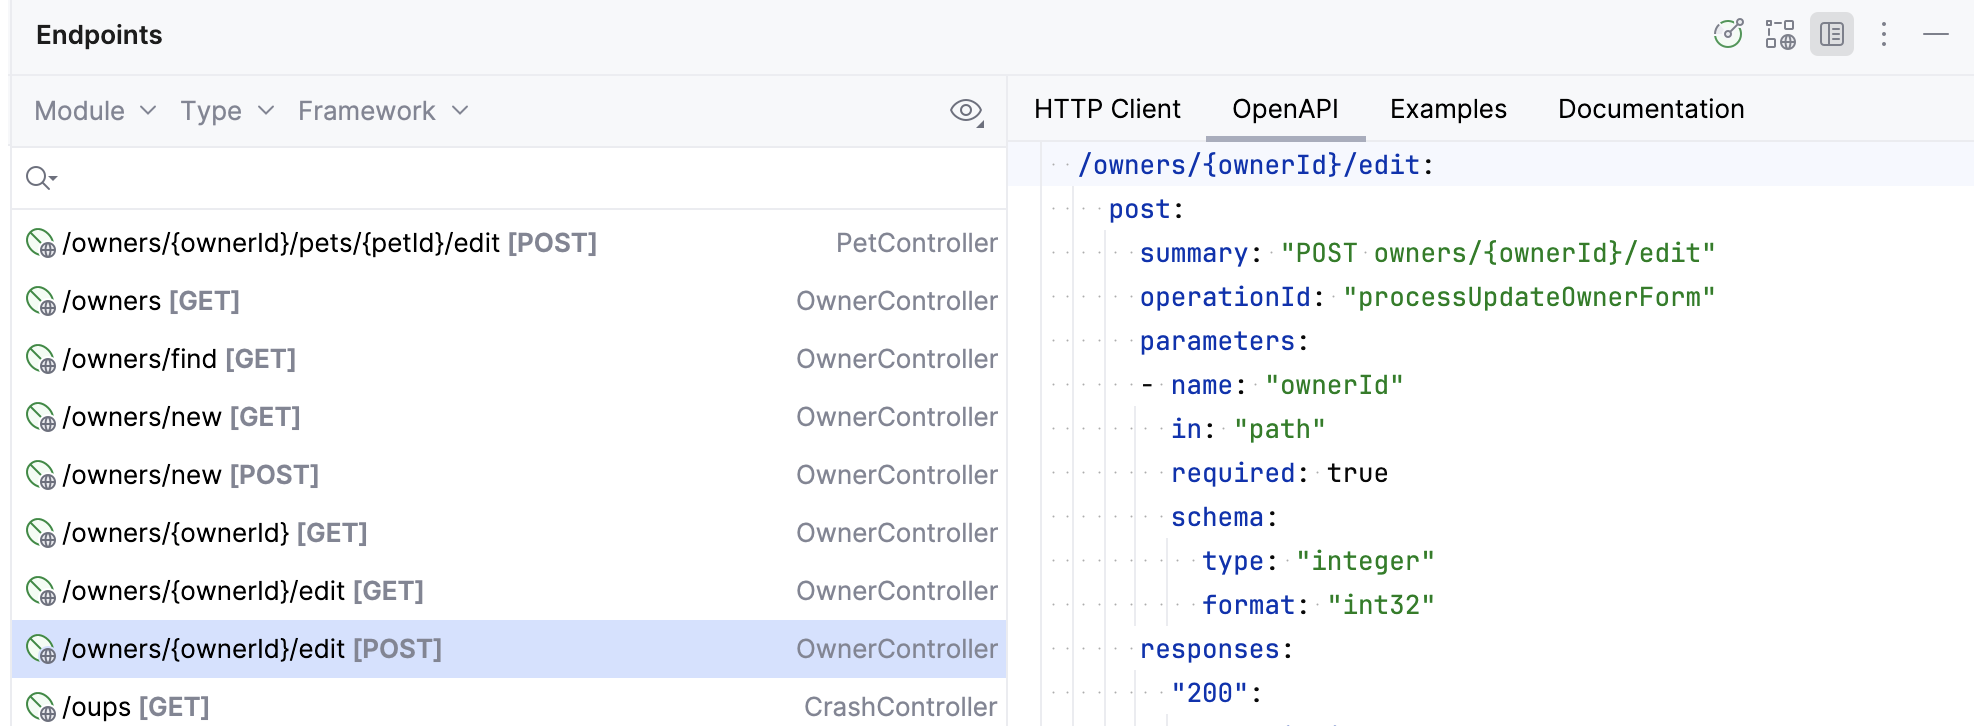
Shows the generated OpenAPI specification for the selected endpoints.
You can also generate an OpenAPI specification for an entire module: right-click a module in the Endpoints tool window and select Export Draft of OpenAPI Specification.

To preview the specification in a separate file, click .
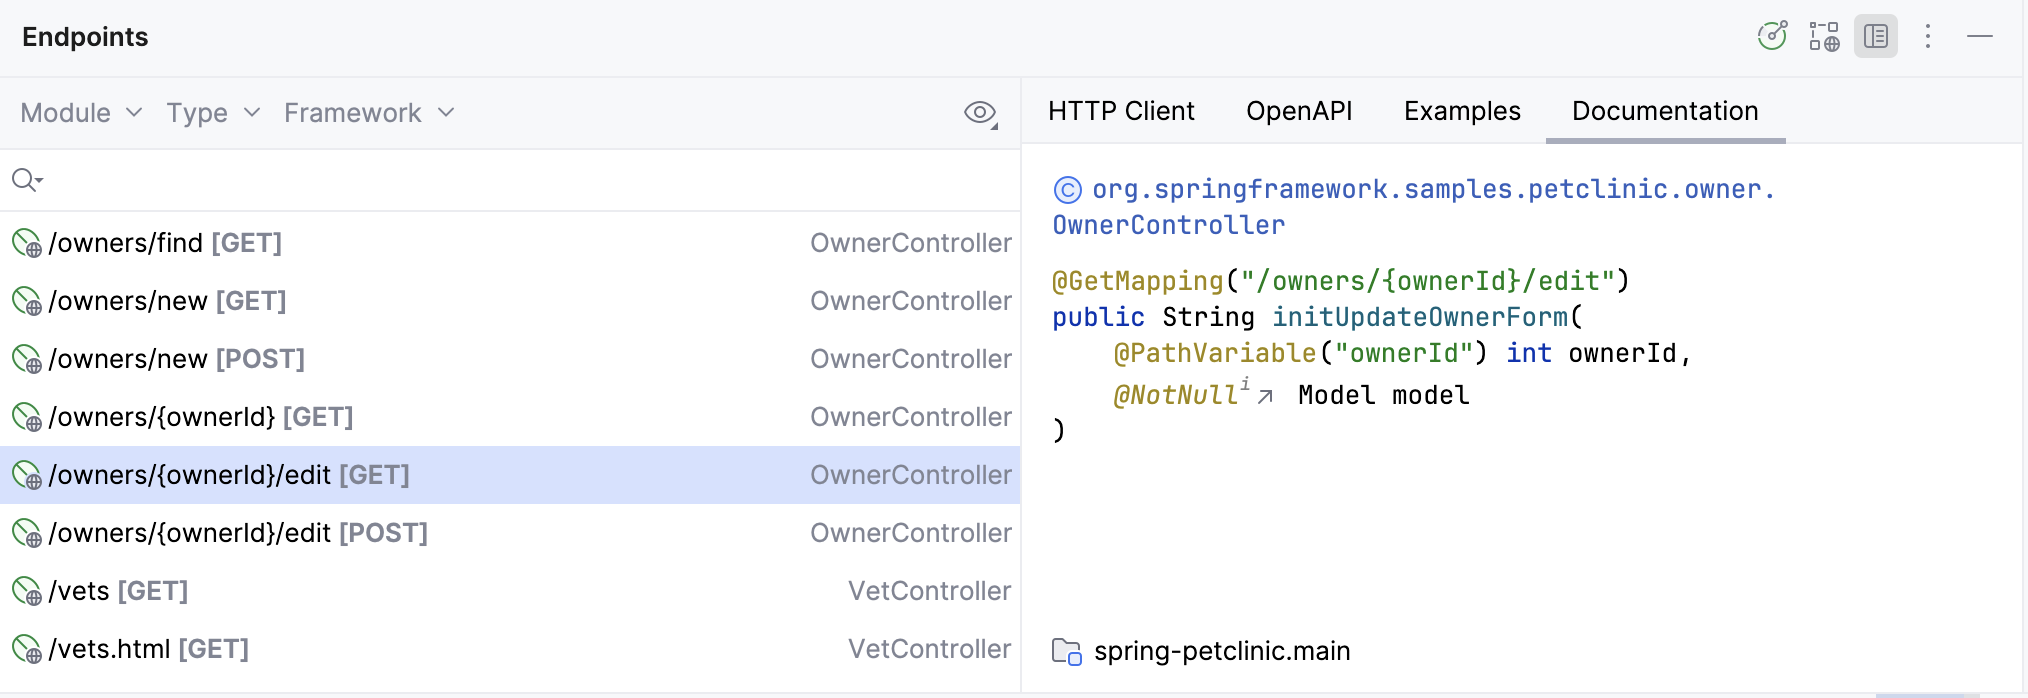
Shows the documentation for the selected endpoint. Double-click an endpoint to navigate to its source code.
