Angular
Angular is a popular framework for building cross-platform applications. JetBrains Rider provides support for Angular and helps you on every step of the development process – from creating a new Angular app and working on the components to debugging and testing it.
Before you start
Download and install Node.js.
Make sure the JavaScript and TypeScript and Angular and AngularJS required plugins are enabled on the Settings | Plugins page, tab Installed. For more information, refer to Managing plugins.
To open an application that is organized in a directory structure and does not have a solution file, press Ctrl+Shift+O or choose from the main menu, choose the root folder of the application, and click Select Folder.
Write and edit your code
Configure the Angular language service
JetBrains Rider provides full Angular-specific coding assistance including code completion, error detection and highlighting, hints, and navigation inside Angular templates. You can configure to get coding assistance for Angular projects from the Angular language service, from the TypeScript Language Service, or only from the internal JetBrains Rider parser and code inspections.
By default, the Angular language service is enabled and is listed in the Language services wizard on the Status bar.
To open the Angular settings, click
 on the Status bar and click
  .
.
Alternatively, press Ctrl+Alt+S to open settings and select Settings | Languages & Frameworks | TypeScript | Angular.
Specify the service to get coding assistance for .ts files from.
By default, the Auto option is selected so JetBrains Rider automatically enables the Angular language service in any appropriate context. As a result, type evaluation is performed based on the data from the TypeScript language service while internal JetBrains Rider inspections are also applied.
Select the Disabled option to get coding assistance based only on the data from the internal JetBrains Rider parser and inspections.
Restart the Angular language service
Click
on the Status bar and then click  next to Angular TypeScript <version>.
Configure type evaluation
Click
 on the Status bar and select the checkboxes next to the services from which you want to get type evaluation. Restart JetBrains Rider, when ready.
Alternatively, press Ctrl+Alt+S to open settings and select Settings | Languages & Frameworks | TypeScript | Angular, select Auto, and then select Enable service-powered type engine checkbox.
By default, the checkbox is cleared, so type evaluation, resolution, code inspections and refactorings are based on the type information from the JetBrains Rider internal TypeScript engine.
This default behavior may result in performance issues and in bugs in type resolution because the type evaluation algorithm that the JetBrains Rider internal TypeScript engine uses differs from the algorithm of the Angular language service. Selecting the checkbox may help avoid these problems.
Configure memory handling
Although JetBrains Rider strives at providing slick integration with language services, there may still arise out-of-memory errors induced by a language service rather than by JetBrains Rider itself.
To prevent out-of-memory errors or have them solved seamlessly, thus ensuring stable operation of language services, you can configure memory handling. Learn more from Language Services
Memory handling settings for the Angular language service are always inherited from the TypeScript language service.
Configure memory handling for TypeScript language service
Open settings by pressing Ctrl+Alt+S and navigate to .
In the Language Services Memory area, choose the memory handling mode:
Select Automatically increase memory, if available to have memory increased and language services restarted silently.
Alternatively, select Set memory limit and specify the maximum memory to use by a language service.
If the specified memory size exceeds the available RAM, JetBrains Rider suggests an appropriate value in a tooltip.
Components
With JetBrains Rider, you can create Angular components in several ways:
Create a component folder with a bunch of related .ts, .html, and .css files.
Extract a component from a template using a dedicated refactoring.
Create a component using a predefined template
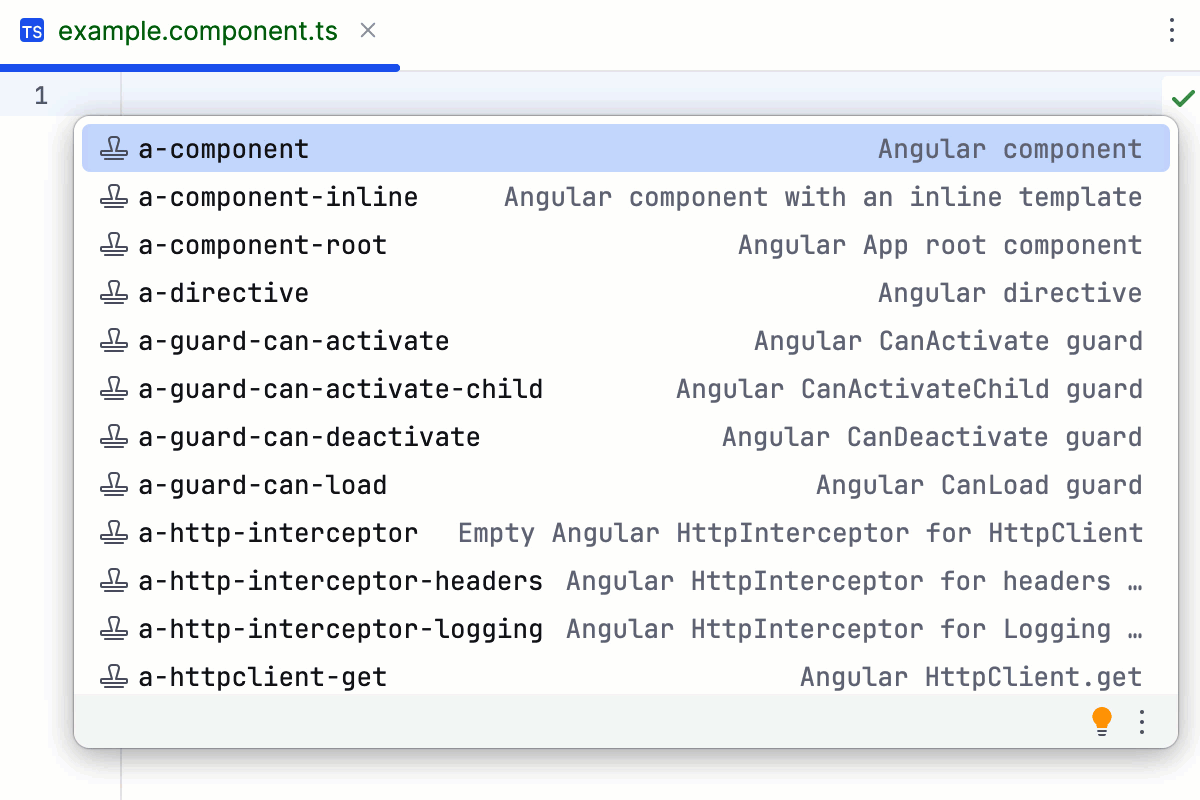
JetBrains Rider provides predefined live templates for creating Angular components, such as a-component, a-component-inline, and a-component-root.
For more information about live templates, refer to Live templates.
To view a full list of predefined templates, open the Settings/Preferences dialog (Ctrl+Alt+S) , go to , and expand the Angular node.
In the editor, press Ctrl+J, select the appropriate template (for example,
a-component) from the list, and then press Enter.JetBrains Rider generates a component stub, places the caret at a field with canvas, and waits for you to specify the component name there. As you type the component name, the name of the selector and the template URL are filled in automatically in accordance with the Angular Style Guide.
If necessary, make the new component standalone using the inspection pop-up.

Learn how to customize a template with variables from Using and Creating Code Snippets in WebStorm Blog.
Create a component folder
In JetBrains Rider, you can create a bunch of files for an Angular component in one action and even place them all in a separate folder. To do that, you need to use a file template with several child templates. When you create a file from the parent template, the related files from the child templates are generated automatically.
Suppose you want to create an example folder with a bunch of component files, for example, example.component.ts for logic, example.component.html for the template, and example.component.css for styles. You can create a file template with two parent templates so all the three files will be generated at once and placed in a separate folder.
In the Settings/Preferences dialog (Ctrl+Alt+S) , select .
First create a template for a TypeScript component file:
In the Files tab, click the Add button (
 ) on the toolbar.
A new, Unnamed, template is added to the list.
In the right-hand pane, specify the template name, let it be Angular Component, and
component.tsas the file extension.In the File name field, type
$NAME/$NAME.Optionally, add a code template, for example:
/* * Created by ${USER} on ${DATE} */ import { Component } from '@angular/core';

Click Apply.
Create a child template for the related HTML file:
Select the parent template Angular Component and click the Create Child Template File button
 on the toolbar.
A child template is added below the Angular Component template.
In the right-hand pane, type
$NAME/$NAMEin the File name field and specify thecomponent.htmlextension.

Click Apply.
Create a child template for the related Style Sheet.
Select the parent template Angular Component and click
on the toolbar. A child template is added below the Angular Component template.In the right-hand pane, type
$NAME/$NAMEin the File name field and specify thecomponent.cssextension.
Click OK to save the templates.
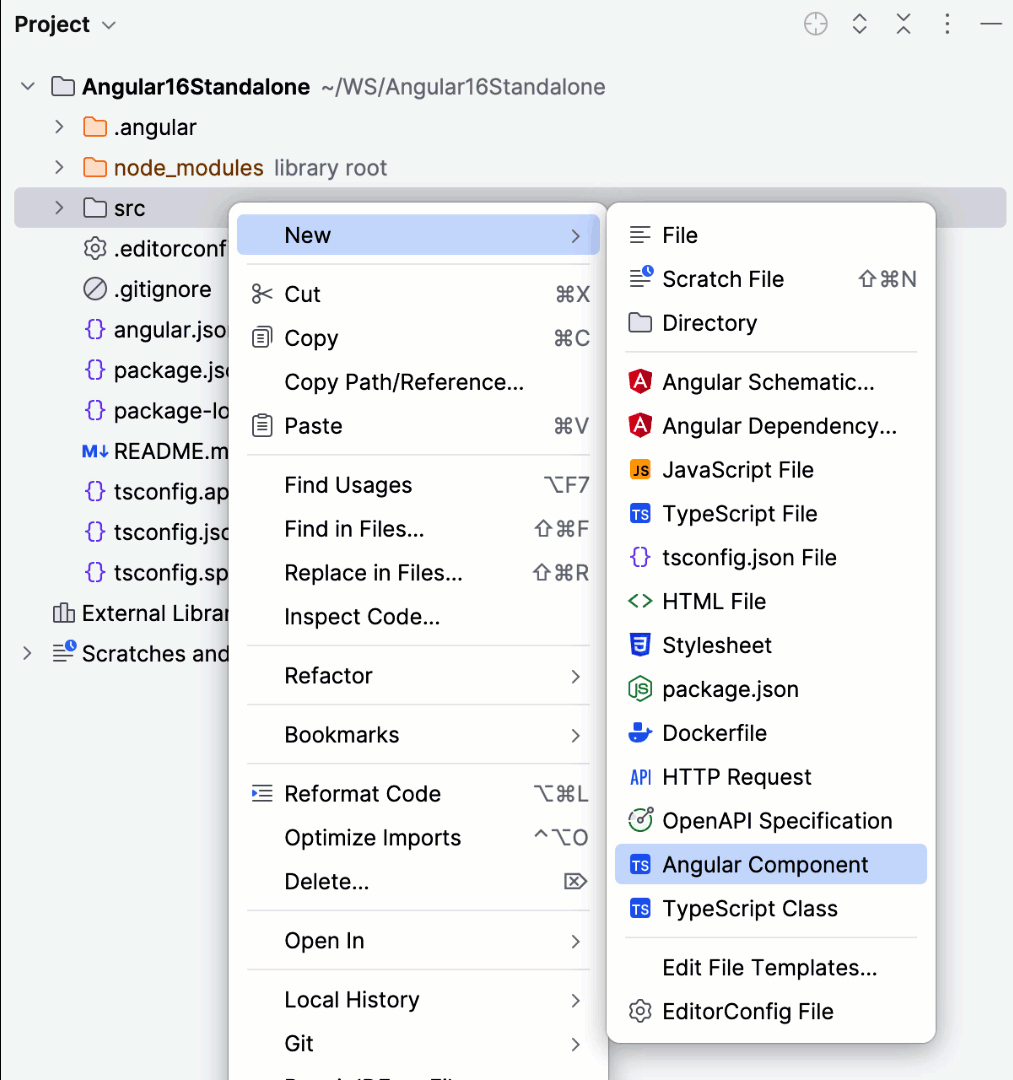
Create the component files.
From the context menu of the folder where you want to store the component files, select . In the dialog that opens, specify the name that will be used for the folder and for the component files in it (example in this example).
Extract a component from a template
The Extract Angular component refactoring works by running ng generate component, taking schematic preferences inside your angular.json file into account.
In an HTML template file, select the code fragment that you want to extract into an Angular component.
From the context menu of the selection, choose .
Alternatively, press Ctrl+Alt+Shift+T and select from the Refactor This popup.

In the dialog that opens, specify the name of the new component.
Standalone components
If your project uses Angular 19, Components, Pipes and Directives are by default standalone. For components that are declared via NgModules, set standalone: false.
JetBrains Rider detects incorrect imports of non-standalone pipes, directives or components and usages of the imports property within non-standalone components:

Signals
With JetBrains Rider, you can easily create Angular signals straight from signal, computed, and effect templates.
Create signals
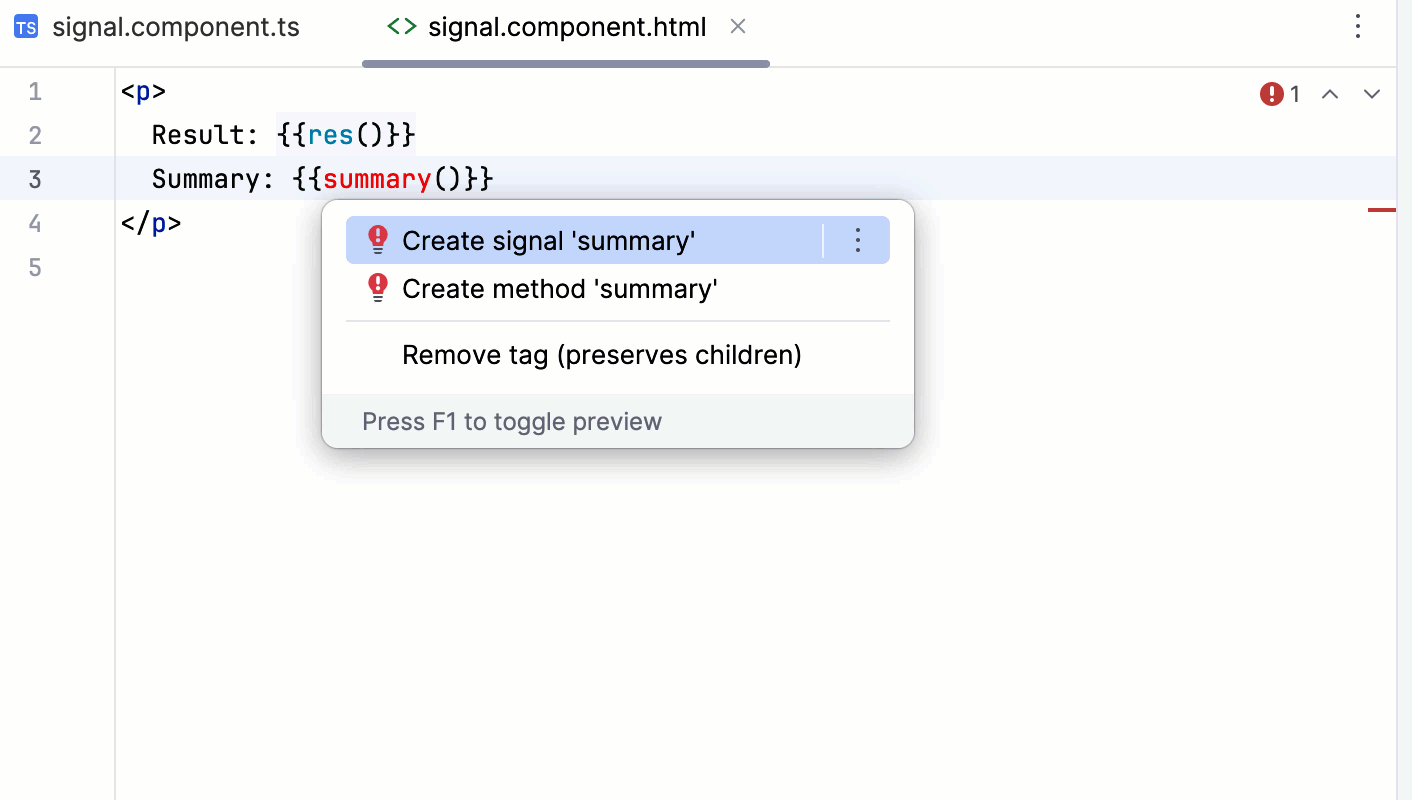
Write the function you need. JetBrains Rider runs an inspection and highlights the new function as unresolved.
Hover over the highlighted function and click the Create signal '<function name>' link in the popup.

Alternatively, place the cursor at the highlighted function, press Alt+Enter, and select .

JetBrains Rider brings you to the component TypeScript file where a stub of the new signal is generated. Fill in the placeholders as necessary.
JetBrains Rider recognizes, highlights, provides documentation and completion, and supports navigation for contentChild, contentChilden, viewChild, and viewChildren signal queries.
Configure highlighting for Angular signals
Press Ctrl+Alt+S to open settings and select Editor | Color Scheme | Angular Template.
Select Signal in the list and click the color indication next to Foreground.

Select the color you prefer and click Apply.
Structural directives
JetBrains Rider recognizes structural directives and provides highlighting within templates.
For binding keys and template context properties, completion is suggested in a popup:

Rename refactoring is provided for template binding keys mapped to directive inputs.
Parameter info popup shows automatically on completing attributes or on pressing Ctrl+P.

Host listeners and bindings
JetBrains Rider provides full support for host listeners and bindings.
Completion, highlighting, quick documentation for
@HostListenerand@HostBindingdecorators.
Event completion for
@HostListener
Type Check Blocks (TCB) are generated for host binding.
Support for CSS classes across host bindings and HTML templates

Reactive forms
JetBrains Rider provides support for Angular Reactive Forms.
Building nested form group model structure from field initializer with the
new FormGroup({.. .})and withFormBuilder.group({...})calls as well as field initialization in a constructor with theFormBuilder.group({...})call.JetBrains Rider recognizes
control,groupandarraywithin the form group object initializer, new instance calls (FormGroup,FormControlandFormArray), and as well asFormBuildermethods.
For
FormGroup.get()call, JetBrains Rider provides code completion, name validation, quick fixes for unknown segments and syntax highlighting within the string literals.")
For
formControlName,formGroupName, andformArrayNamein HTML templates, code completion, name validation, quick fixes to create missing control, syntax highlighting, and structural dependency is provided.
Incremental hydration
JetBrains Rider supports Angular 19 @defer hydrate syntax.
Code completion

Quick documentation lookup

Error reporting for Angular version earlier than 19.

Wrap HTML templates in Control Flow blocks
In an Angular HTML template, select a code fragment, press Ctrl+Alt+T, and then select the enclosing code from the list.

Add new features with ng add
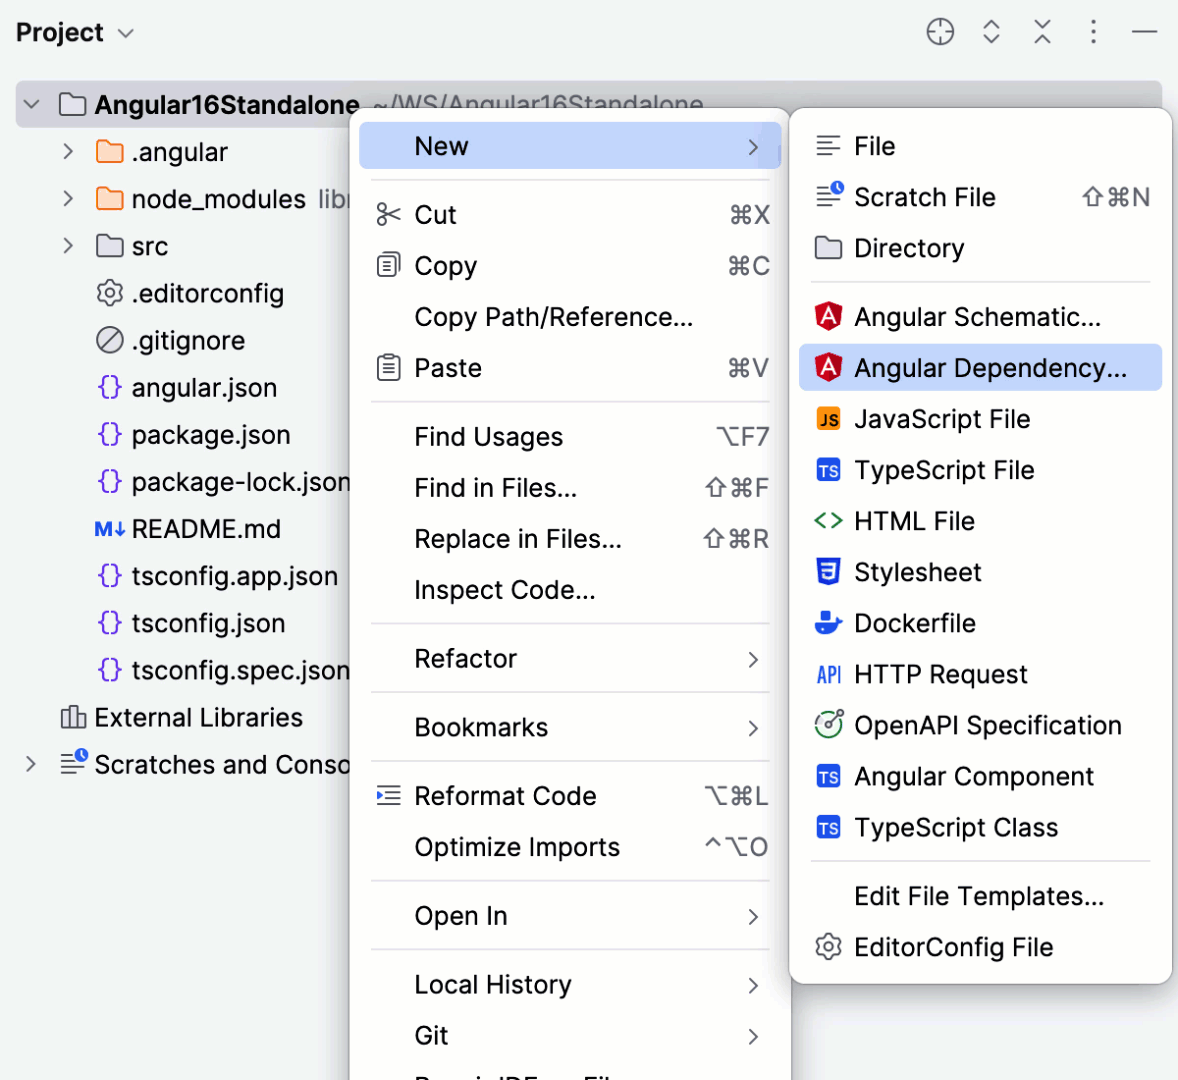
You can add most published Angular libraries using the Angular Dependency action. This action runs the ng add command which installs the dependency and updates the app in the current working directory to use that dependency. Note that not all libraries support installation with ng add.
Select from the main menu or press Alt+Insert in the Explorer tool window (Alt+1) , and then select Angular Dependency.
From the list, select the library to add. The list shows the libraries that can be definitely installed with
ng add. To install a package that is not on the list, scroll to its end and double-click the Install package not listed above link, then specify the package name in the dialog that opens.Follow the steps of the wizard.
The example below illustrates adding Angular Material to a project.
If you manage dependencies manually through your package.json, JetBrains Rider still recognizes packages that support ng add. When you add such package to package.json, JetBrains Rider suggests installing it with ng add.

View parameter hints
In Angular HTML templates, Parameter hints show the names of parameters in methods and functions to make your code easier to read. In templates, information on block parameters is shown on completion.
Configure parameter hints
Open the Settings/Preferences dialog (Ctrl+Alt+S) and go to .
Expand Angular HTML template under Parameter names.
Specify the context in which you want parameter hints shown by selecting the corresponding checkboxes.
The preview shows how the changes you make in the settings affect the code appearance.
For some methods and functions, JetBrains Rider does not show parameter hints in any context. Click Exclude list... to view these methods and functions, possibly enable parameter hints for them, or add new items to the list.
To hide parameter hints for any value type in any context, clear the Angular HTML template checkbox under Parameter names.

Inspect your code
JetBrains Rider brings a number of Angular-specific inspections that help you find errors as you edit your code and suggest quick-fixes for them.
Duplicate properties
In the example below, both a template and a templateUrl properties are used. JetBrains Rider detects the error, warns you about it, and suggests a quick-fix.

Incorrect use of structural directives
JetBrains Rider warns you about incorrect use of the *ngIf and *ngFor structural directives.

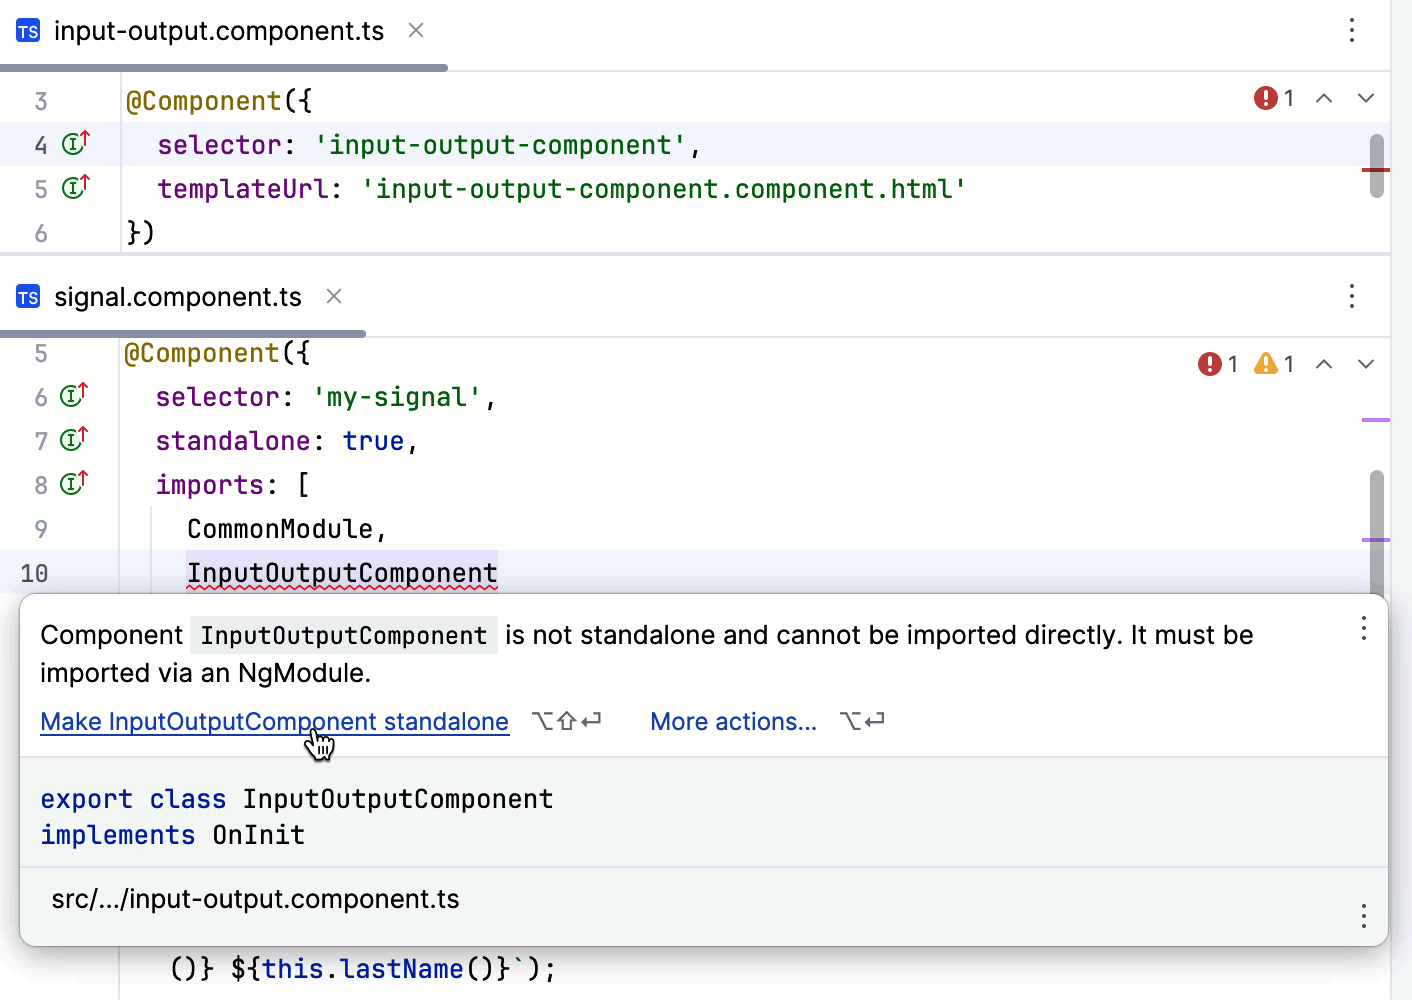
Use of standalone components
Angular-specific inspections help you identify improper usage of standalone components. In the example below, JetBrains Rider detects an import statement for a component that is not standalone and suggests a quick-fix for the problem.
Unused imports
In standalone components, JetBrains Rider detects import statements for unused components, pipes, and directives and suggests removing them.

Unused import statements can be also removed automatically on reformatting a file (Ctrl+Alt+Shift+L).
Quick-fixes and context-aware actions
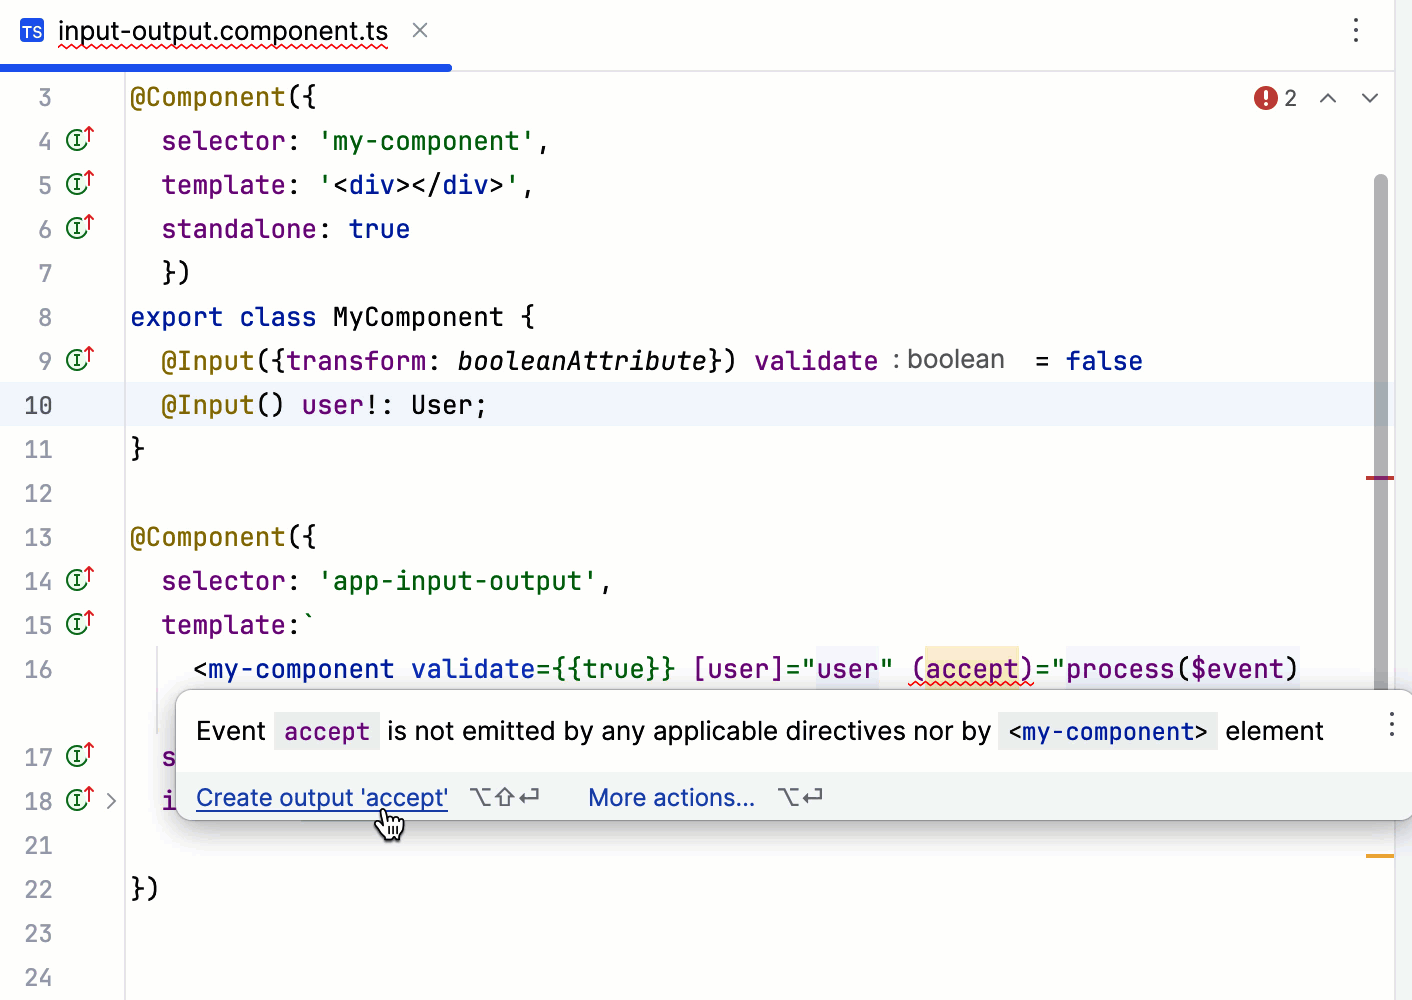
You may find it handy to use quick-fixes for creating @Input and @Output properties from Angular component templates, both with or without a transform property. Note that the required import statements are also generated automatically.
JetBrains Rider also provides context-aware Create Field and Create Method actions that help you generate properly declared fields.
View and configure Angular-specific inspections
In the Settings/Preferences dialog (Ctrl+Alt+S) , go to .
Expand the Angular node.
Configure inspection profiles and severity, disable and suppress predefined inspections, and create custom ones .
Navigate through an Angular application
Navigation bar
Also, you can download the Angular CLI QuickSwitch plugin and install it on your computer.
Navigate with the Related Symbol popup
To call a popup with a list of related files, perform one of the following actions:
Click
 in the navigation popup.
Press Ctrl+Alt+Home.
Select from the main menu.
Right-click any area in the editor and select .
Click
in the navigation popup.
In a TypeScript component file, the popup also lists all the symbols that were imported into this file.

To open a file, select it and press Enter. Alternatively, use the numbers associated with each file type:
The TypeScript file with the component class
Template
Tests
Styles
Navigate with usages
Place the caret at the declaration of a symbol and press Ctrl+B.
If the symbol is used only once, JetBrains Rider brings you to this usage and highlights it.
If several usages are found, JetBrains Rider shows them in a popup. Select the usage to navigate to and press Enter or just click it in the list.
Place the caret at the declaration of a symbol and press Ctrl+Alt+F7.
Use the icons on the toolbar to show or hide references to components in import statements (
 ), in string literals (
 ), and in HTML files (
 .
.Click the Show usages hint to jump to the usage or to select the relevant one from the list.
Use navigation popup
To enable the navigation popup, press Ctrl+Alt+S, go to and then select the Show navigation popup in editor checkbox in the Angular area. Use the search field to locate the checkbox easier.

To access the navigation popup, hover anywhere in the editor. The set of icons in the popup depends on the type of the file in the current editor tab and the files that a component contains.
To jump between files within a component, click the corresponding icons, for example, to jump to a .component.html file, click
 .
.Use the popup to navigate to styles and templates within a file.
Click
to open a popup with a list of related files.
Use Angular Material Design components
JetBrains Rider recognizes Angular Material components and attributes and provides coding assistance for them:
Completion for components

Completion for attributes

Navigation between a component or an attribute and its declaration (press Ctrl+B or select from the context menu).
Install Angular Material
Open the embedded Terminal (Alt+F12) and type
ng add @angular/material.Add
"@angular/material": "^16.2.11"underdependenciesin your package.json and runnpm install.In the main menu, go to , then select
@angular/materialfrom the list and follow the steps of the wizard that starts.
Learn more from Getting Started on the Angular Material official website.
Configure syntax highlighting
In an Angular project, JetBrains Rider recognizes and highlights various symbols, such as CSS classes and properties, HTML attributes and tags, as well as Angular input and output bindings. The occurrences of these symbols are highlighted in various contexts, such as HTML attributes or JavaScript string literals.

You can configure Angular-aware syntax highlighting according to your preferences and habits.
In the Settings/Preferences dialog (Ctrl+Alt+S) , go to .
Select the color scheme, accept the highlighting settings inherited from the defaults or customize them as described in Colors schemes: fonts and colors of IDE text.
Use several frameworks within a project
Sometimes you may need to use other frameworks within one Angular project.
To get context-aware coding assistance in each file, create a configuration file .ws-context and specify which framework should be used in each particular file or folder. The settings from this file will override the default configuration.
In the project root, select New | File from the context menu and specify
.ws-contextas the file name.In
.ws-context, use two types of properties:<context-name>with the context value stringA GLOB pattern with a context details object
Use the following context values:
framework:vue,angular,react,svelte,astroangular-template-syntax:V_2,V_17nextjs-project:nextjsastro-project:astrovue-store:vuex,piniavue-class-component-library:vue-class-component,vue -property-decorator,vue-facing-decoratorjsdoc-dialect:jsdoc-typescript,jsdoc-closure
Use path nesting for simplicity.
The last segment of a GLOB path is the file name pattern, it only supports the
*wildcard.If the last segment is a
**it matches all nested directories and files.Top level context properties should have the
/**pattern.
When several patterns match the same file name, the following rules are used for disambiguation:
Choose the pattern with maximum number of path segments, excluding
**segments.Choose the pattern that is a pure file name pattern, which means that it does not end in
**or/.Choose the pattern that was defined first.
Example
Suppose you have a project with a number of frameworks used in various folders.

To get context-aware assistance for each file in the project, add the following code to .ws-context: