File and project-wide analysis
RustRover analyzes your code in the file that is currently opened in the editor and highlights detected problems as you type. It uses built-in inspections and an external linter (if it is enabled).
It also automatically checks your entire project for errors using external linters.
Both inspections and external linters can also be triggered manually on a selected scope. For more information, see Run inspections manually and Run Cargo Check/Clippy manually.
Current file
The IDE continuously checks your code and searches for problems using both inspections and external linters. The widget in the top-right corner of the editor displays the number of problems of each severity detected in the current file:

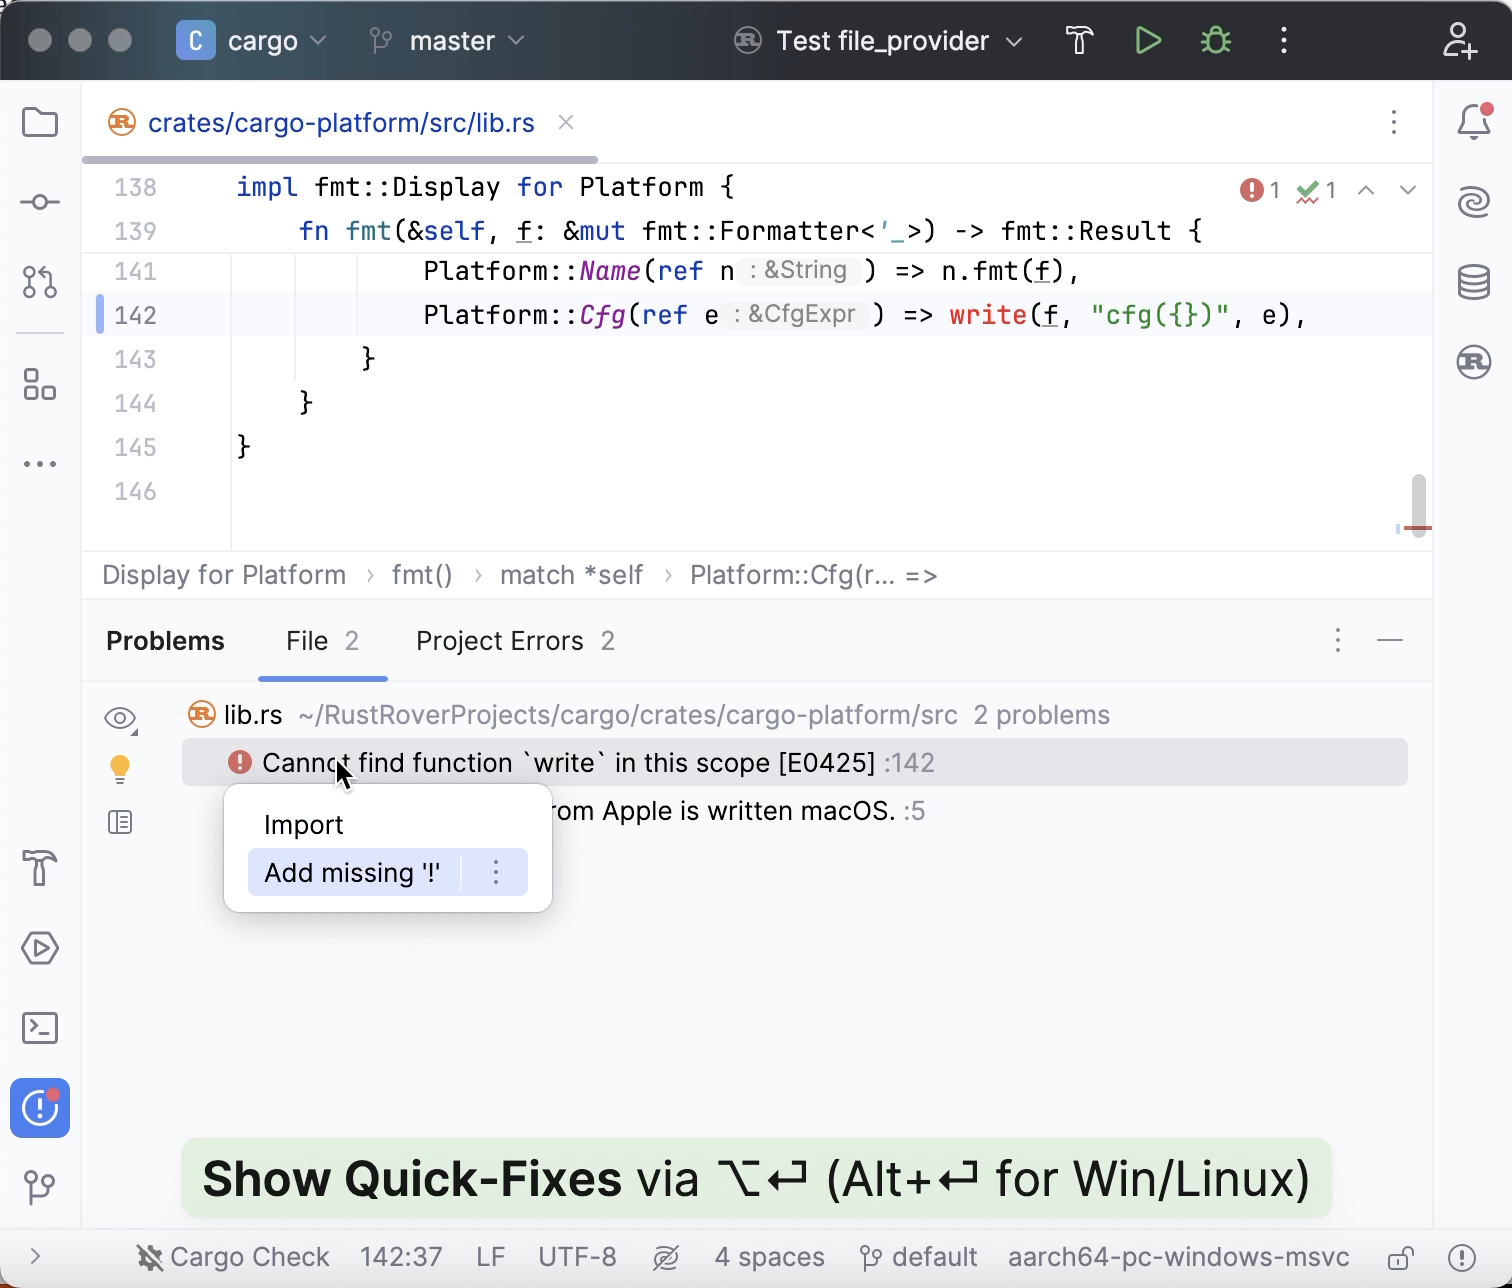
Click the widget to open the list of problems in the File tab of the Problems tool window. You can also access the Problems tool window by selecting or by pressing Alt+6.

For each problem, you can see the suggested quick-fix by pressing Alt+Enter or by clicking ![]() . To jump to the corresponding line in the editor, press F4 or double-click the problem in the tool window.
. To jump to the corresponding line in the editor, press F4 or double-click the problem in the tool window.
Click ![]() to be able to view and fix problems right in the tool window.
to be able to view and fix problems right in the tool window.

The color stripe in the scrollbar also marks the detected code problems and helps you quickly access the corresponding lines without scrolling the file. Hover over a mark on the stripe to see the detected problem in a tooltip. Click a mark to jump to the corresponding line.

Navigate to detected problems
You can jump from one highlighted problem to another within a file by clicking ![]()
![]() in the widget or by pressing F2 or Shift+F2 accordingly. By default, the IDE will navigate you to problems according to their severity: errors > warnings > weak warnings > server problems > typos.
in the widget or by pressing F2 or Shift+F2 accordingly. By default, the IDE will navigate you to problems according to their severity: errors > warnings > weak warnings > server problems > typos.
You can configure RustRover to take you through the problems one by one regardless of their severity. Hover over the widget in top-right corner of the editor, click ![]() , select 'Next Error' Action (F2) Goes Through, and enable All Problems.
, select 'Next Error' Action (F2) Goes Through, and enable All Problems.

Project errors
Apart from viewing all problems in a single file, you can take a look at all problems detected across your entire project by using the project-wide analysis.
Project-wide analysis relies on external linter checks running on the fly. It also includes build errors.
To view the results, open the Problems tool window Alt+6 and switch to the Project Errors tab.

To jump to the corresponding line in the editor, press F4 or double-click the problem in the tool window.
Click ![]() to be able to view and fix problems right in the tool window.
to be able to view and fix problems right in the tool window.
