Performance tuning tips
This article provides an overview of techniques to help improve RustRover performance when working with large-scale projects.
Increase memory heap
Enable memory indicator
To determine whether performance issues are caused by low heap memory, enable the memory indicator:
Navigate to and select Memory Indicator.
The memory indicator will appear in the bottom-right corner:
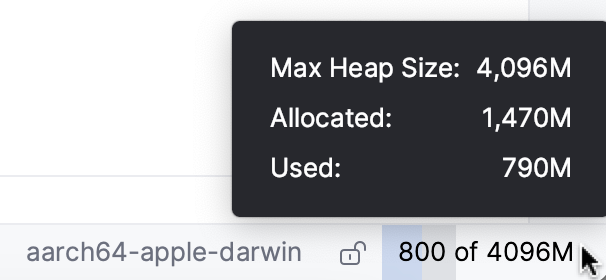
Increase memory heap
Select from the main menu.
In the dialog that opens, set a higher memory heap value in the Maximum Heap Size field.
Click Save and Restart.

If the amount of free heap memory drops below 5% of the maximum heap size, a warning will appear.

Click Configure and enter a new heap size value in the dialog that opens.
Speed up code analysis
On-the-fly code analysis is one of the most performance-consuming processes in RustRover. Here's what you can do to lighten it up.
Filter the list of inspections
By default, many RustRover inspections are set to run on the fly. To lighten up the process, you can reduce the list of these inspections: navigate to and browse through the list of inspections, clearing the checkboxes for those you prefer not to run on the fly.
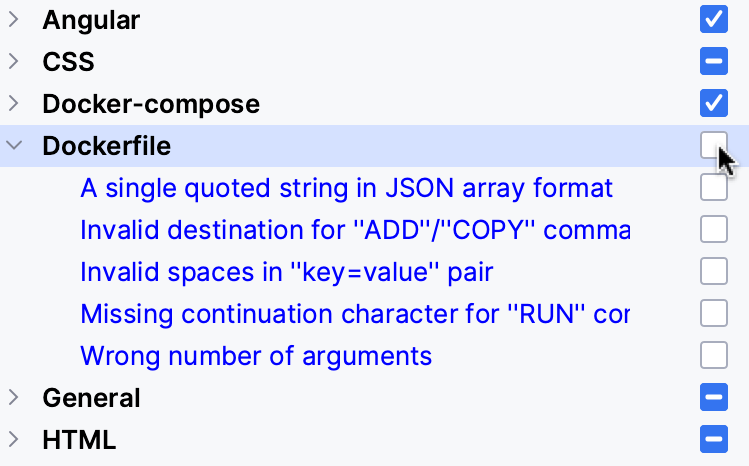
You will always be able to run inspections on demand using the command and explore the results in a separate tool window without affecting the editor. Also, you can postpone code analysis (and on-the-fly refactoring) until commit by setting up the Before Commit options.
Tune analysis for a file
You can configure the highlighting level for the currently opened file: none, syntax, or all problems.
Use the inspection widget in the upper-right corner of the editor:

Enable Power Save mode
You can enable Power Save Mode or battery efficiency mode using one of the following options:
As an alternative to disabling individual checks or files one by one, try using Power Save Mode. This mode disables all inspections and other resource-intensive processes across the entire IDE.
To enable Power Save Mode, go to .

Right-click the status bar and select Power Save Mode. The
 Power Save Mode icon will appear on the status bar.
Speed up project analysis
Exclude directories and file types
Your project may include folders with binaries, logs, or build artifacts that do not affect RustRover code insight. Analyzing such folders can also be resource-intensive due to their size or location. In these cases, it is reasonable to exclude the folders manually: right-click the directory in the project tree and select .
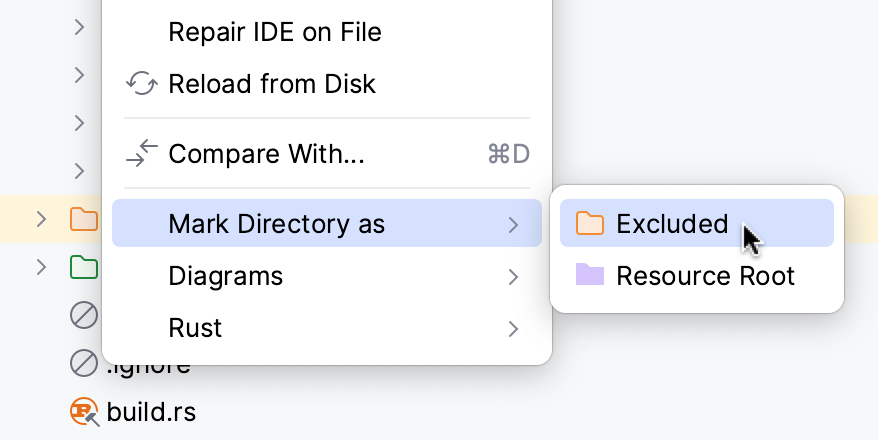
Once files are excluded, their symbols are no longer available to RustRover. The following features will be disabled for excluded files: code completion, auto-import, code generation, Find in Files (except in open files), navigation, and refactoring.
You can also exclude files such as logs or generated data by file type.
Go to and switch to the Ignored Files and Folders tab.
Add a new extension (
) to the list of ignored file types:
Apply the changes and close the dialog.
Disable unnecessary plugins
To increase the IDE performance, try disabling the plugins you don't need. You will always be able to turn them on again later.
Go to .
Browse the Installed tab and disable the unnecessary plugins:
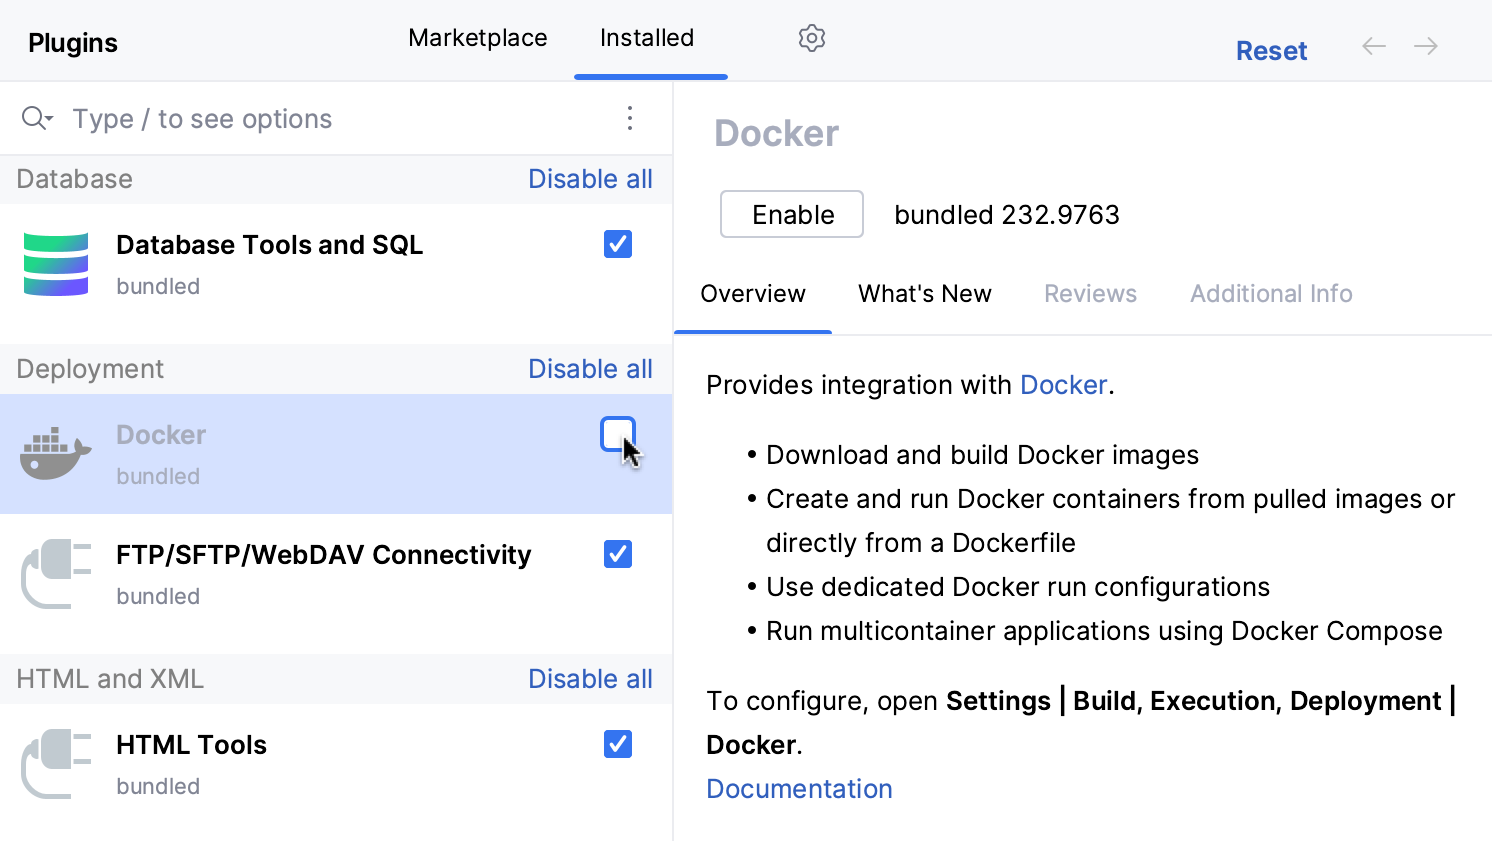
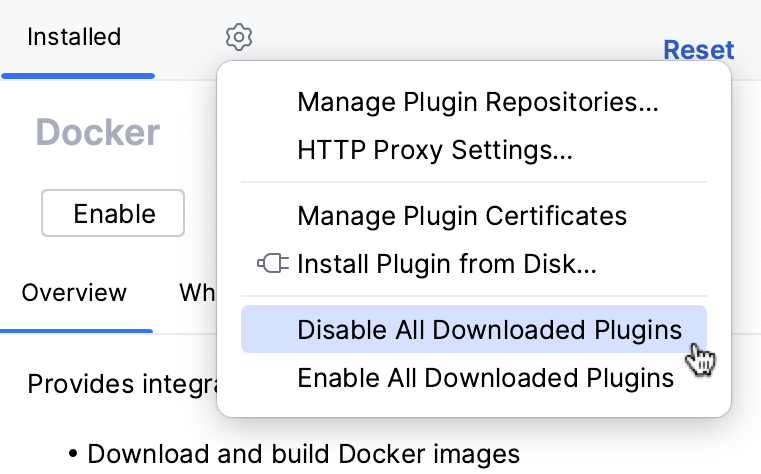
You can also disable all manually installed plugins at once (the non-bundled ones) from the menu under
:
Report performance problems
If the tips above didn’t help, please report your performance problem to our issue tracker. To investigate it, we’ll need you to provide the RustRover logs and a CPU usage snapshot.
Collect RustRover logs
You can find the RustRover logs under in the main menu.
Collect a CPU usage snapshot
In the main menu, go to .
Reproduce the problem you’ve experienced.
Go back to the main menu and select .
Collect the captured snapshot and share it with us along with your zipped log folder.
If the snapshot is too large to attach to the issue, please upload it to the JetBrains Upload Service or use another file upload service.