Memory, Disassembly, Hex views
Memory view
To view raw memory of the running process, select a variable in the Variables pane and press Ctrl+Enter or call Show in Memory View from the context menu.
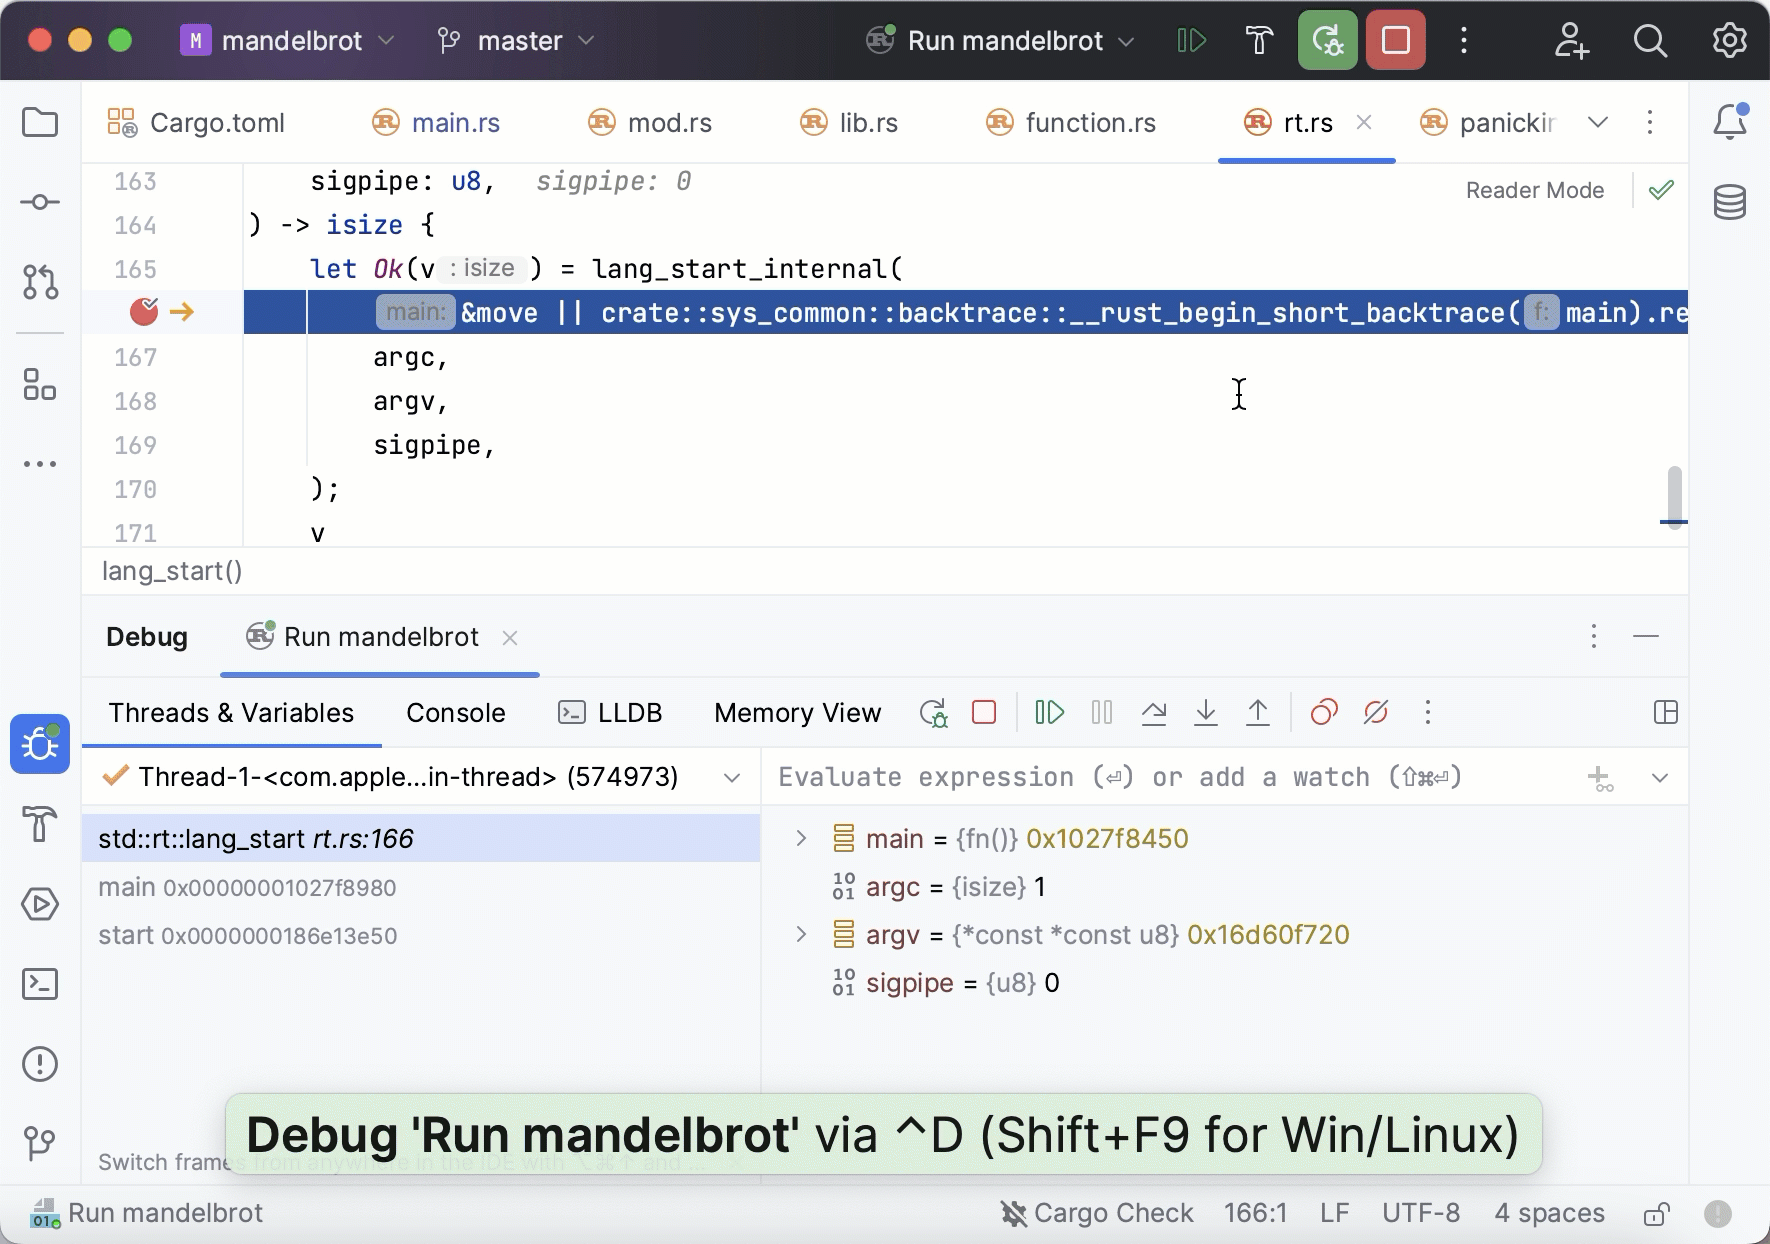
The Memory View window initially shows a 256-byte region that starts from the chosen address, with higher memory addresses at the bottom of the window. When you then invoke Memory View for other pointers, they are highlighted in the same window, and the region is extended to show more addresses if necessary.
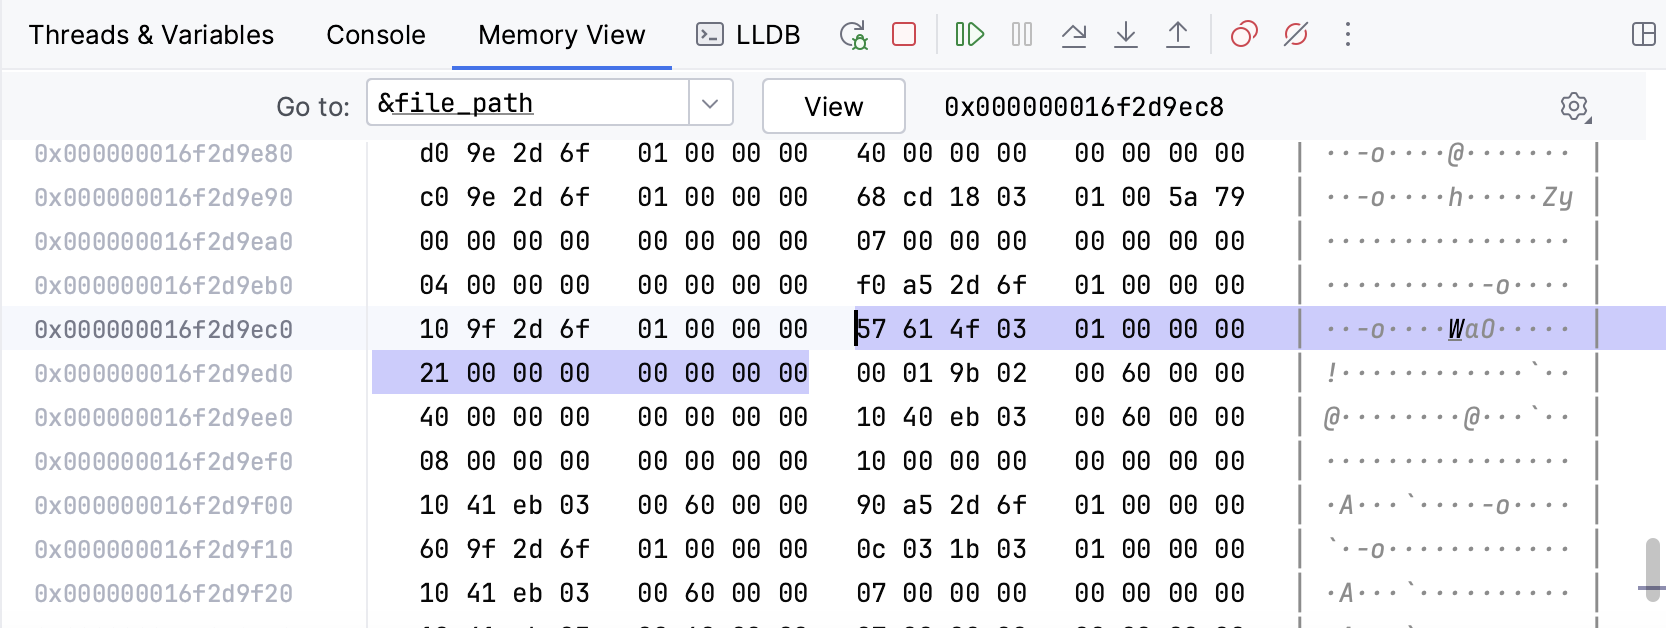
When you step through the code, RustRover highlights the changes that happen in the displayed memory region.
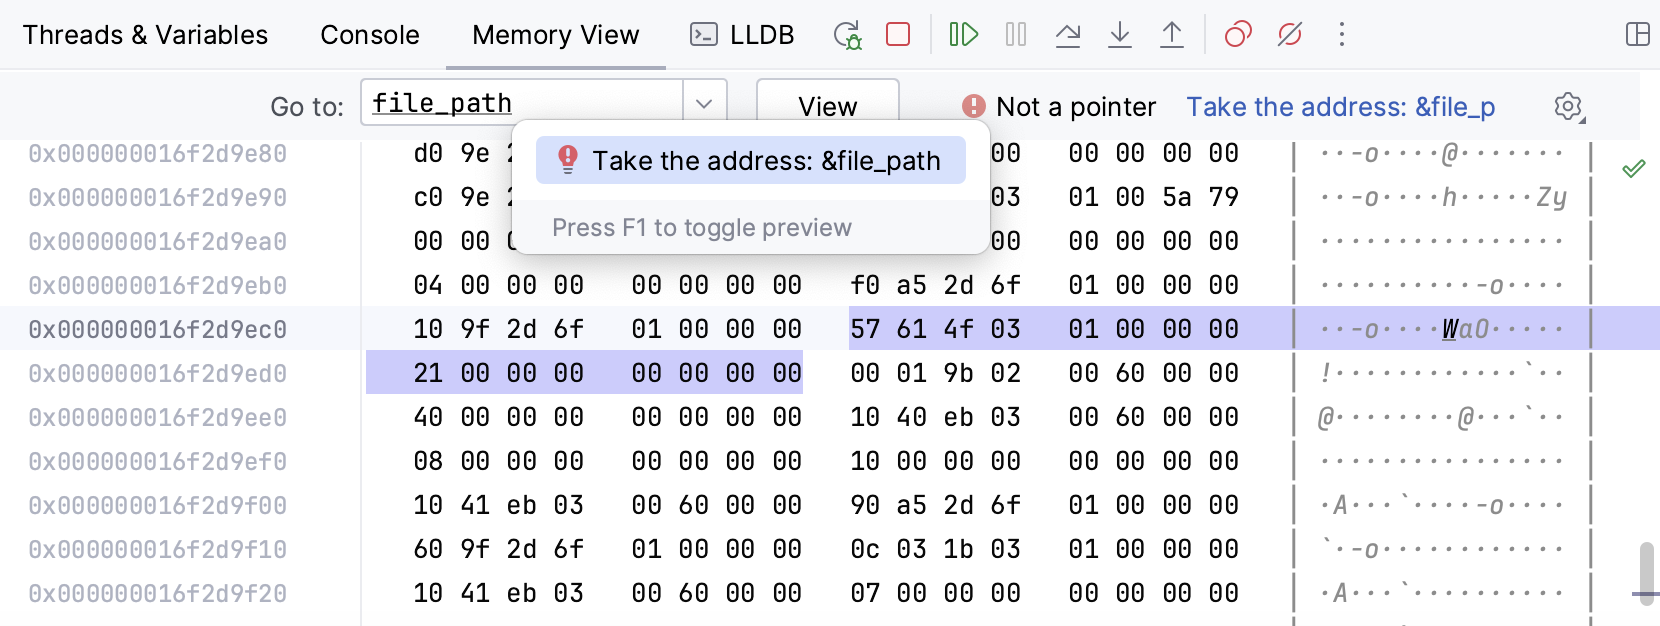
Use the Go to field of the Memory View window to jump to a particular address. You can enter the address directly as a hex number, specify a pointer variable or an expression evaluating to a pointer, or use the address of operator & to get the address of any variable. Use the Take the address link to quickly wrap variables into the addresses:
Disassembly view
During a debug session you can open the disassembled code
Open disassembly view for a frame
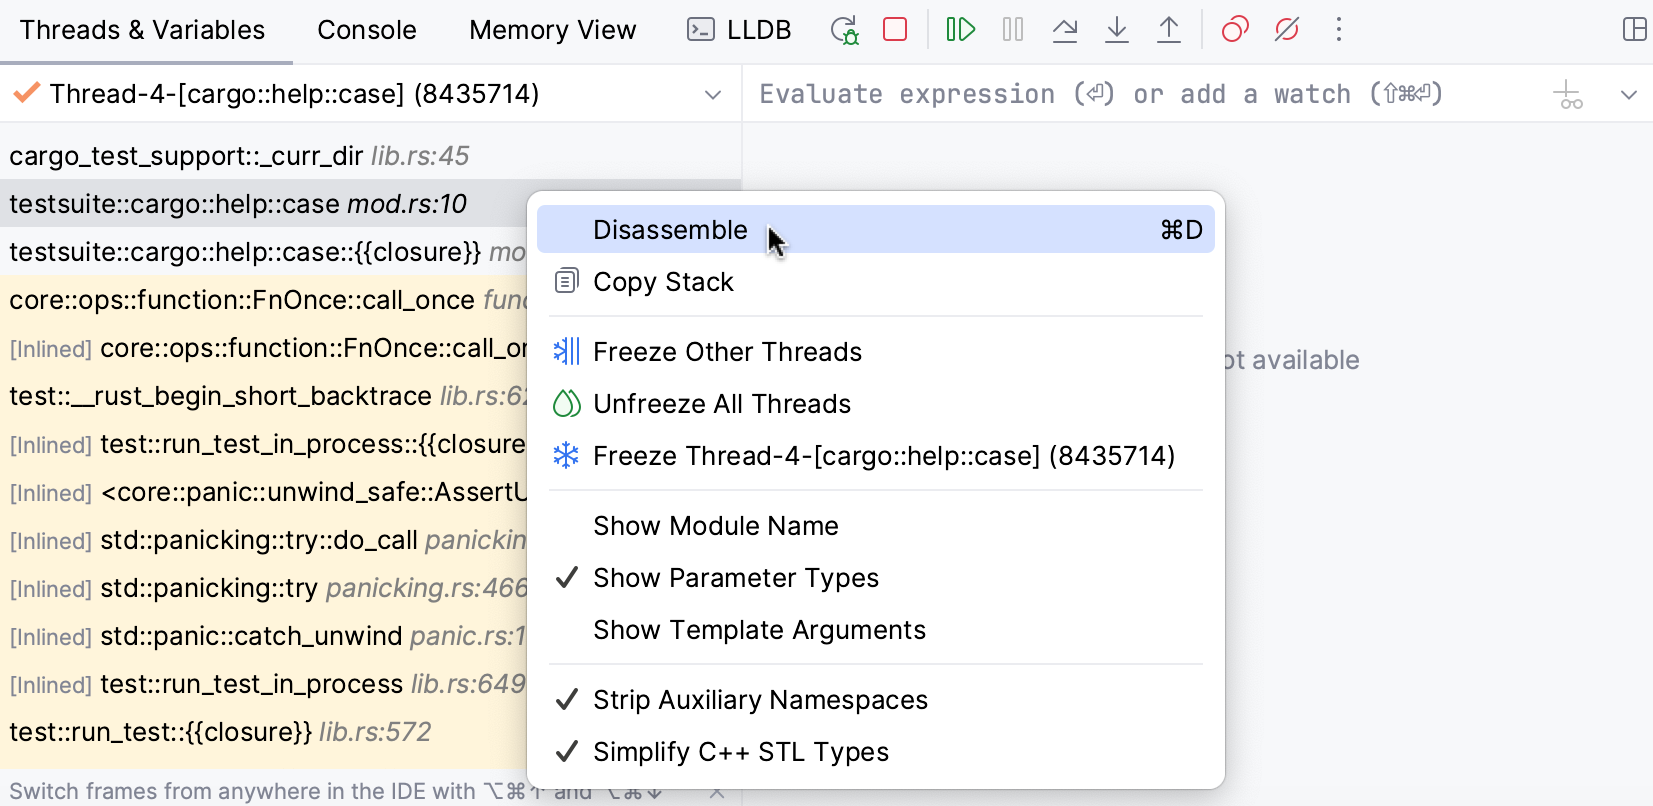
Right-click the desired frame in the Debug tool window and select Disassemble:
Disassembly view will be opened side-by-side with the source code:
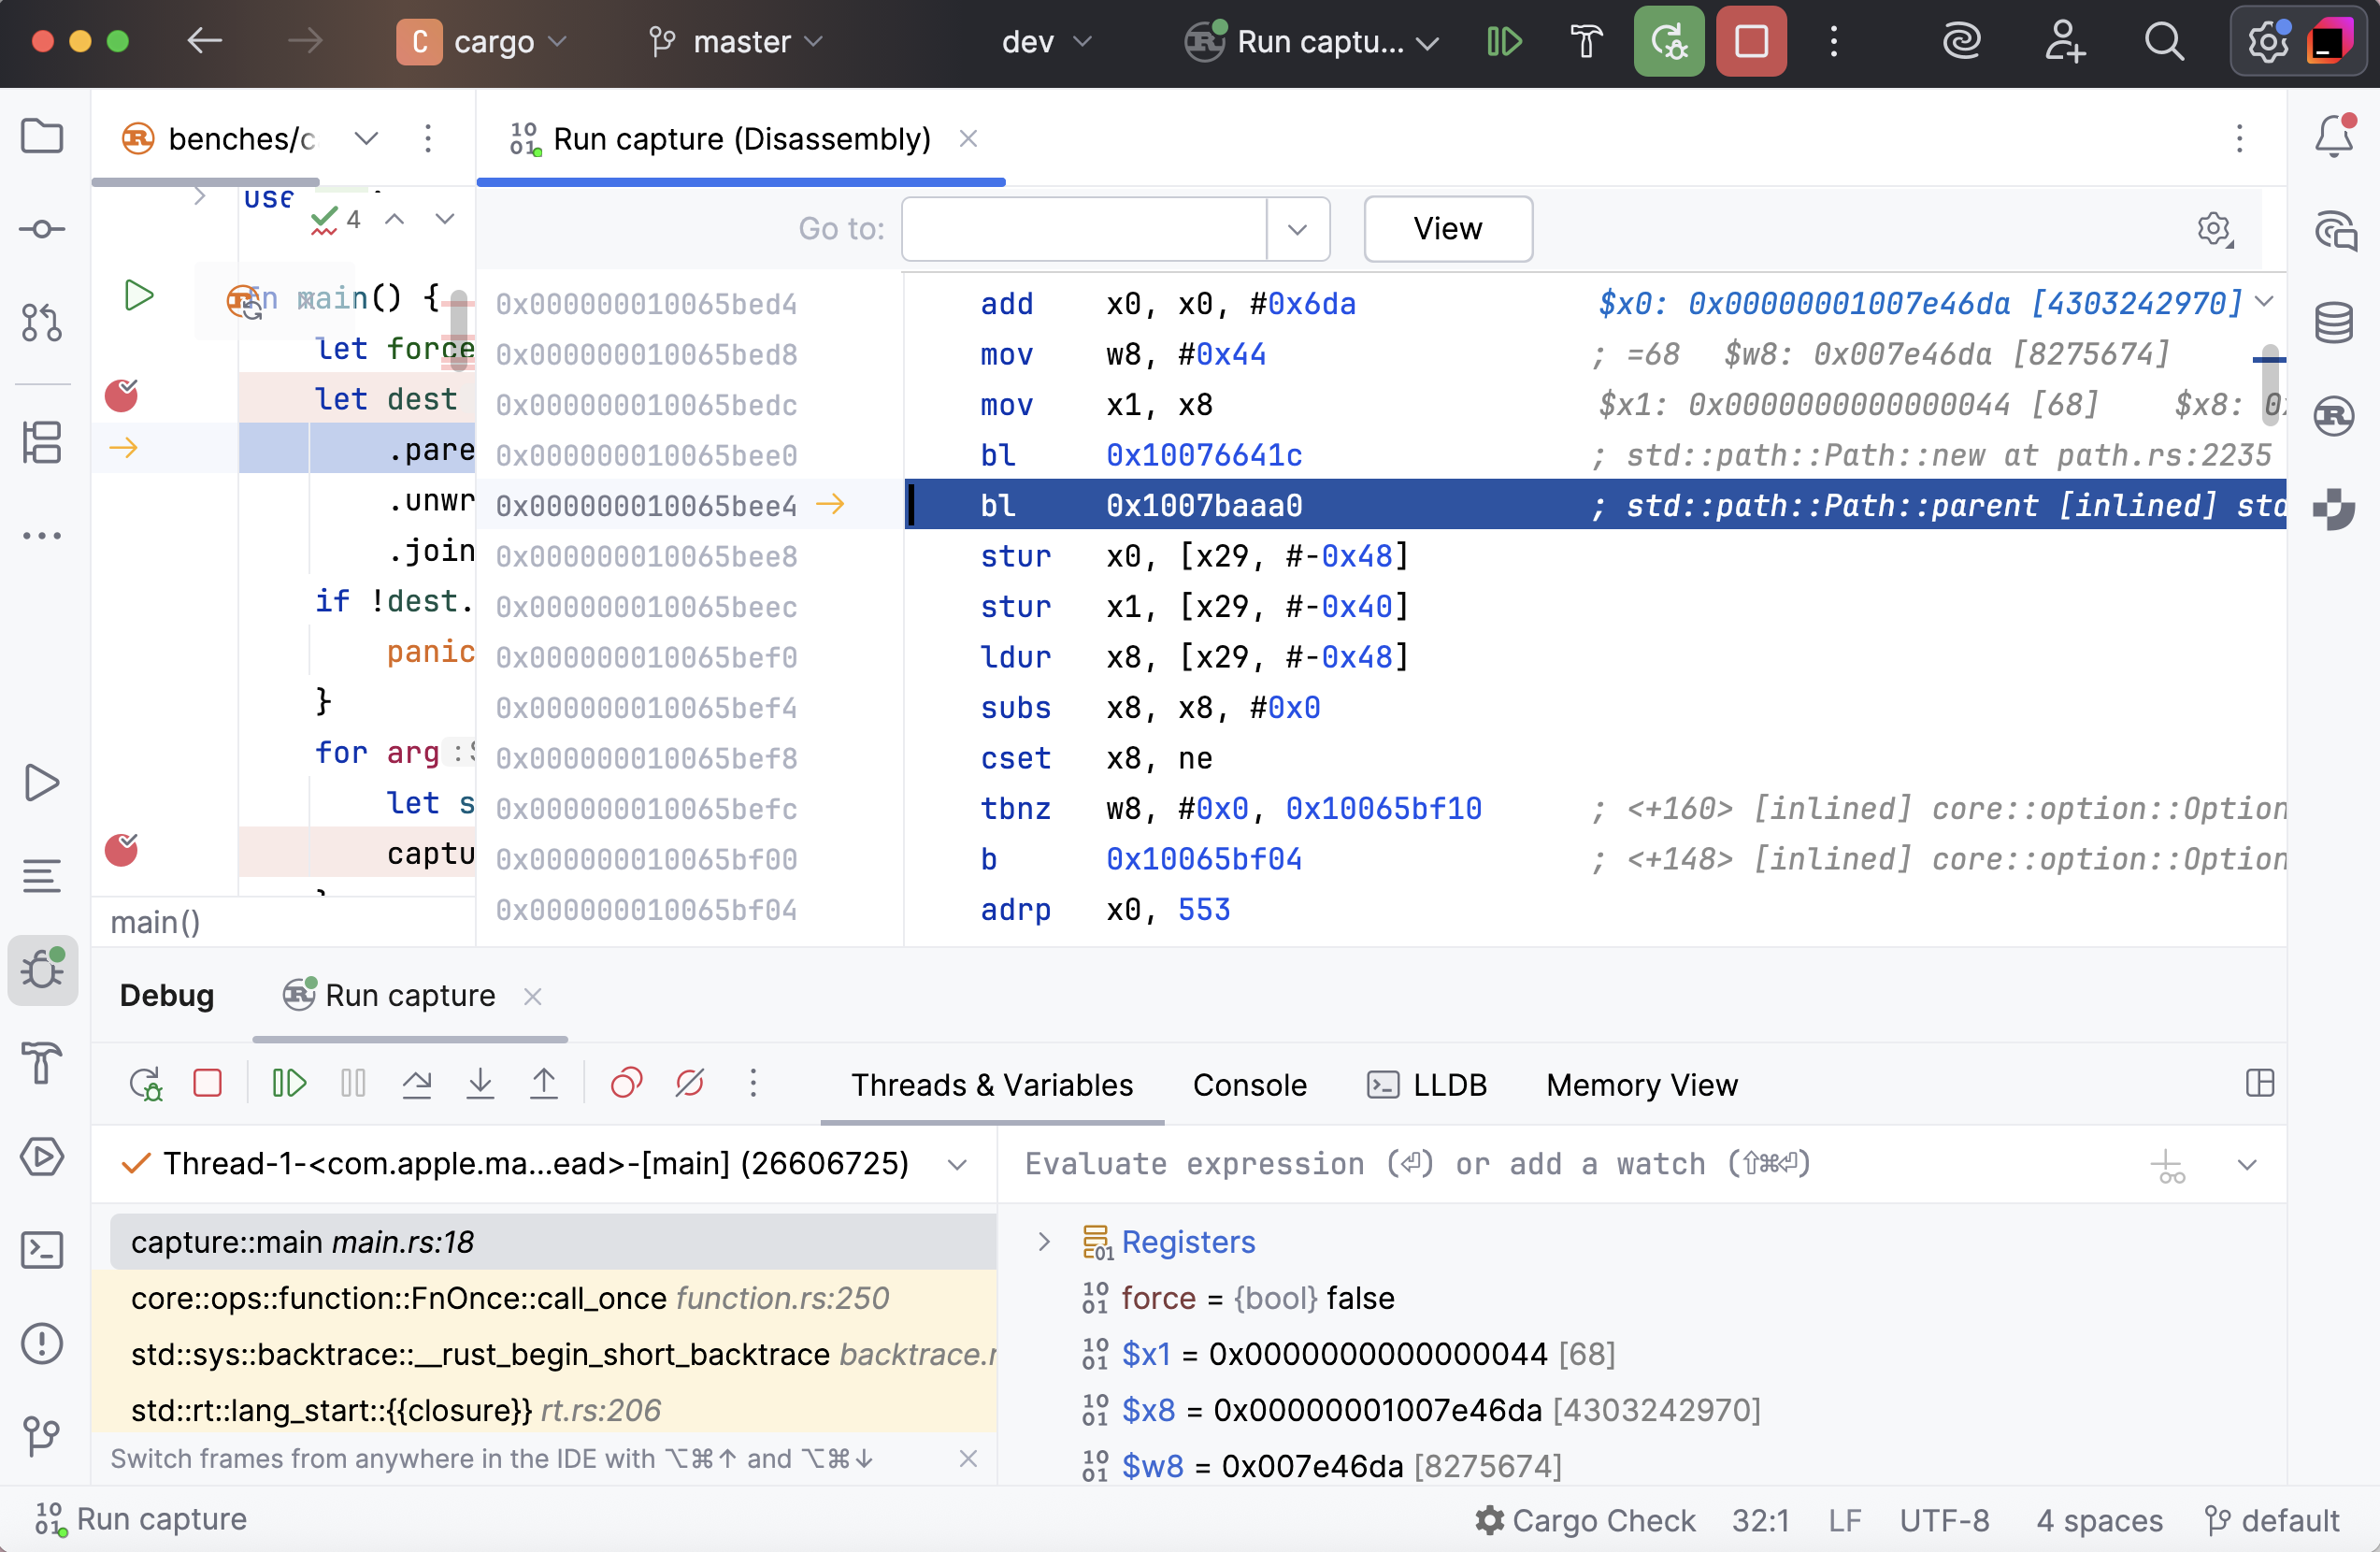
Once opened, the disassembly view stays synchronized with the currently selected frame. When frames are switched, both the editor and the disassembly view scroll to the execution point.
Open disassembly view when sources are unavailable
When debugging your code, use the Force Step Into
Alt+Shift+F7 command instead of Step Into F7. Step Into acts like Step Over for functions with no source code.
Disassembly view opens automatically when RustRover cannot locate the source files during debugging.
Navigate to the desired frame in the Debug tool window.
Disassembly also opens automatically when you launch a debug session for the attached process that does not provide debug information.
While in disassembly view, you can investigate your code using regular stepping actions and breakpoints.
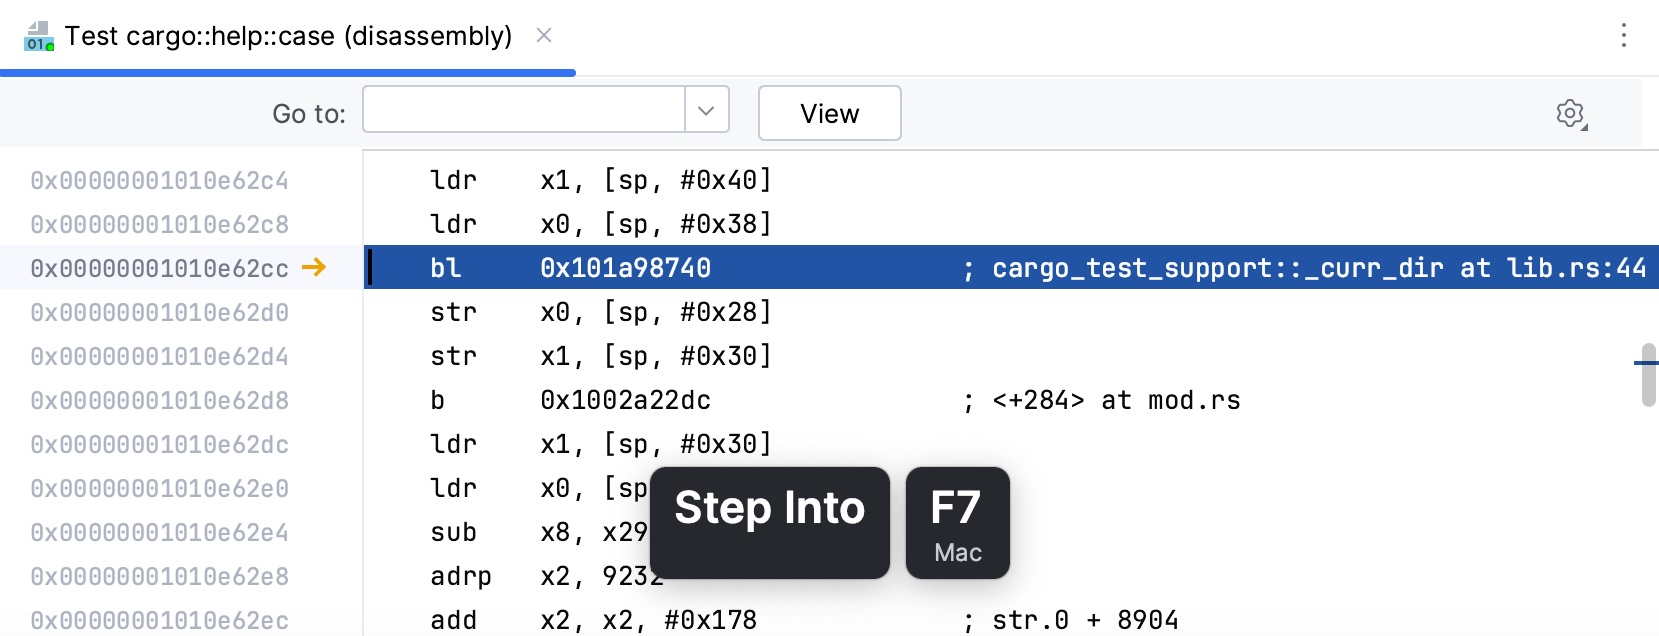
Use the Go to field to jump to a desired code line. In this field, you can enter an address or any expression that can be evaluated into an address. If you need to include a register into the expression, start its name with $ (the GDB notation). Using registers in the Go to field while debugging with LLDB requires explicit cast to address. For example, (void *)($pc + 0x8).
Hexadecimal view
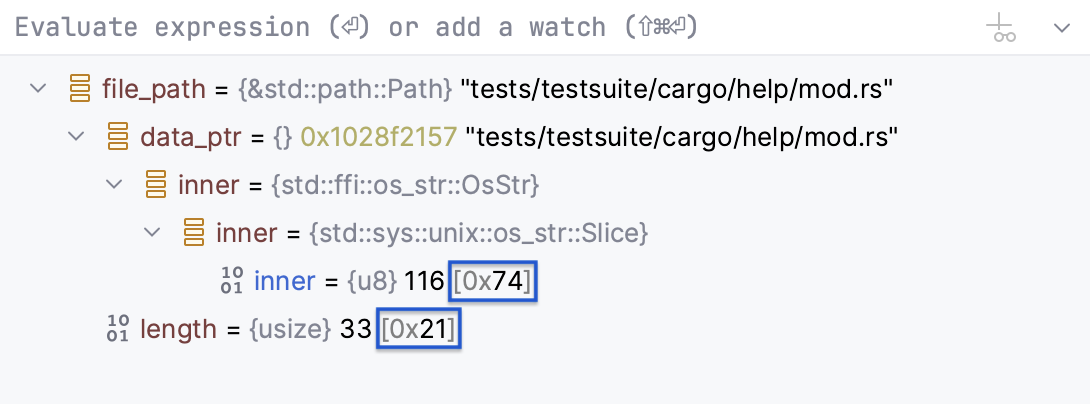
You can examine hexadecimal representation alongside the original formatting for numerical variables of integer types. By default, hexadecimal view is disabled.
Enable/disable hexadecimal view
In the Debug tool window, click the
button and select/deselect .
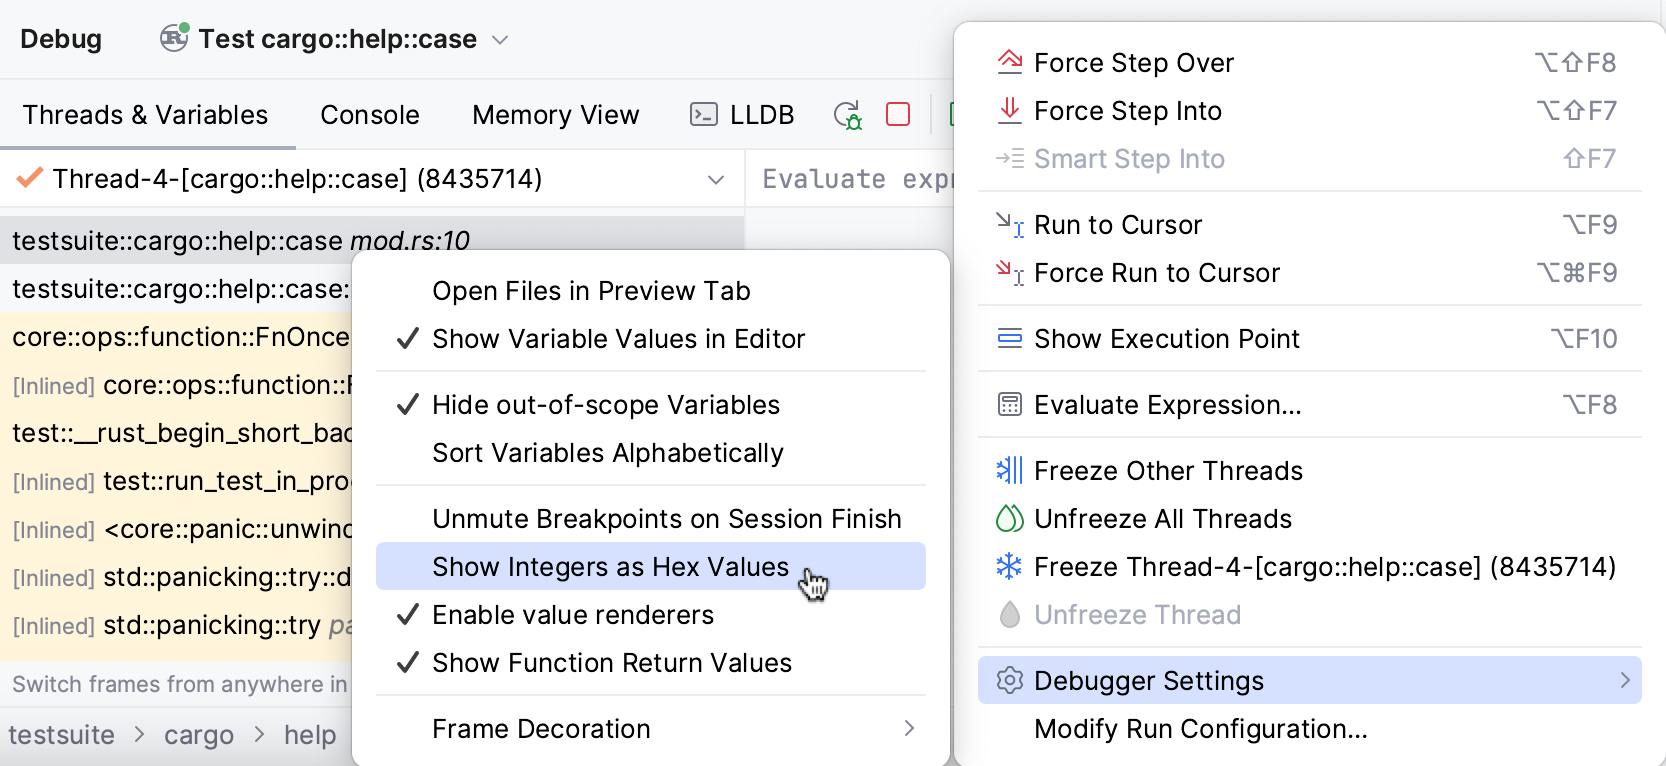
Once enabled, in the Variables pane, you will see hexadecimal values displayed next to the original values:
