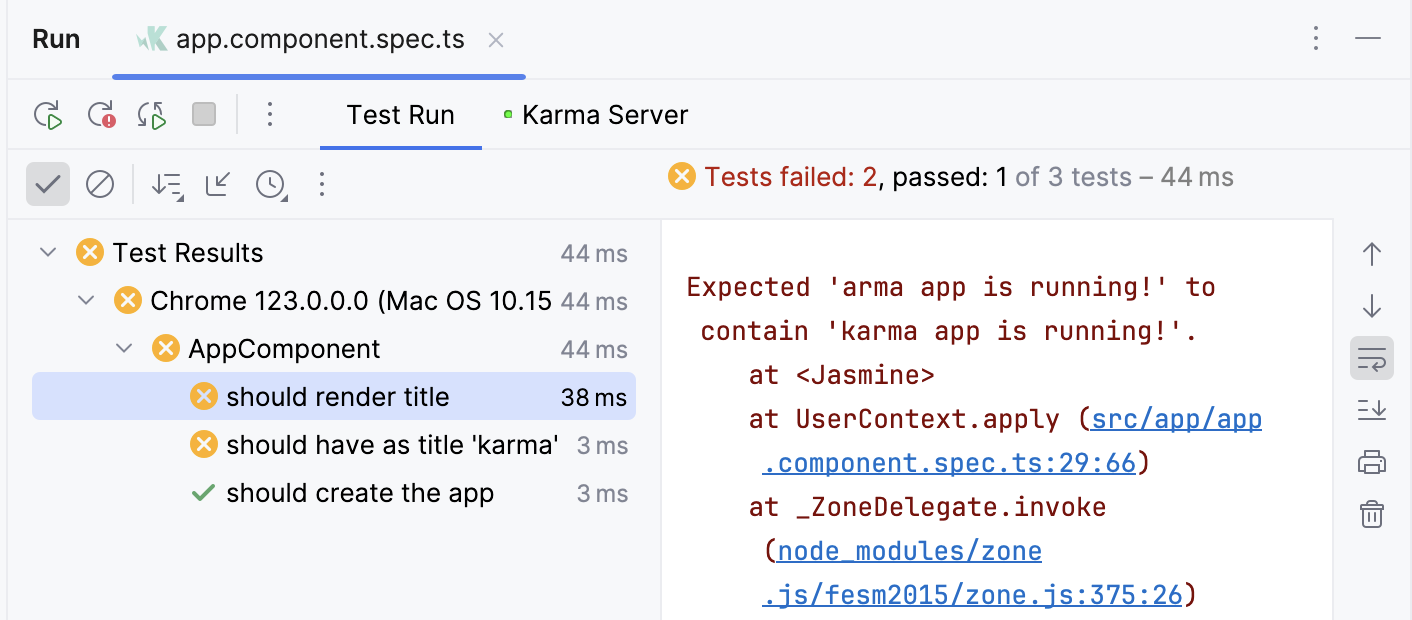
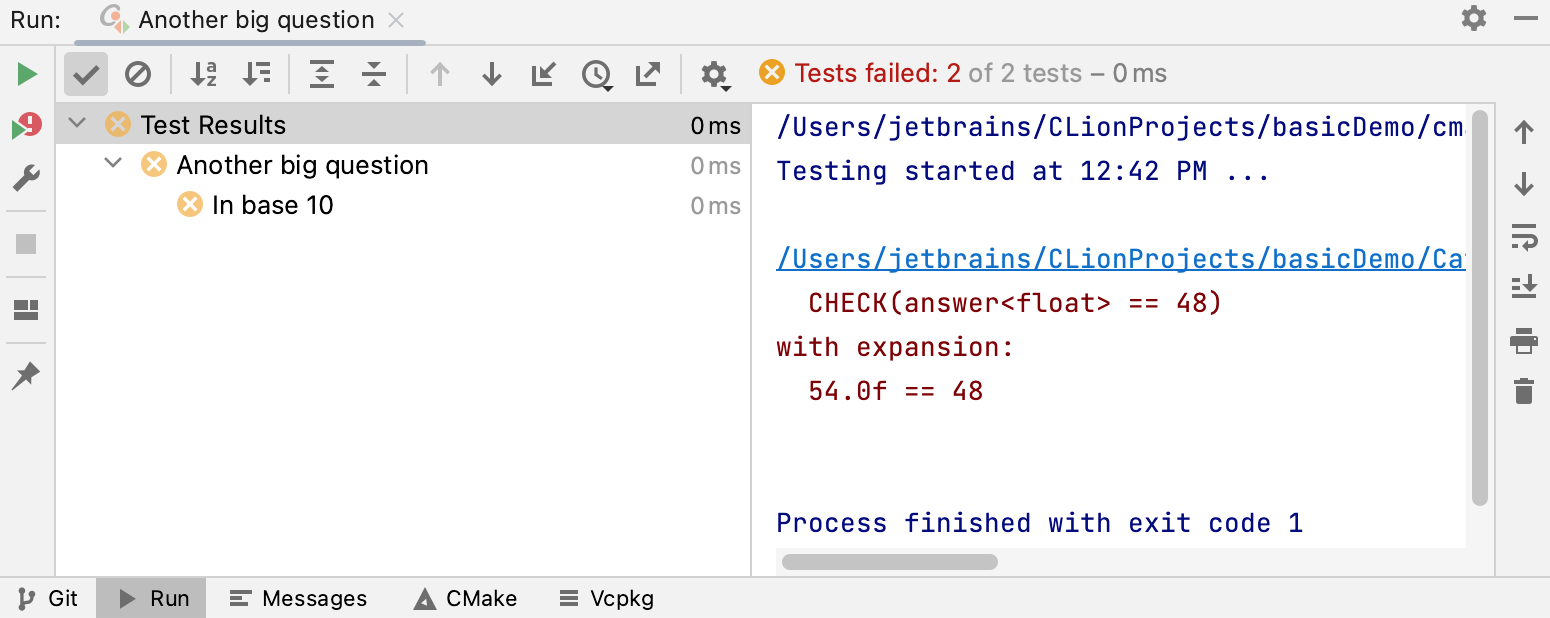
Test Runner tab
The Test Runner tab opens in the Run tool window when a testing session begins, and features the same toolbar buttons.


The run toolbar is almost the same as that for the Run tool window, but features testing-specific buttons.
The left-hand pane shows the tree view of all tests within the current run/debug configuration.
The root node represents the test selected to run.
The nested nodes represent the hierarchy of test suites and test cases.
The leaf nodes represent the individual tests.
The status of each test is indicated by an icon. Double-click a node to open the respective test class or test method in the editor.
The testing toolbar provides controls that enable you to monitor the tests and analyze results. Some of the commands are duplicated on the context menus of the test tree nodes.
The output pane shows the output of the current test suit.
The inline statistics show the list of executed tests with the execution time of each test.
Run toolbar
Item | Tooltip and Shortcut | Description |
|---|---|---|
Rerun Ctrl+F5 | Rerun the current test session. The process reruns always in the same console regardless of whether this console is pinned or not. | |
Rerun Failed Tests | Rerun all failed tests. | |
Toggle auto-test | Enable the autotest-like runner. As a result, any test in the current run configuration tab restarts automatically on changing the related source code, without clicking the Rerun button The button is not shown for Mocha and Jest tests. To activate the auto-rerun functionality for these test runners, add the | |
Stop and rerun Ctrl+F5 | Click this button to stop executing the current test session and have the test re-started automatically. When the test execution stops, the button toggles to Rerun | |
Stop Ctrl+F2 | Terminate the current process externally by means of the standard mechanisms. | |
Restore Layout | Click this button to have the changes to the current layout abandoned and return to the default state. | |
Pin | When this button is pressed, the current tab will not be overwritten; instead, the results of the next command will be displayed in a new tab. |
Testing toolbar
Item | Tooltip and Shortcut | Description |
|---|---|---|
Show Passed | Show tests that passed successfully. | |
Show Ignored | Show the ignored tests in the tree view of all tests within the current run/debug configuration or test class. | |
Sort Alphabetically | Sort tests in alphabetical order. | |
Sort By Duration | Sort tests by duration. | |
| Expand All/Collapse All Ctrl+NumPad + Ctrl+NumPad - | Expand/collapse all nodes in the test tree view. These buttons are only available if the tested application contains more than test case. |
| Previous/Next Failed Test Ctrl+Alt+Up/Ctrl+Alt+Down | Navigate between the failed tests. |
Test History | Open the list of internally saved results of test sessions. Each item is supplied with the name of the run configuration and a time stamp. To view the results of a testing session from the WebStorm history, select the item with the suitable run configuration and time stamp. The loaded test results are shown in a new tab, and the name of the corresponding run configuration is displayed in the title bar. To re-run the tests from the loaded session, click | |
Import Tests from File | Load previously exported test results. This button opens a dialog in which you can select the required XML file with test results. | |
Click this cog button to access the context menu with the following options:
| ||
Test status icons
Icon | Description |
|---|---|
Test error. This status is assigned to tests that caused an exception from the tested source code. | |
Test failed. If at least one test receives this status, then all its parents are marked as failed. | |
Test ignored. | |
Test in progress. | |
Test passed successfully. | |
Test terminated. This status is assigned to tests that were cancelled by clicking the Stop button |
Output pane toolbar
This pane shows output of each test, generated at runtime, including all the messages sent to the output stream, and the error messages. The following table shows the toolbar buttons and context menu commands available for the Output pane.
Item | Tooltip and Shortcut | Description |
|---|---|---|
Up the stack trace Ctrl+Alt+Down | Navigate up in the stack trace and have the caret jump to the corresponding location in the source code. | |
Down the stack trace Ctrl+Alt+Up | Navigate down in the stack trace and have the caret jump to the corresponding location in the source code. | |
Use Soft Wraps | Toggle the soft wrap mode of the output. | |
Scroll to the end | Navigate to the bottom of the stack trace and have the caret jump to the corresponding location in the source code. | |
Configure printing out the console output in the Print dialog that opens. | ||
Clear All | Delete all messages for the selected test. |
Context menu commands
Command | Keyboard shortcut | Description |
|---|---|---|
Run <test name> | Ctrl+Shift+F10 | Run the selected test with the automatically generated run/debug configuration or choose another one from the list. |
Debug <test name> | Debug the selected test with the automatically generated run/debug configuration or choose another one from the list. | |
Run <test name> with Coverage | Ctrl+Shift+F10 | Run the selected test and collect coverage with the automatically generated run/debug configuration or choose another one from the list. |
Jump to Source | F4 | Choose this command to move the focus to the editor, to the definition of a test class, or a test method. |
Show Source | Ctrl+Enter | Choose this command to open source code in the editor, but leave the focus with the Test Runner tab. |