React Native
With React Native you can develop native mobile applications for iOS and Android using JavaScript and React. It is created by Facebook and used for such well-known apps as Instagram, Airbnb, and now JetBrains’ own YouTrack mobile application. Learn more from the React Native official website.
WebStorm helps you create, edit, lint, run, and maintain your React Native applications. WebStorm also provides code completion for React and Flow symbols.
Before you start
Make sure you have Node.js on your computer.
Make sure the JavaScript and TypeScript plugin is enabled in the settings. Press Ctrl+Alt+S to open settings and then select . Click the Installed tab. In the search field, type JavaScript and TypeScript. For more information about plugins, refer to Managing plugins.
Creating a new React Native application
The recommended way to create a React Native application in WebStorm is to use a dedicated project generator, for example, the React Native CLI.

Click New Project on the Welcome screen or select from the main menu. The New Project dialog opens.
In the left-hand pane, choose React Native.
In the right-hand pane:
Specify the path to the folder where the project-related files will be stored.
In the Node runtime field, specify the Node.js runtime to use. Select a configured runtime from the list or choose Add to configure a new one.
From the React Native list, select npx --package react-native-cli react-native.
Alternatively, for npm version 5.1 and earlier, install the
react-native-clipackage yourself by runningnpm install -g react-native-cliin the Terminal Alt+F12. When creating an application, select the folder where thereact-native-clipackage is stored.
When you click Create, WebStorm generates a React Native-specific project with all the required configuration files, downloads the dependencies, and creates a run configuration of the type React Native with default settings..
Install other tools to get started with React Native, for example, an iOS simulator. The list of these tools depends on your operating system and the mobile platform you are going to target your application at. See React Native Getting Started guide for detailed installation instructions.
Create a React Native application that uses Expo
With WebStorm, you can also develop full-stack React Native applications with the Expo framework.
Open your command-line shell or the embedded Terminal (Alt+F12) .
Switch to the parent folder where you want to create your application. To do that, type:
cd <parent_folder>To start generating an application, type:
npx create-expo-app@latest <application name>Answer the questions of the wizard. For example, accept the suggestion to install the
create-expo -apppackage or select the version of the Expo SDK to use.
Starting with an existing React Native application
To continue developing an existing React Native application, open it in WebStorm and download the required dependencies.
Open the application sources that are already on your machine
Click Open on the Welcome screen or select from the main menu. In the dialog that opens, select the folder where your sources are stored.
Check out the application sources from your version control
Click Clone Repository on the Welcome screen.
Alternatively, select or or from the main menu.
Instead of Git in the main menu, you may see any other Version Control System that is associated with your project. For example, Mercurial or Perforce.
In the dialog that opens, select your version control system from the list and specify the repository to check out the application sources from. For more information, refer to Check out a project (clone).
Download the dependencies
Click Run 'npm install' or Run 'yarn install' in the popup:

You can use npm, Yarn 1, or Yarn 2, refer to npm and Yarn for details.
Alternatively, select Run 'npm install' or Run 'yarn install' from the context menu of package.json in the editor or in the Project tool window (Alt+1) .
Exclude the android and iOS folders from the project
In the Project tool window (Alt+1) , select the android or the iOS folder.
From the context menu of the selection, choose Mark Directory As, and then choose Excluded.

Install other tools to get started with React Native, for example, an iOS simulator. The list of these tools depends on your operating system and the mobile platform you are going to target your application at. See React Native Getting Started guide for detailed installation instructions.
Project security
When you open a project that was created outside WebStorm and was imported into it, WebStorm displays a dialog where you can decide how to handle this project with unfamiliar source code.

Select one of the following options:
Preview in Safe Mode: in this case, WebStorm opens the project in a preview mode. It means that you can browse the project's sources but you cannot run tasks and script or run your project.
WebStorm displays a notification on top of the editor area, and you can click the Trust project… link and load your project at any time.
Trust Project: in this case, WebStorm opens and loads a project. That means the project is initialized, project's plugins are resolved, dependencies are added, and all WebStorm features are available.
Don't Open: in this case, WebStorm doesn't open the project.
Learn more from Project security.
Coding assistance
WebStorm provides code completion for React APIs and JSX in JavaScript code. Code completion works for React methods, React-specific attributes, HTML tags and component names, React events, component properties, and so on. See React: Completing Code for more information.
Code completion for React Native StyleSheet properties is also available:

If you are using Flow in your project, WebStorm can highlight the errors from this type checker in the editor. For more information, refer to Configuring Flow in WebStorm and Using Flow in WebStorm.
Running a React Native application
You can run your application on a physical device or on a simulator. Before you launch your application, make sure that the simulator is already running or, if you are using a physical device, it is already connected to your computer.
WebStorm makes running React Native applications flexible. For example, if you are starting your application for the first time, you can choose to run the React Native bundler, build the application, and open it on the simulator - all that as part of a running session. You can also skip launching the bundler if it is already running or refuse building the application if you have not made any changes to its native code since the previous run.
Create a React Native run configuration

Select Edit Configurations from the Run/Debug Configurations widget on the toolbar, click the Add New Configuration button (
 ) and select React Native from the list to open the configuration settings.
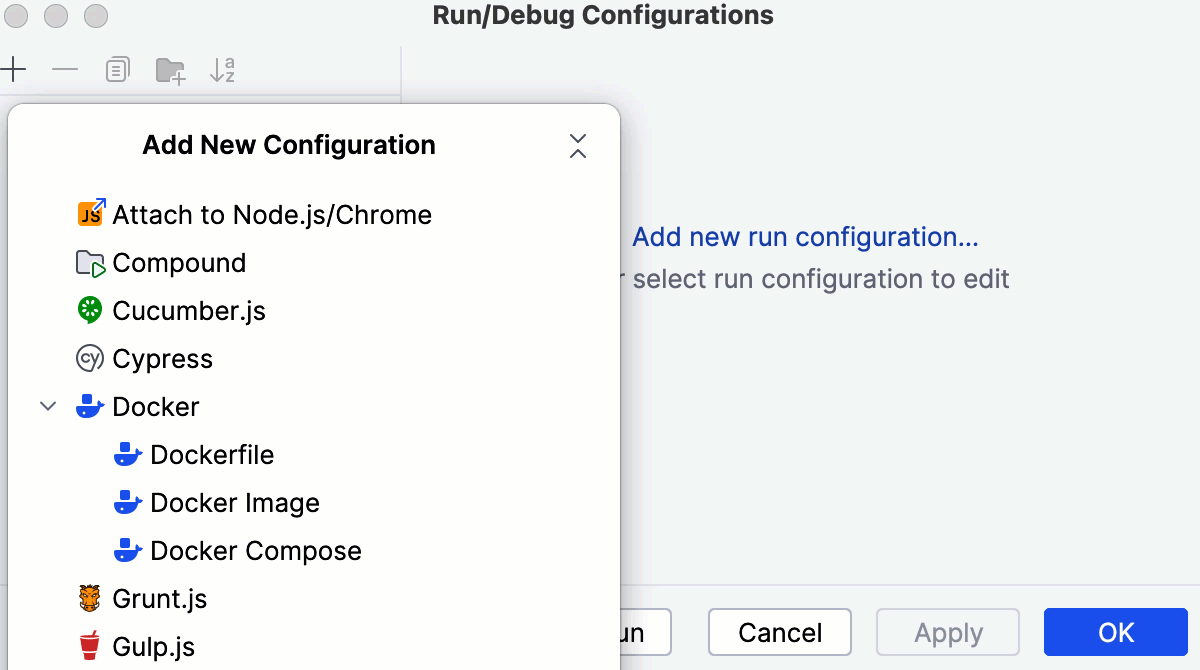
Choose whether you want WebStorm to build and launch the application for you:
Select the Build and launch checkbox if you are launching your application for the first time or if you have updated its native code since the last run.
Clear this checkbox if you haven't made any changes to the native code of your application since the last build.
If you selected the Build and launch checkbox, choose the target platform, Android or iOS.
Depending on your choice, WebStorm will run the bundler with
react-native run-iosor withreact-native run-android.To emulate the Android platform, use an Android virtual device.
To emulate the iOS platform, you need to install the ios-sim command-line tool globally. You can do it through the Node Package Manager (npm), refer to npm, pnpm, and Yarn, or by running the
sudo npm install ios-sim -gcommand, depending on your operating system.
Learn more from the React Native official website.
Optionally, in the Arguments field, type the arguments to be passed to React Native, for example, specify the simulator type through the
‑‑simulatorflag:‑‑simulator="iPhone 4s".Specify the browser to use.
In the Bundler host field, specify the host where the React Native bundler runs, the default value is localhost.
In the Bundler port field, specify the port on which the React Native bundler runs, by default
8081is chosen, learn more from the React Native official website.Specify the Node.js runtime to use.
If you choose the Project alias, WebStorm will automatically use the project default interpreter from the Node runtime field on the JavaScript Runtime page . In most cases, WebStorm detects the project default runtime and fills in the field itself.
You can also choose another configured local or remote interpreter or click
 and configure a new one.
For more information, refer to Configuring remote Node.js runtimes, Configuring a local Node.js runtime, and Using Node.js on Windows Subsystem for Linux.
Specify the path to react-native-cli and the working directory of the application. Optionally, type the environment variables for
react-native run-androidorreact-native run-ios.By default, WebStorm starts the React Native bundler automatically when you invoke the run configuration.
If you have already started the bundler from outside WebStorm, for example, from the command line, you can re-use it without stopping and restarting. In such cases, select your bundler in the Before Launch area and click
 .
.
For more information about the settings that are common for all run configurations, see Run/debug configurations.
Prepare a device or a simulator
If you are using an Android device, you need to prepare it every time you start working with an application.
An iOS simulator has to be installed only once, after that WebStorm starts it automatically with react-native run-ios.
To prepare an Android device, launch an Android virtual device or connect to a physical Android device via USB.
Learn more from the React Native official website.
To prepare an iOS simulator, open your command-line shell or the embedded Terminal (Alt+F12) and type:
npm install --global ios-sim
Run an application
From the Run/Debug Configurations widget list on the toolbar, select the newly created React Native configuration and click ![]() next to it. WebStorm opens the Run tool window and first starts the React Native bundler in a new React Native tab.
next to it. WebStorm opens the Run tool window and first starts the React Native bundler in a new React Native tab.
After that, the react-native run-ios or react-native run-android command is executed, depending on the selected target platform. If the build is successful, the simulator shows your application:
