Monitor IDE performance
In case of performance issues, you can use Activity Monitor to track the percentage of CPU consumed by various subsystems and plugins.
In the main menu, go to .
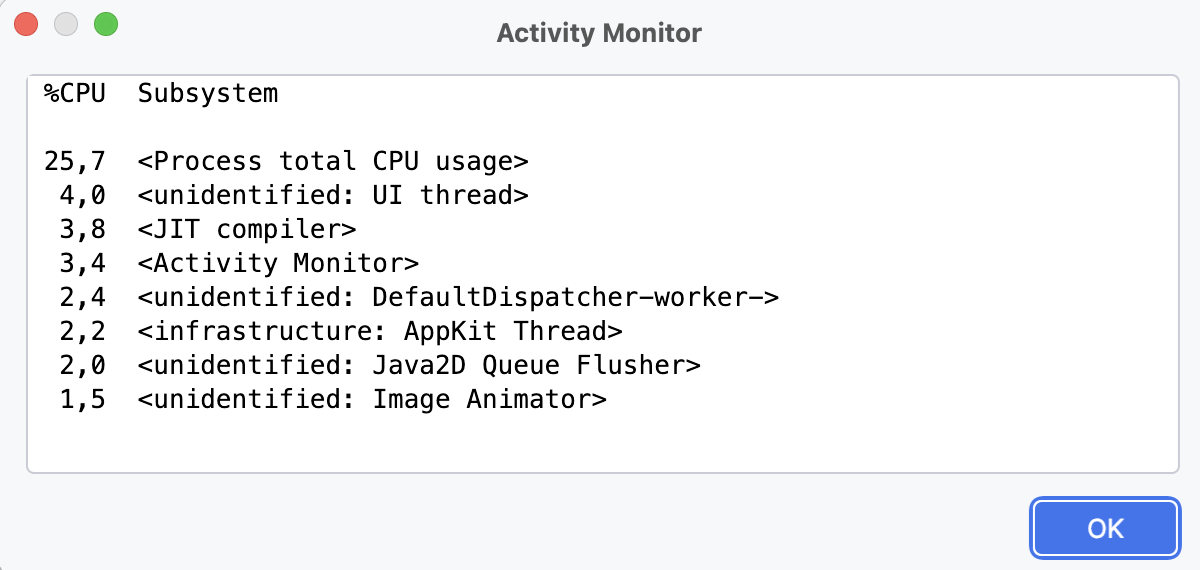
The Activity Monitor window lists all subsystems and plugins that are consuming CPU at the moment and arranges them by how much %CPU they are using:

If you notice increased CPU consumption, and no project analysis or background processes are running at this moment, we recommend that you contact our technical support for assistance. Background processes are always displayed in the status bar at the bottom of the IDE window.
14 January 2026