Dart
With WebStorm, you can develop, run, and debug Dart web and command-line applications. WebStorm helps you provide code completion, error and syntax highlighting, code inspections and quick-fixes, search and navigation, refactoring, and much more. WebStorm also integrates with the pub tool and the Dart Analysis Server.
Before you start
Install and enable the Dart plugin on the Settings | Plugins page, tab Marketplace, as described in Installing plugins from JetBrains Marketplace.
Downloading the Dart tools
Download and install the Dart SDK.
The Dart SDK contains all the tools for developing both command-line and web Dart applications. It incorporates the Dart Virtual Machine, the Dart core Libraries, as well as all the command-line tools, including compilers (dart2js and dartdevc), the dartfmt code formatter, and the pub tool.
Learn more about the Dart development tools from the Dart official website.
Creating a new Dart application
If you have no application yet, you can generate a WebStorm project with Dart-specific structure by running the dart create command.
Alternatively, create an empty WebStorm project and configure Dart support in it as described in Starting with an existing Dart application below.
Create a new Dart project
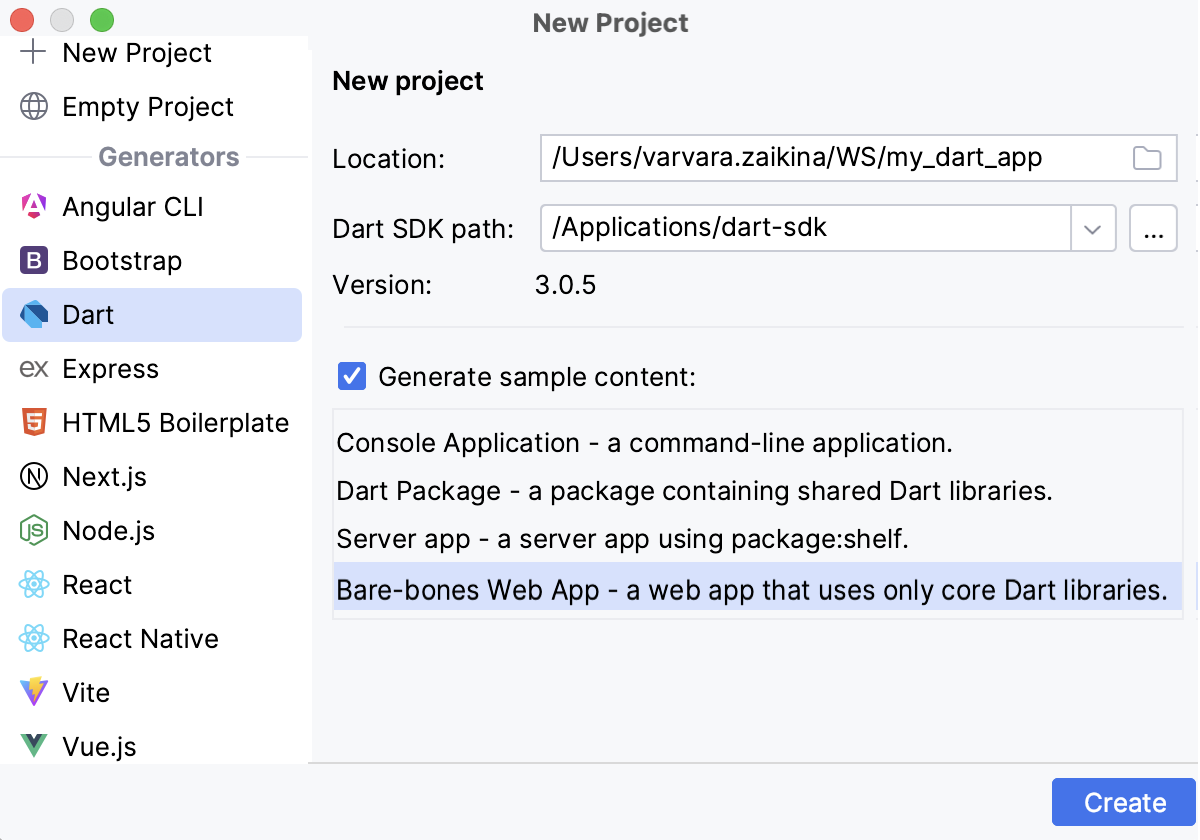
Click New Project on the Welcome screen or select from the main menu. The New Project dialog opens.
In the left-hand pane, choose Dart.
In the right-hand pane, specify The path to the folder where the project-related files will be stored.
Specify the location of the downloaded Dart SDK.
If you followed the standard installation procedure, as described on the Dart official website, WebStorm detects the path to the Dart SDK automatically.
Alternatively, type the path manually or click
and select the path in the dialog that opens.
If WebStorm recognizes the Dart SDK correctly, its revision number is displayed in the Version read-only field.
To have a sample application created in the project, select the Generate sample content checkbox and choose the relevant template from the list below. If you clear the checkbox, WebStorm creates an empty project.

Click Create. WebStorm sets up the project structure and generates some sources based on the selected template.
Create an empty WebStorm project
Click New Project on the Welcome screen or select from the main menu. The New Project dialog opens.
In the left-hand pane, choose Empty Project. In the right-hand pane, specify the application folder and click Create.
Starting with an existing Dart application
If you are going to continue developing an existing Dart application, open it in WebStorm, configure Dart in it, and download the required dependencies as described in Managing Dart dependencies below.
Open the application sources that are already on your machine
Click Open on the Welcome screen or select from the main menu. In the dialog that opens, select the folder where your sources are stored.
Check out the application sources from your version control
Click Clone Repository on the Welcome screen.
Alternatively, select or or from the main menu.
Instead of Git in the main menu, you may see any other Version Control System that is associated with your project. For example, Mercurial or Perforce.
In the dialog that opens, select your version control system from the list and specify the repository to check out the application sources from. For more information, refer to Check out a project (clone).
Configure Dart support in an existing project
In Settings dialog Ctrl+Alt+S, choose Dart under Languages and Frameworks. The Dart page opens.
Select the Enable Dart support for the project <project name> checkbox.
In the Dart SDK Path field, specify the location of the downloaded Dart SDK.
If you followed the standard installation procedure, as described on the Dart official website, WebStorm detects the path to the Dart SDK automatically.
Alternatively, type the path manually or click
and select the path in the dialog that opens.
If WebStorm recognizes the Dart SDK correctly, its revision number is displayed in the Version read-only field.
Working with several Dart projects (packages) in one WebStorm project
To attach a Dart project (package) to an existing WebStorm project you need to add its root folder as a content root.
Add a Dart project (package) to an existing WebStorm project
In the Settings dialog (Ctrl+Alt+S) , go to .
In the right-hand pane with a list of existing content roots, click Add Content Root. Then in the dialog that opens, choose the root folder of the Dart project (package) to be attached.
Managing Dart dependencies
WebStorm integrates with the pub tool and lets you run its actions right from the editor. As soon as you open a pubspec.yaml file, WebStorm displays a pane at the top of its editor tab. Use the links on this pane to invoke pub get, pub upgrade, and pub outdated actions.

Alternatively open pubspec.yaml in the editor or select it in the Project tool window and invoke pub actions from the context menu of the selection.
You can also use the tool in the command-line mode from the Terminal.
The pub tool saves the downloaded packages in the cache and creates a .packages file and a pubspec.lock file next to the pubspec.yaml file.
WebStorm logs execution of pub commands in the Messages tool window where you can also re-run the last executed command by clicking on the toolbar.
Building a Dart application
Open the pubspec.yaml file in the editor or switch to the tab where it is opened.
On the pane at the top of the tab, click Webdev build.... This invokes the webdev build action.

In the dialog that opens, specify the input folder to take the sources from and the output folder where you want the compiled application stored.
Running and debugging Dart command-line applications
With WebStorm, you can run and debug Dart command-line applications. WebStorm supports two debugging modes:
Local debugging: in this mode, your application is started from WebStorm and is running locally on your computer. To run or debug it, use a Dart Command Line App configuration.
Debugging a remote application: in this mode, your application is running in a remote environment, for example, in a Docker container. To debug it, use a Dart Remote Debug configuration.
Run a Dart command-line application
Open the Dart file to start the application from or select it in the Project tool window. This file must contain a
main()method.From the context menu of the selection, choose Run '<dart_file_name>'. WebStorm generates a run/debug configuration of the type Dart Command Line App and launches your application with it.
Debug a Dart command-line application locally
Configure and set breakpoints in the Dart code.
Open the Dart file to start the application from or select it in the Project tool window. This file must contain a
main()method.From the context menu of the selection, choose Debug '<dart_file_name>'. WebStorm generates a run/debug configuration of the type Dart Command Line App and starts a debugging session with it.
In the Debug tool window that opens, step through the program, stop and resume program execution, examine it when suspended, and so on.
Create a Dart Remote Debug run/debug configuration
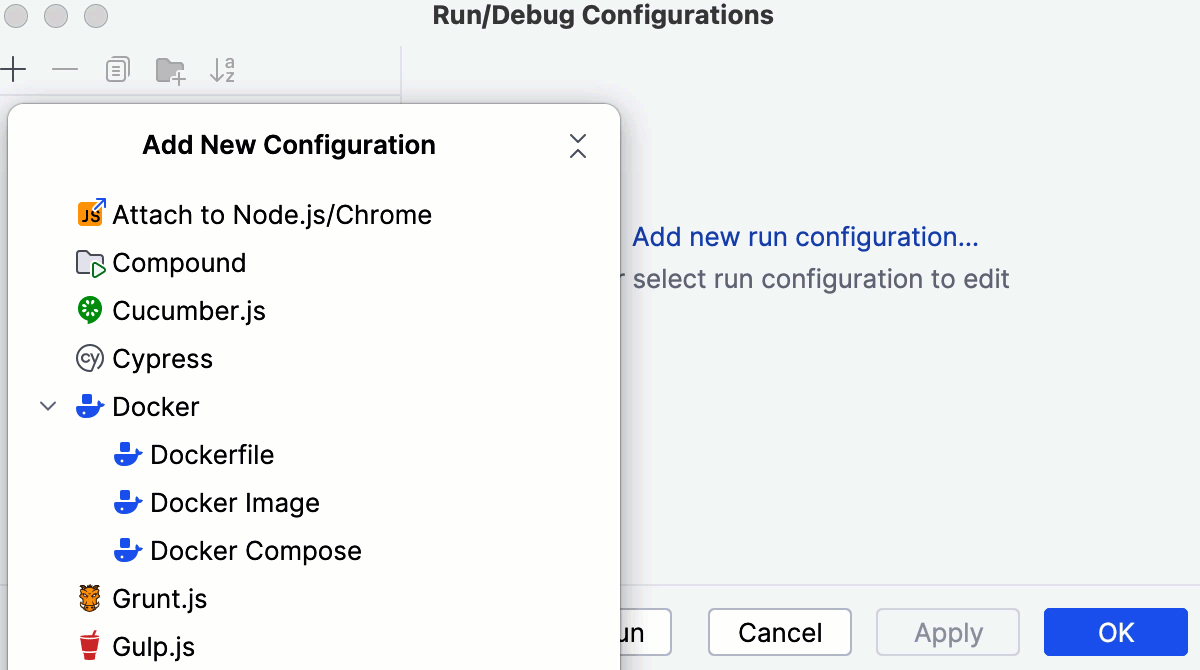
Select Edit Configurations from the Run/Debug Configurations widget on the toolbar, click the Add New Configuration button (
) and select Dart Remote Debug from the list to open the configuration settings.

In the Search Sources in field, specify the Dart project to debug if your WebStorm project contains several Dart projects configured as content roots. Select the Dart project from the list or click
and select the required folder in the dialog that opens.
Launch a remote debugging session
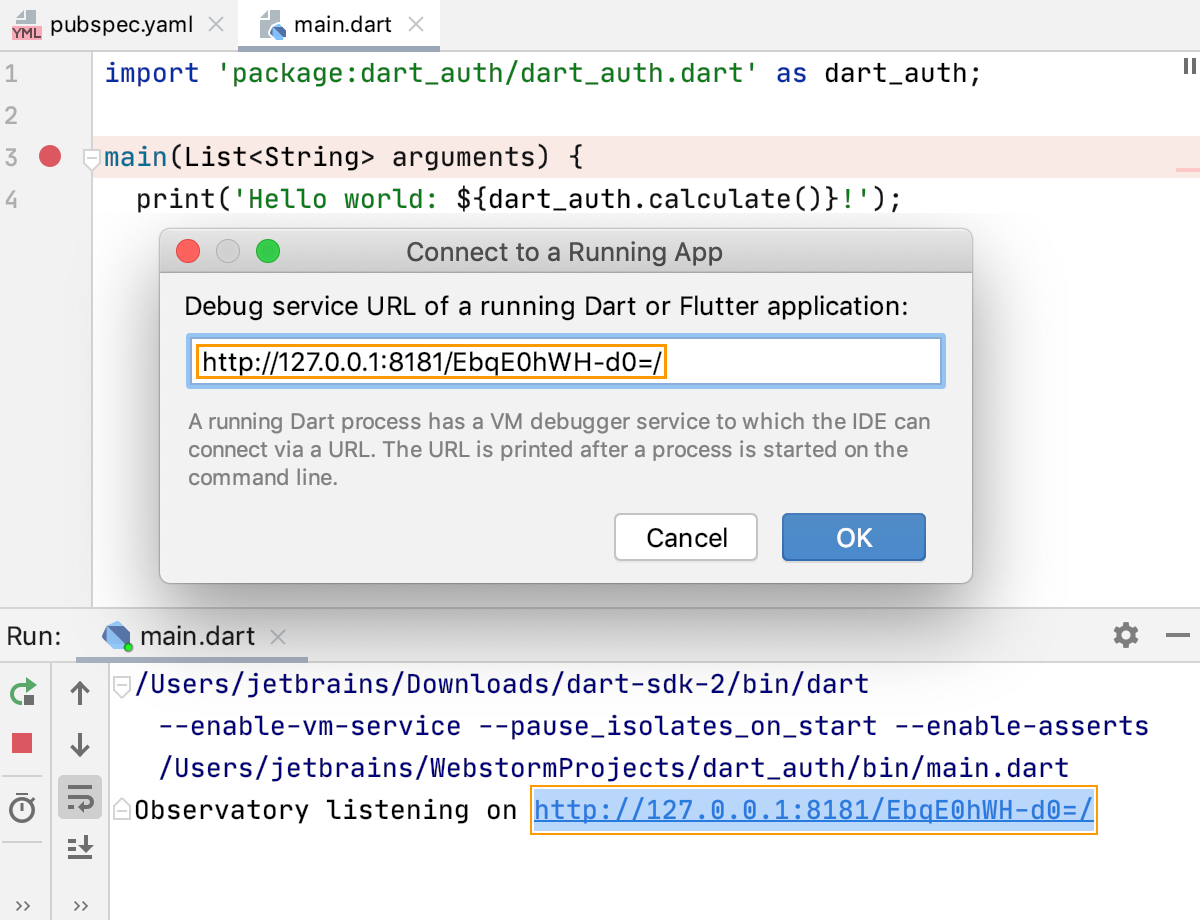
Start a remote Dart application with the VM options, for example, with
--enable-vm-service --pause_isolates_on_start. The application starts, immediately suspends thanks to the--pause_isolates_on_startargument, and waits for the debugger to connect.In the Run tool window, copy the URL address at which the application is running and the generated authentication token to access it.

Choose the newly created Dart Remote Debug configuration in the Select run/debug configuration list and click
.
In the Connect to a Running App dialog, paste the URL address and the authentication token you copied as described above.

In the Debug tool window that opens, step through the program, stop and resume program execution, examine it when suspended, and so on.
Running and debugging Dart web applications
You can run a Dart web application in any browser, while debugging is supported only in Chrome. To run a Dart web application, open the main HTML file of your application in a browser. Debugging a Dart web application is initiated through a run configuration of the type Dart Web.
WebStorm integrates with the webdev server tool to compile Dart code into JavaScript if necessary. For versions earlier than Dart SDK 2, the pub serve tool is used.
When you open a Dart web application in a browser, it normally starts with a built-in server URL like http://localhost:63342/project-name/web/index.html. However, the built-in server is not used to serve the application. Instead, WebStorm automatically starts webdev server on the port specified in the Dart dialog and the browser page is redirected to the webdev server URL (like http://localhost:53322/index.html).
The work of webdev server is logged in the dedicated Dart Webdev tool window. The tool window opens when you start running or debugging a Dart web application for the first time during the current WebStorm session. You can stop the tool by clicking on the toolbar. When you start running or debugging again, webdev server restarts automatically.
The recommended way to debug Dart web applications is to use a Dart Web configuration. In this mode, webdev server starts with Dart DevTools enabled.
However, you can still use a JavaScript Debug configuration. For more information, refer to Alternative way to run and debug Dart web applications.
Create a run/debug configuration
Create a Dart Web run/debug configuration:
Go to , in the Edit Configurations dialog that opens, click the Add button (
) on the toolbar and select Dart Web from the list.
In the Run/Debug Configuration: Dart Web dialog that opens, specify the path to the HTML file that references the Dart code to run or debug and the port on which the webdev server will start the Dart web app.
Run your application
From the Run/Debug Configurations widget list on the toolbar, select the newly created Dart Web configuration and click
next to it.
The browser opens at
127.0.0.1:<webdev_port>/<specified_HTML_file>.
Debug your application
Set the breakpoints in the Dart code, as required.
From the Run widget list on the toolbar, select the newly created Dart Web configuration and click
next to it.
Alternative way to run and debug Dart web applications
Besides using a Dart Web run/debug configuration, which is the recommended workflow, with WebStorm, you can still run and debug Dart web applications with a JavaScript Debug configuration.
Run a Dart web application
Open the HTML file with a Dart reference or select it in the Project tool window.
From the context menu of the editor or selection, select and choose the required browser in the list.
Create a JavaScript Debug run/debug configuration
Open the HTML file that references Dart or select the file in the Project tool window.
From the context menu, select Create '<HTML_file_name>'. The Run/Debug Configuration: JavaScript Debug dialog opens.
Specify the browser from the Chrome family to debug the application in.
The
URLfield already shows the URL address of the application in the format http://localhost:<built-in server port>/<project-name>/<relative path to the HTML file>. During a debugging session, the browser will be redirected from this URL to the webdev server URL.
Start debugging
Configure and set breakpoints in the Dart code.
Initiate a debugging session: choose the created run configuration from the Edit configurations list on the toolbar and click
. WebStorm opens the specified URL in the chosen browser.
In the Debug tool window that opens, step through the program, stop and resume program execution, examine it when suspended, and so on.
Testing Dart applications
WebStorm supports running and debugging Dart tests that are written using the dart test package. You can run tests on any target platform, debugging is supported only for VM tests.
You can run and debug single tests, test groups, as well as tests from entire files and folders. WebStorm creates a run/debug configuration with the default settings and launches the tests. You can later save this configuration for reuse.
Run or debug a single test
Open the test file in the editor, right-click the call of the test() method, and choose Run '<test_name>' or Debug '<test_name>' from the context menu.
Run or debug a group
Open the test file in the editor, right-click the call of the group() method, and choose Run '<group_name>' or Debug '<group_name>' from the context menu.
Run or debug Dart tests from a file
In the Project tool window, select the file with the tests to run and choose Run '<file_name>' or Debug '<file_name>' from the context menu.
Run or debug Dart tests from a folder
In the Project tool window, select the folder with the tests to run and choose Run '<folder_name>' or Debug '<folder_name>' from the context menu.
Save an automatically generated default configuration
After a test session is over, choose Save <default_test_configuration_name> from the context menu of the test, test group, test file, or folder.
Run or debug tests using a previously saved run/debug configuration
Choose the required Dart Test configuration from the list on the toolbar and click
or
.
Configuring syntax highlighting
You can configure Dart-aware syntax highlighting according to your preferences and habits.
In the Settings dialog (Ctrl+Alt+S) , go to .
Select the color scheme, accept the highlighting settings inherited from the defaults or customize them as described in Colors and fonts.