Start the debugger session
Any debugger session is based on a run/debug configuration. The configuration type depends on the type of your application and the runtime environment.
You can run several debugger sessions with different configurations at a time.
Through a configuration you do not only launch your application but can also tell WebStorm to use some parameters or perform some actions before the application starts. For example, you can pass Node.js-specific command line options to the Node.js executable file.
Before debugging
Set the breakpoints in your code.
To debug code compiled to JavaScript, you need to generate a source map for it. This will set the correspondence between lines in your original code and in the generated JavaScript code. If no source map is generated, your breakpoints will not be recognized and processed correctly.
Source maps are required for debugging TypeScript, CoffeeScript, JavaScript with JSX, ES6 and newer versions, etc.
Start debugging
Select the required configuration from the Run widget on the toolbar and click
 next to it.
If your application consists of an HTML file with a reference to JavaScript code and the application is running on the built-in server, just open this HTML file or select it in the Project tool window and then select Debug <HTML_file_name> from the context menu. WebStorm generates a temporary debug configuration and starts a debugging session through it.

If you need to start your application in the development mode via an
npmscript, you can modify the npm run/debug configuration, so it both launches the application in the development mode and starts a debugging session at the same time.To do that, open the npm run/debug configuration that launches your application in the development mode, switch to the Browser / Live Edit tab, select the After launch checkbox, specify the URL address at which the application wil run, and select Google Chrome or another Chromium-based browser to open the application in.
Learn more from Run and debug an Angular application with a single npm run/debug configuration, Run and debug a Vue.js application with a single npm run/debug configuration, Run and debug a Vite application with a single npm run/debug configuration.
If your application is running in the development mode on
localhost, you can start debugging it from the built-in Terminal (Alt+F12), from the Run tool window, or from the Debug tool window. Just hold Ctrl+Shift and click the URL at which the application is running.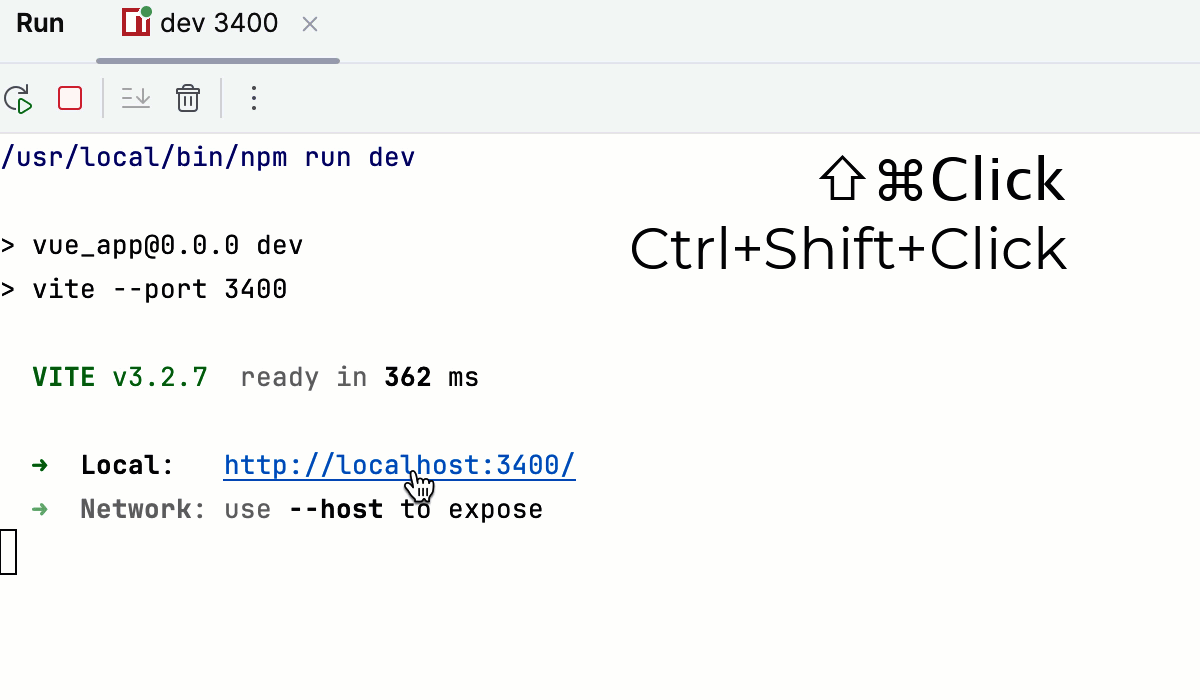
Learn more from Debug a Vue.js application, Debug an Angular application, Debug a Vite application and Debug a React application.
If you launched your application in the development mode from the New Terminal, you can just click the Start debugging in browser button next to the link.

By default, the button is not shown. To have it displayed, open the Settings dialog (Ctrl+Alt+S) , go to , and select the Show 'Start Debugging in Browser' button for localhost links in the Terminal checkbox in the JavaScript and TypeScript area.
You can also attach the debugger to a running Node.js application from the built-in Terminal (Alt+F12) or from the Run tool window. To start debugging, hold Ctrl+Shift and click the URL link in the information message
Debugger listening <host>:<port>.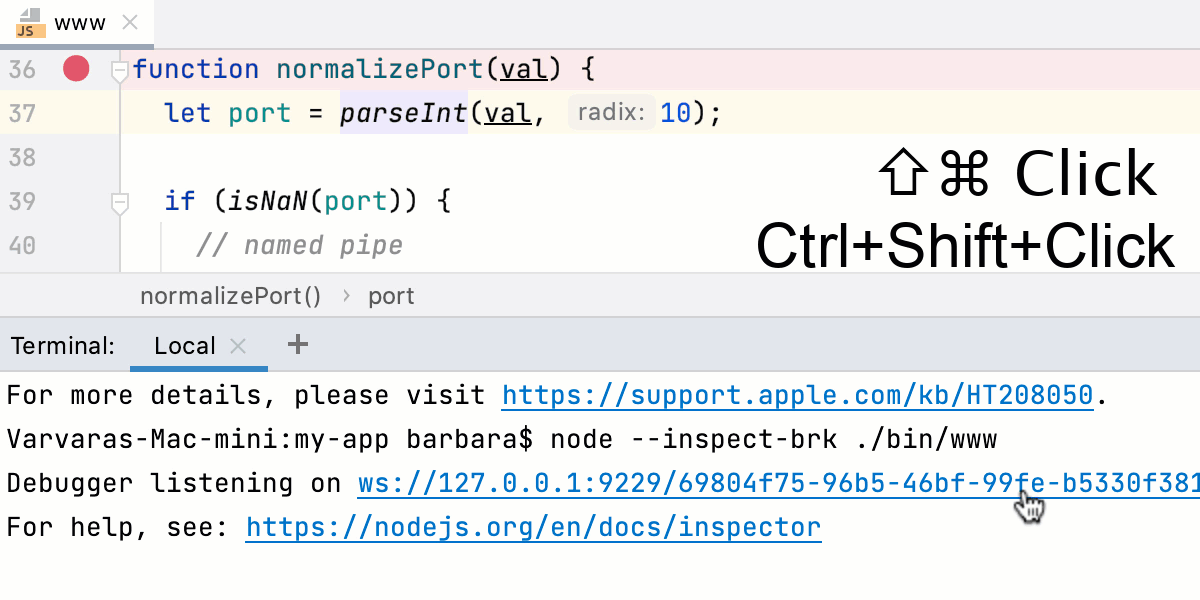
Learn more from Debugging a running Node.js application.
Note that after you launch a debugger session, the ![]() icon that marks the Debug Tool Window toggles to
icon that marks the Debug Tool Window toggles to ![]() to indicate that the debugging process is active.
to indicate that the debugging process is active.
Pause/Resume a debugger session
When the debugger session is running, you can pause/resume it using the buttons on the toolbar of the Debug tool window:
To pause a debugger session, click
 .
.To resume a debugger session, click
 F9.
F9.
Restart a debugger session
Click the Rerun button in the Debug tool window or press Ctrl+F5.

Locate the process ID (PID) of the debug session
To view the PID of the application you are currently debugging, hover over the corresponding session tab in the Debug tool window.
A tooltip appears that displays the PID of the debug session.

Reload the current page in browser
When debugging a simple HTML+JavaScript application on the WebStorm built-in server, you can reload the page where you have currently navigated instead of restarting the application entirely.
Click
 . All the previous output is cleared and the debugger returns to the first breakpoint. Learn more from Reload the current page in browser.
Terminate a debugger session
Click
 in the Debug tool window.
Alternatively, press Ctrl+F2 and select the process to terminate (if there are two or more of them).

Productivity tips
- Run before-launch tasks
You can configure external tools or custom actions to run before a debugging session. Examples of before-launch actions are running a Gulp, Grunt, or NPM script, compiling your TypeScript code into JavaScript, or running all the currently active File Watchers to compile or compress your code, uploading your sources to a remote server, and many more, depending on the language and frameworks you are using.