Getting started with WebStorm
Welcome to the WebStorm getting started guide! Learn how to quickly set up this JetBrains IDE, with most features ready to use right out of the box.
Open or create your first project
One of the first things that you’ll notice after you download and install WebStorm is that you need a project to get started. The project-first approach helps WebStorm understand the context of what you will be working on better and provide you with more advanced coding assistance.
You have several options to choose from for starting your project:
Clone Repository – Get an existing project from Git or GitHub.
New Project – Create an empty project or generate a project from an existing template, like ones for React, Angular, or Vue.
Open – Open a project stored on your machine.
You can also start with our playground project to get a quick tour of some of the key features – go to New Project | New Project and check the Generate a playground project with onboarding tips box.

Once you've opened a project, you can start coding as usual. To create your first file, open the Project tool window, select the folder where you'd like to create the file, right-click it, choose New, and select the file type from the list.
Save time with shortcuts
If you’ve never used WebStorm or other JetBrains IDEs before, getting used to new shortcuts can be challenging. Here are a few tips that can help you with that.
Customize your keymap
WebStorm suggests a predefined keymap based on your environment. You can find this keymap in Settings | Keymap. If you change the shortcut for an action, WebStorm will store those changes in a copy of the predefined keymap and use that copy by default moving forward.
If you're coming from another editor or IDE, you can switch to the corresponding keymap. Some of the available options include VS Code and Sublime Text.

You can also add Vim-like capabilities to your IDE with the IdeaVim plugin.
Learn WebStorm shortcuts
Learning WebStorm shortcuts will come in handy even if you decide to switch to another JetBrains IDE later on – the shortcuts are the same in almost all of them. Here’s what can help you learn them faster:
Memorize WebStorm’s most universal shortcut – ShiftShift, or Search Everywhere. You can use it to find any file, action, class, or symbol, and see all the matches in one place.
Install Key Promoter X – This extension helps you learn essential shortcuts while working. When you use the mouse on a button inside the IDE, Key Promoter X shows you the shortcut you could have used instead.
Use the WebStorm shortcut cheat sheet – You can download the default WebStorm keymap reference for macOS or Windows and Linux.
Watch the video below for more essential shortcuts and productivity tips.
Customize WebStorm
WebStorm’s UI might look overwhelming at first. You can customize it and turn off anything you don’t need. Here are some general customization tips.
Plugins
In WebStorm, extensions are called plugins. They allow you to extend the built-in functionality and customize the IDE to fit your needs. To explore available plugins, go to the Marketplace tab in Settings | Plugins.

UI themes
WebStorm comes with only a few predefined themes, but there’s a variety of custom options to choose from. To explore them, go to Settings | Plugins and search for “theme” in the Marketplace tab.

You can then go back to the editor and check how the themes you’ve installed look. Choose View | Quick Switch Scheme from the main menu or press Ctrl+` and select Theme. From there, you’ll be able to preview the available themes all in one go.
Project view settings
WebStorm has its own Explorer, the Project tool window, with default behavior that slightly differs from other code editors. For instance, you need to double-click a file to open it in the editor. Here’s how you can change the default setup:
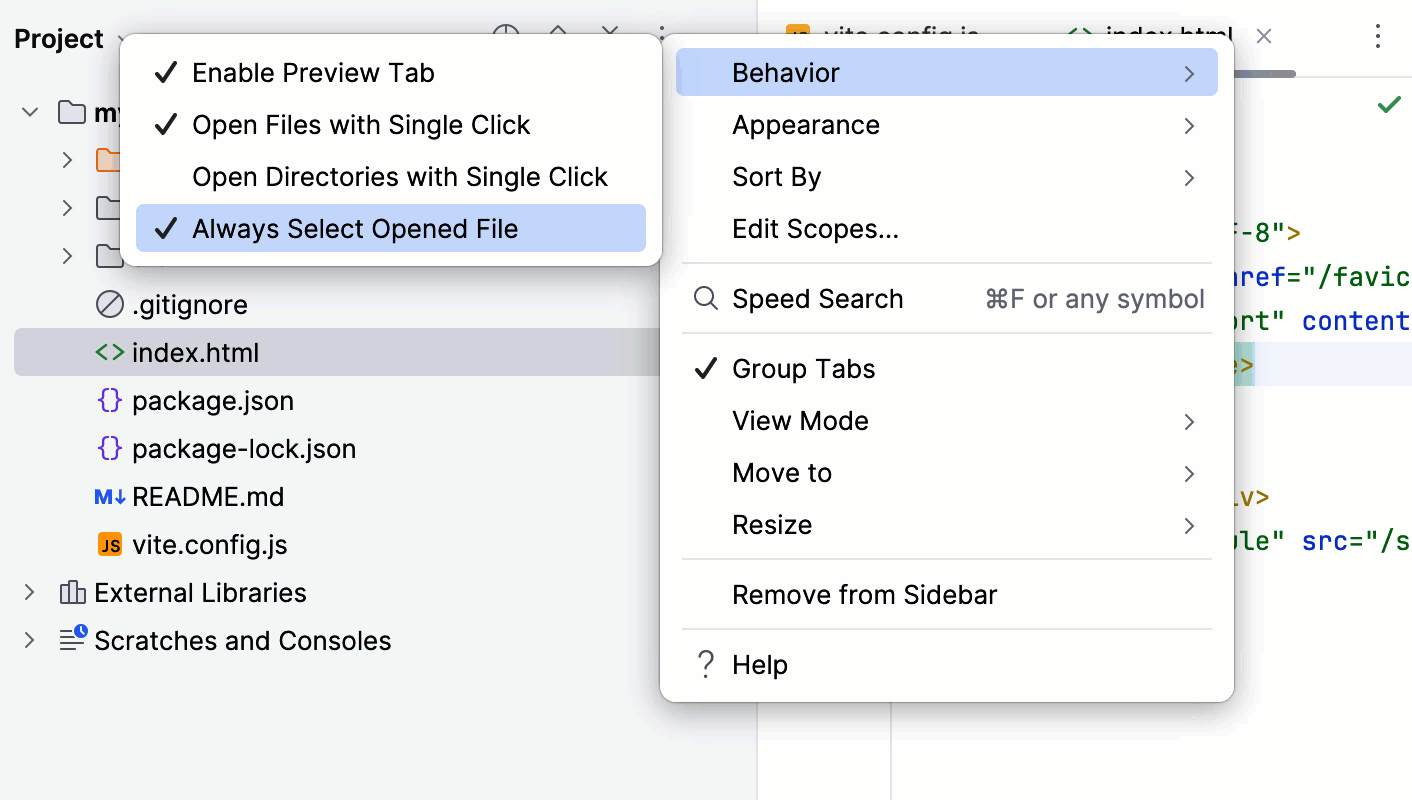
You can go to the Project tool window settings and select any or all of these options under Behavior:
Enable Preview Tab – Preview files you have selected in the Project tool window in the editor.
Open Files / Directories with Single Click – Open files or directories in the editor with one click.
Always Select Opened File – Auto-select the file that’s currently open in the Project tool window.
Compact mode
Compact Mode reduces the size of toolbars, tool windows, and buttons to create more screen space for your code. It's ideal if you prefer a cleaner, minimalist interface or are working on a smaller screen. To enable it, select Navigate | Search Everywhere from the main menu or press Shift +Shift, type in “compact mode,” and turn it on.
Screen sharing setup
When presenting your code or demoing features in WebStorm, these settings can help improve visibility and make it easier for others to follow along:
You can access all of these settings via Search Everywhere:
Presentation Assistant – Display keyboard shortcuts in real time as you use them. Go to Settings | Appearance & Behavior | Presentation Assistant to customize what’s shown in the popup. For example, you can choose to display shortcuts for other operating systems.
Zoom – Type "zoom" in Search Everywhere to quickly zoom in or out throughout the entire IDE interface.
Presentation Mode – Select Enter Presentation Mode from the Search Everywhere popup to enable it. You can exit the mode the same way — just type "exit presentation mode."
Set up common workflows
In WebStorm, most configurations are ready to use, allowing you to get straight to coding. Below, you'll find tips for setting up essential workflows. Use the documentation search for help with anything else.
Version control
WebStorm detects your version control system automatically. Here's how to handle some common tasks:
Update your project – Click the branch name in the top left-hand corner and select Update Project. You can either merge the incoming changes to the current branch or rebase the current branch on top of those changes.
Commit changes – Use the Commit tool window to quickly commit your changes. To make a partial commit, select only specific files or changes within those files.
View the diff – In the Commit tool window, double-click the file you want to see the diff for.
View logs – For Git, you can see the commit history. Open the Git tool window for a detailed log of changes.
Running and debugging
WebStorm helps you run and debug your Node.js applications or scripts, as well as frontend applications and tests. You can debug applications started from WebStorm or attach the debugger to an external Node.js program.
Node.js applications and scripts
To debug a Node.js application or script in WebStorm, right-click within the editor and select Debug from the context menu. You can also set a breakpoint by clicking the area on the left-hand side of the editor. For instructions on attaching the debugger to an already running application, see this section.
Frontend applications
To start a debugging session for a frontend application, first run the npm script to launch the application. Then, Ctrl+ShiftClick on the link in the output of the Terminal or Run tool windows to initiate JavaScript debugging in the browser.
For Next.js, to start server-side debugging, begin by debugging an npm script. Then, Ctrl+ShiftClick on the link in the output of the Terminal or Run tool windows to start client-side debugging.
Tests
Use the icons on the left-hand side of the editor to run or debug a specific test file or suite. You can also run multiple tests by right-clicking a folder in the Project tool window and selecting Run Tests. See this section for more information.
Actions on save
You can configure WebStorm to perform a specific action or run a tool like Prettier or ESLint every time you save a file after modifying it. To do this, go to Settings | Tools | Actions on Save and check the necessary boxes there.
Get started with AI in WebStorm
To enhance your workflow with AI-powered capabilities, use the JetBrains AI Service, which is natively integrated into WebStorm and provides a variety of AI models. You can also use AI models from supported third-party providers with your own API key or connect locally hosted models. Learn more from Supported models
AI agents autonomously plan and execute multistep development tasks in your project through integration with AI models. WebStorm supports the Agent Client Protocol (ACP), allowing you to connect external AI agents and use them in the AI Chat. ACP defines a standard communication interface, so any agent that implements the protocol can be added without requiring a custom integration. Learn more from AI agents.
Activate an agent and connect a model
Make sure you are logged in with a valid JetBrains Account.
Activate your license as described in the AI Assistant Help.
Install the AI Assistant plugin on the Settings | Plugins page, tab Marketplace, as described in Installing plugins from JetBrains Marketplace.
Open the AI Chat tool window by pressing Alt+Shift+1.
To use an integrated with WebStorm agent, select it from the Agent drop-down list. If you have not installed the agent yet, WebStorm will suggest that you install it when you run the first prompt.
Type a prompt in the AI Chat. If the selected agent is not installed yet, WebStorm suggests that you install it.

Optionally
It is recommended that you accept the default model for the selected agent. To use another model, select it from the Models list.
You can also select a custom logical reasoning level instead of the preselected Default one.
Learn more from Supported models.

Explore JetBrains AI plans and usage
JetBrains AI offers several license tiers. The difference between license tiers lies in the quota size, which in its turn depends on your subscription plan – higher tiers offer more AI Credits, providing additional resources for using AI features. Please, refer to JetBrains AI plans and usage for details.
What to try first
Whether you are new to AI or just beginning to integrate it into your development workflow, these high-value actions are a great place to start.
Write a commit message with AI
Open the Commit tool window by pressing Alt+0, select the files to commit, and then click
 .
.Learn more from Generate commit messages.
Review your code with AI
Before committing your changes, you can ask JetBrains AI to review your updates. This highlights any potential issues and helps you to make improvements immediately or track them for future revisions.
Open the Commit tool window by pressing Alt+0, select the files to commit, and then click
.
On the AI Self-Review tab of the Problems tool window that opens, go through the detected issues.
Learn more from Perform self-review with AI.
Resolve merge conflicts automatically with AI
JetBrains AI can help you resolve merge conflicts by merging conflicting changes automatically.
In the Merge Revisions dialog, click
on the toolbar.Review the merged result in the central pane of the dialog, edit if necessary, and click Apply.
To revert changes in the modified lines, click Revert.
Optimize SQL queries with AI
JetBrains AI can optimize your SQL queries for better performance and efficiency.
In a query console, right-click your query and select from the context menu.

Review the suggestions in the AI Chat tool window.

Learn more from Use AI with databases.
What AI cannot do
AI is an assistant, not a substitute for your judgment. Always review generated code, explanations, and changes before using them.
What is next
You've learned the basics of using AI from WebStorm. Continue with the full AI Assistant documentation to explore advanced features, including AI agents, code generation, code review, terminal integration, model configuration, and customization.
Collaborative and remote development
WebStorm offers tools to help you collaborate and work on your projects remotely.
Code With Me
This feature allows you to share your locally running project in real time. Your collaborators can join your coding session, make edits, and run or debug code together. To start, click on the Code With Me icon and send an invite to your teammates.
See this section for more information.
Remote development
WebStorm also supports remote development, allowing you to connect to a remote machine and work as if the project were running locally. You can open, edit, run, and debug code on a remote server directly from the IDE. To set it up, head to File | Remote Development.
See this section for more information.
How to get support
You can check out our community forum to find answers to many common questions and ask other WebStorm users for help.
To report a bug or ask for a new feature, please create a new issue here. Learn more from Contact support and Report bugs.