Vitest
WebStorm integrates with Vitest, a Vite-native unit test framework. You can run, debug, do snapshot testing, and measure test coverage both from the editor and via a run/debug configuration.
You can re-run failed tests or turn on the watch mode. When you launch a test session in this mode, WebStorm monitors changes in your project source code. As soon as any changes are made to a test or to its subject, WebStorm re-runs the affected test, you do not even have to re-start the run/debug configuration.
Before you start
Make sure you have Node.js on your computer.
Make sure the Vite plugin is enabled in the settings. Press Ctrl+Alt+S to open settings and then select . Click the Installed tab. In the search field, type Vite. For more information about plugins, refer to Managing plugins.
Install Vitest
In your command-line shell or in the embedded Terminal (Alt+F12) , type:
npm install --save-dev vitest
Learn more from Getting Started and Configuring Vitest on the Vitest official website.
Run and debug tests
With WebStorm, you can quickly run or debug a single Vitest test right from the editor or create a run/debug configuration to run or debug some or all of your tests.
For more information about creating Vitest tests for JavaScript and TypeScript code, refer to Vitest features on the Vitest official website.
Run or debug a single test from the editor
Click
 or
or  in the gutter and select Run <test_name> from the list.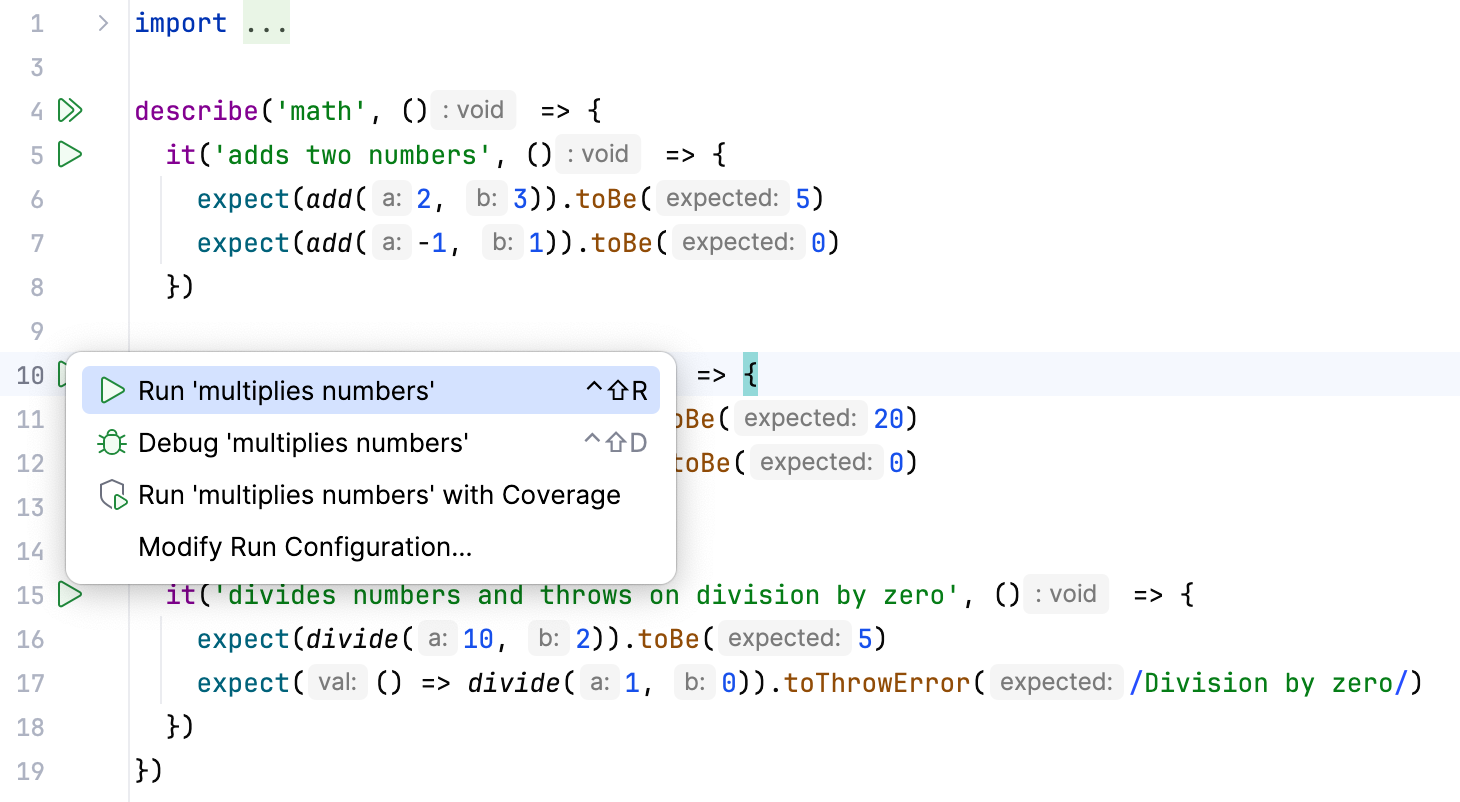
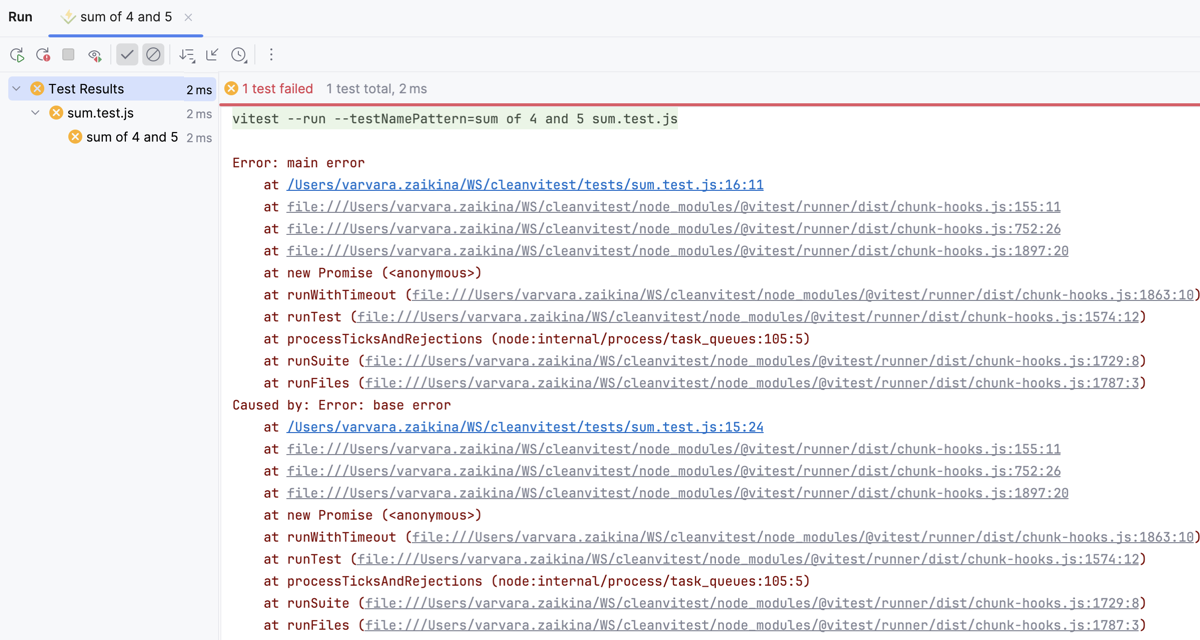
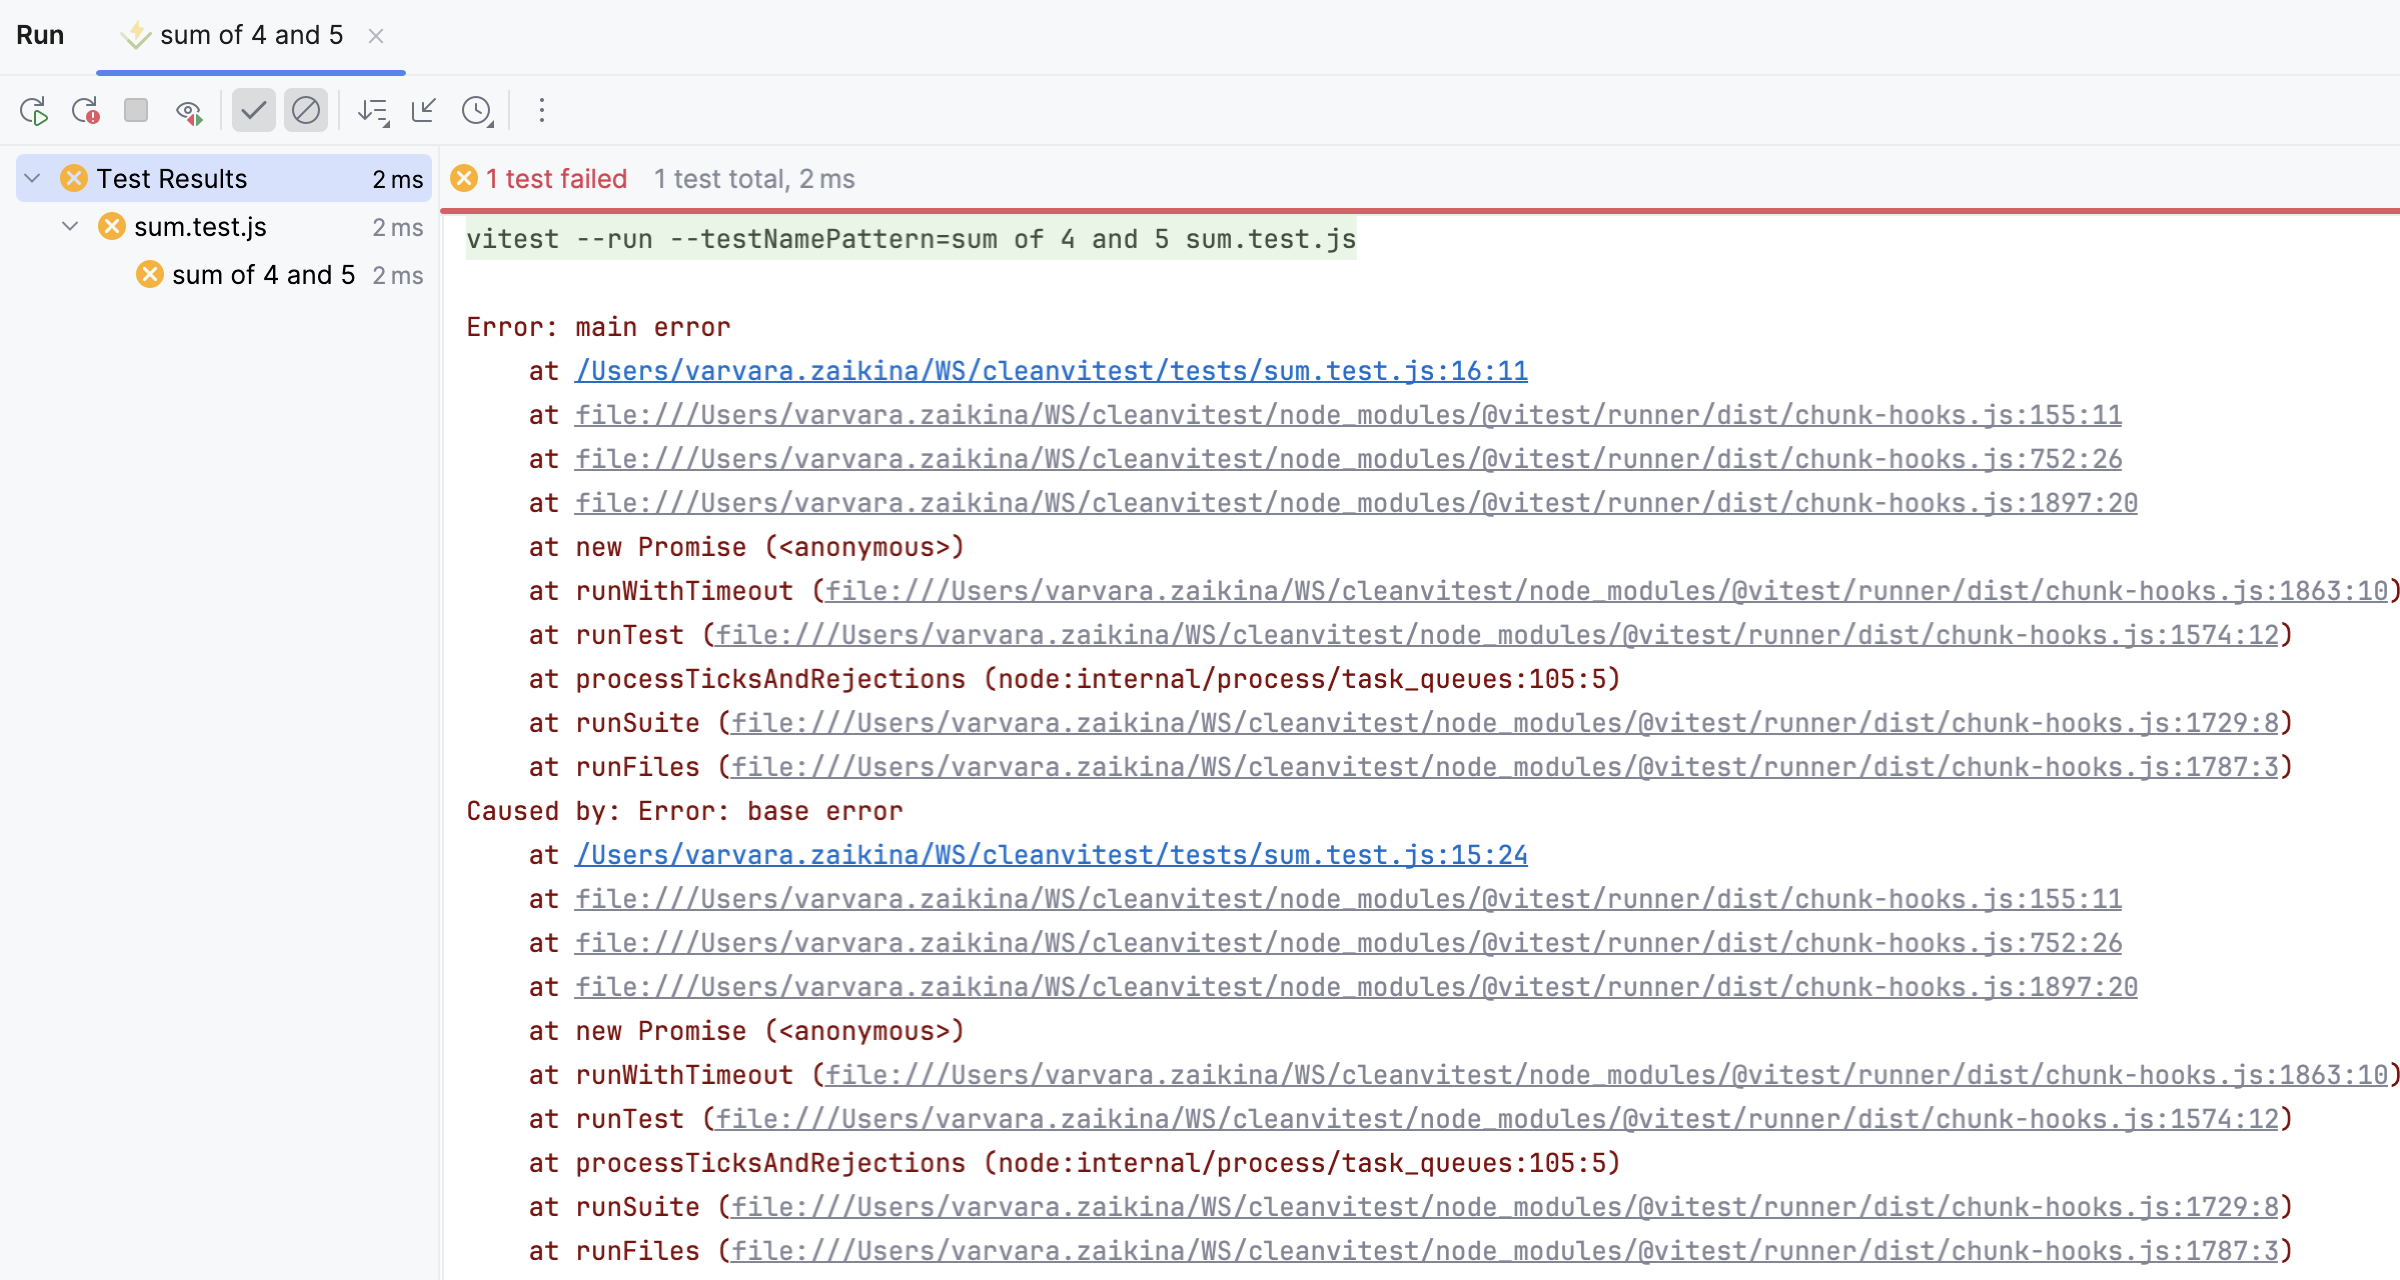
View the results of running your tests in the Run tool window. For failed tests, information on where an error occurred and what caused it is displayed.
You can also see whether a test has passed or failed right in the editor, thanks to the test status icons
 and
and  in the gutter.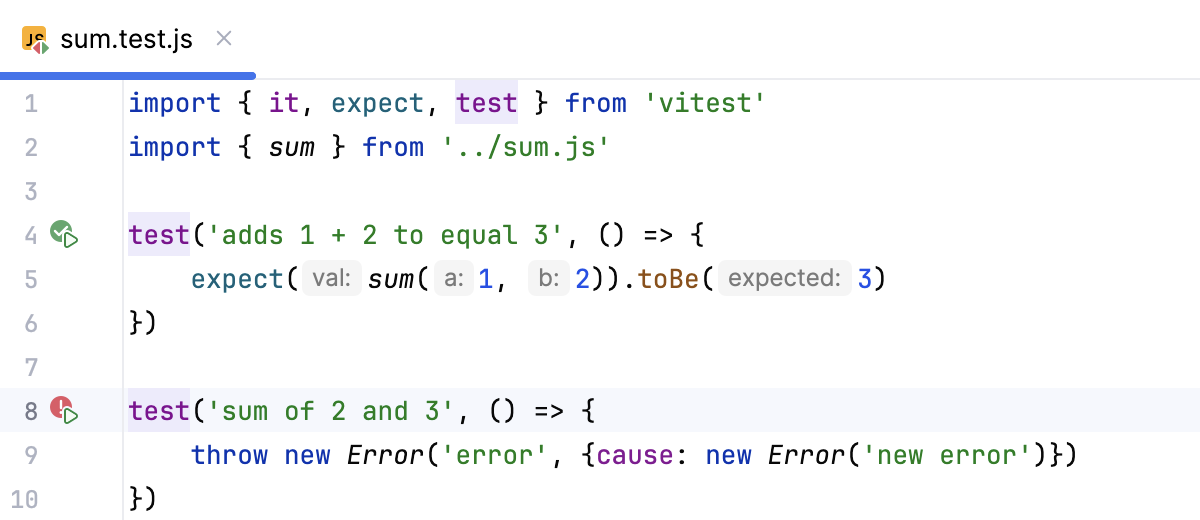
To debug a test, set a breakpoint inside it, click
or in the gutter and select Debug <test_name> from the list.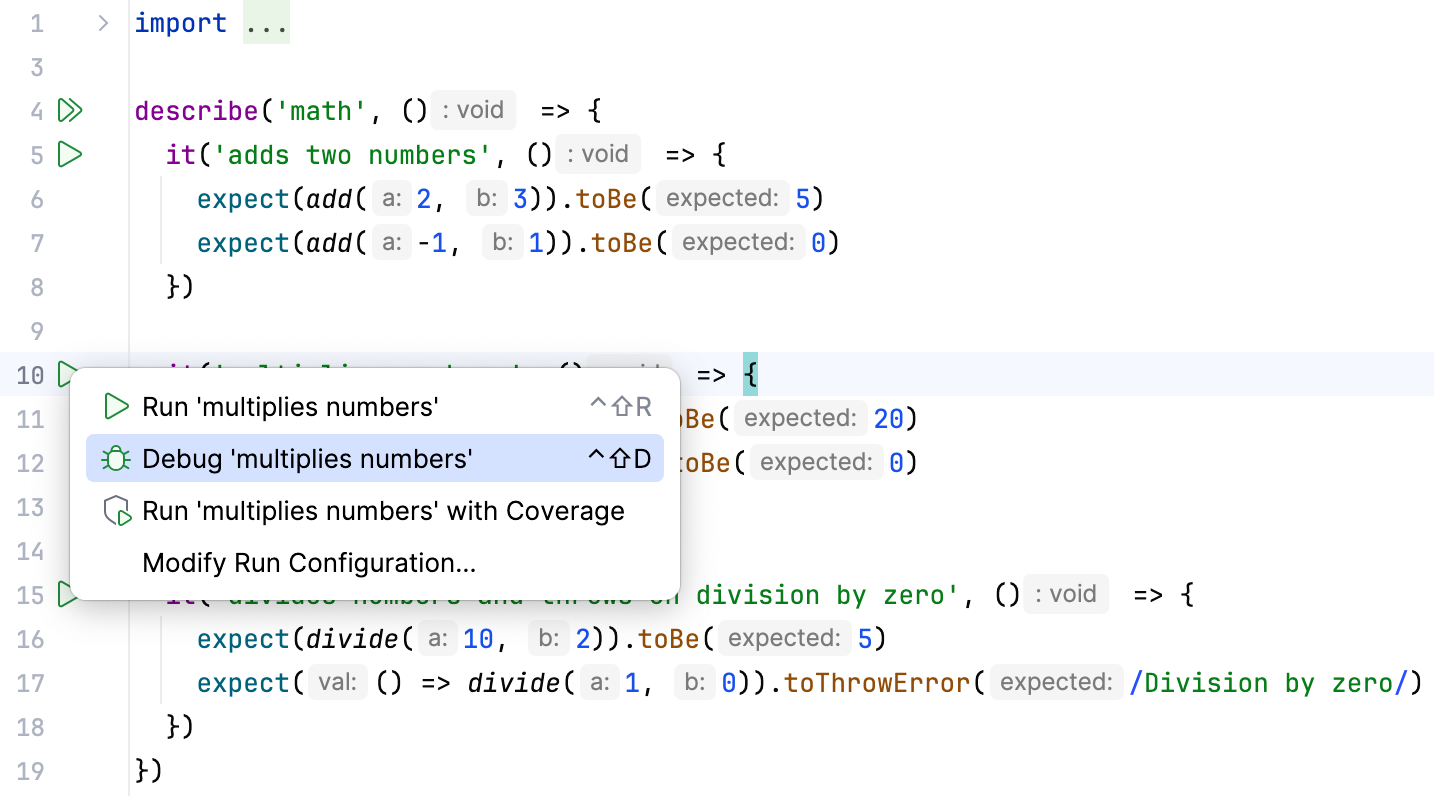
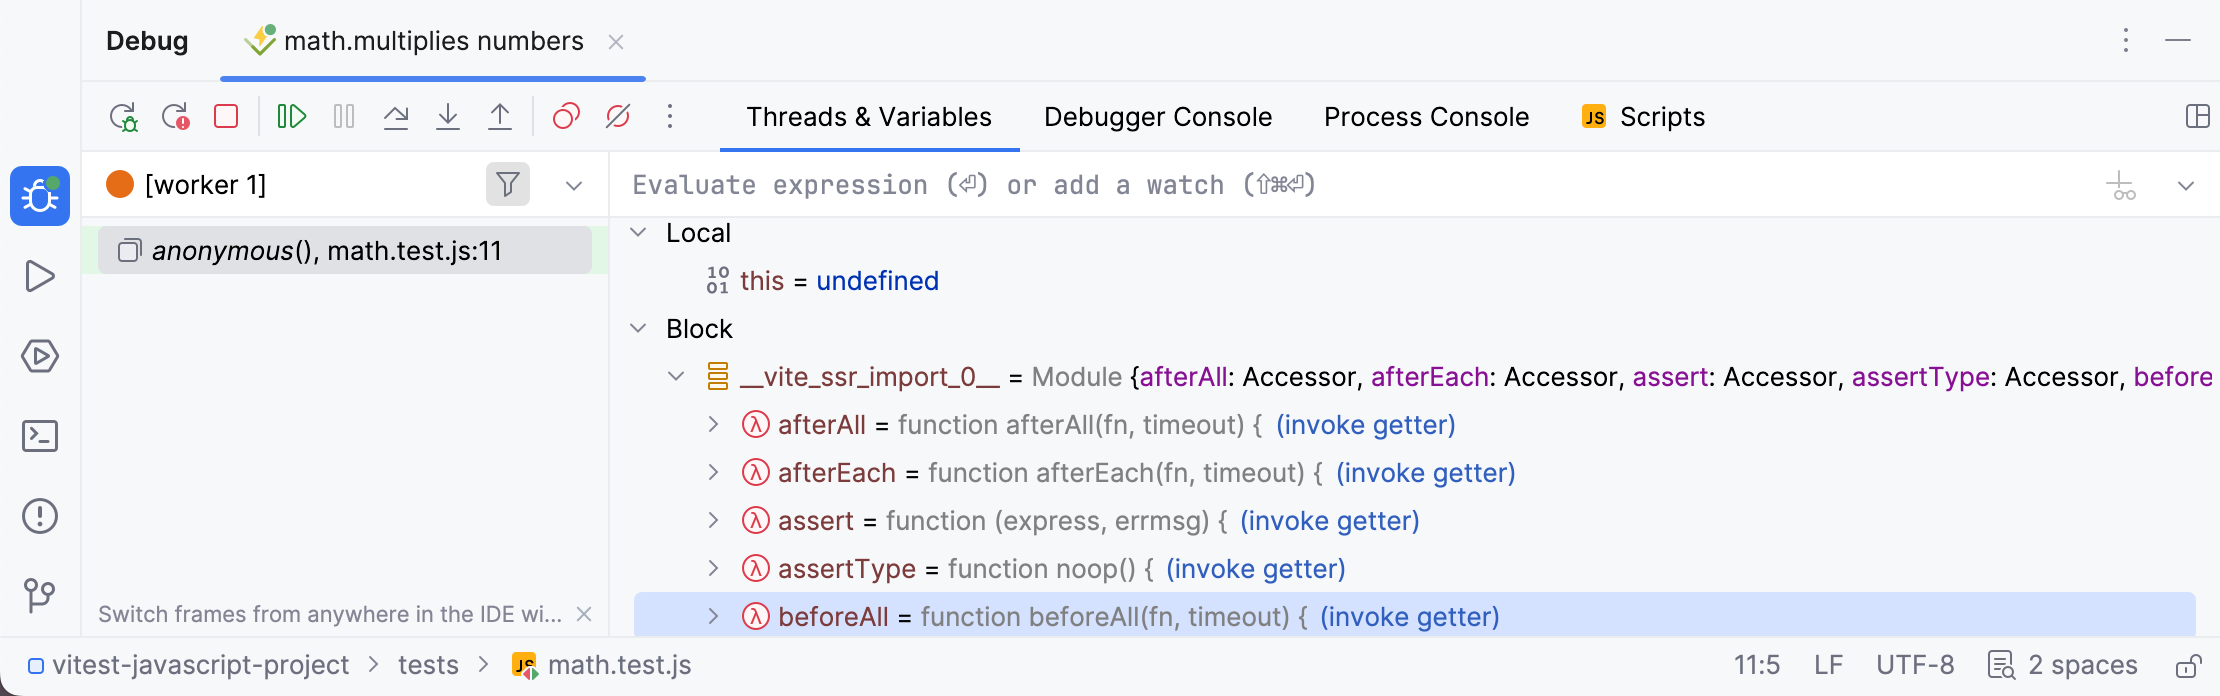
In the Debug tool window, examine the suspended test and step through it.
Create a Vitest run configuration
Open the Run/Debug Configuration dialog ( in the main menu), click
 in the left-hand pane, and select Vitest from the list. The Run/Debug Configuration: Vitest dialog opens.
Specify the Node.js runtime to use.
If you choose the Project alias, WebStorm will automatically use the project default interpreter from the Node runtime field on the JavaScript Runtime page . In most cases, WebStorm detects the project default runtime and fills in the field itself.
You can also choose another configured local or remote interpreter or click
 and configure a new one.
For more information, refer to Configuring remote Node.js runtimes, Configuring a local Node.js runtime, and Using Node.js on Windows Subsystem for Linux.
Optionally specify the Node.js-specific option parameters and the environment variables to be passed to Node.js.
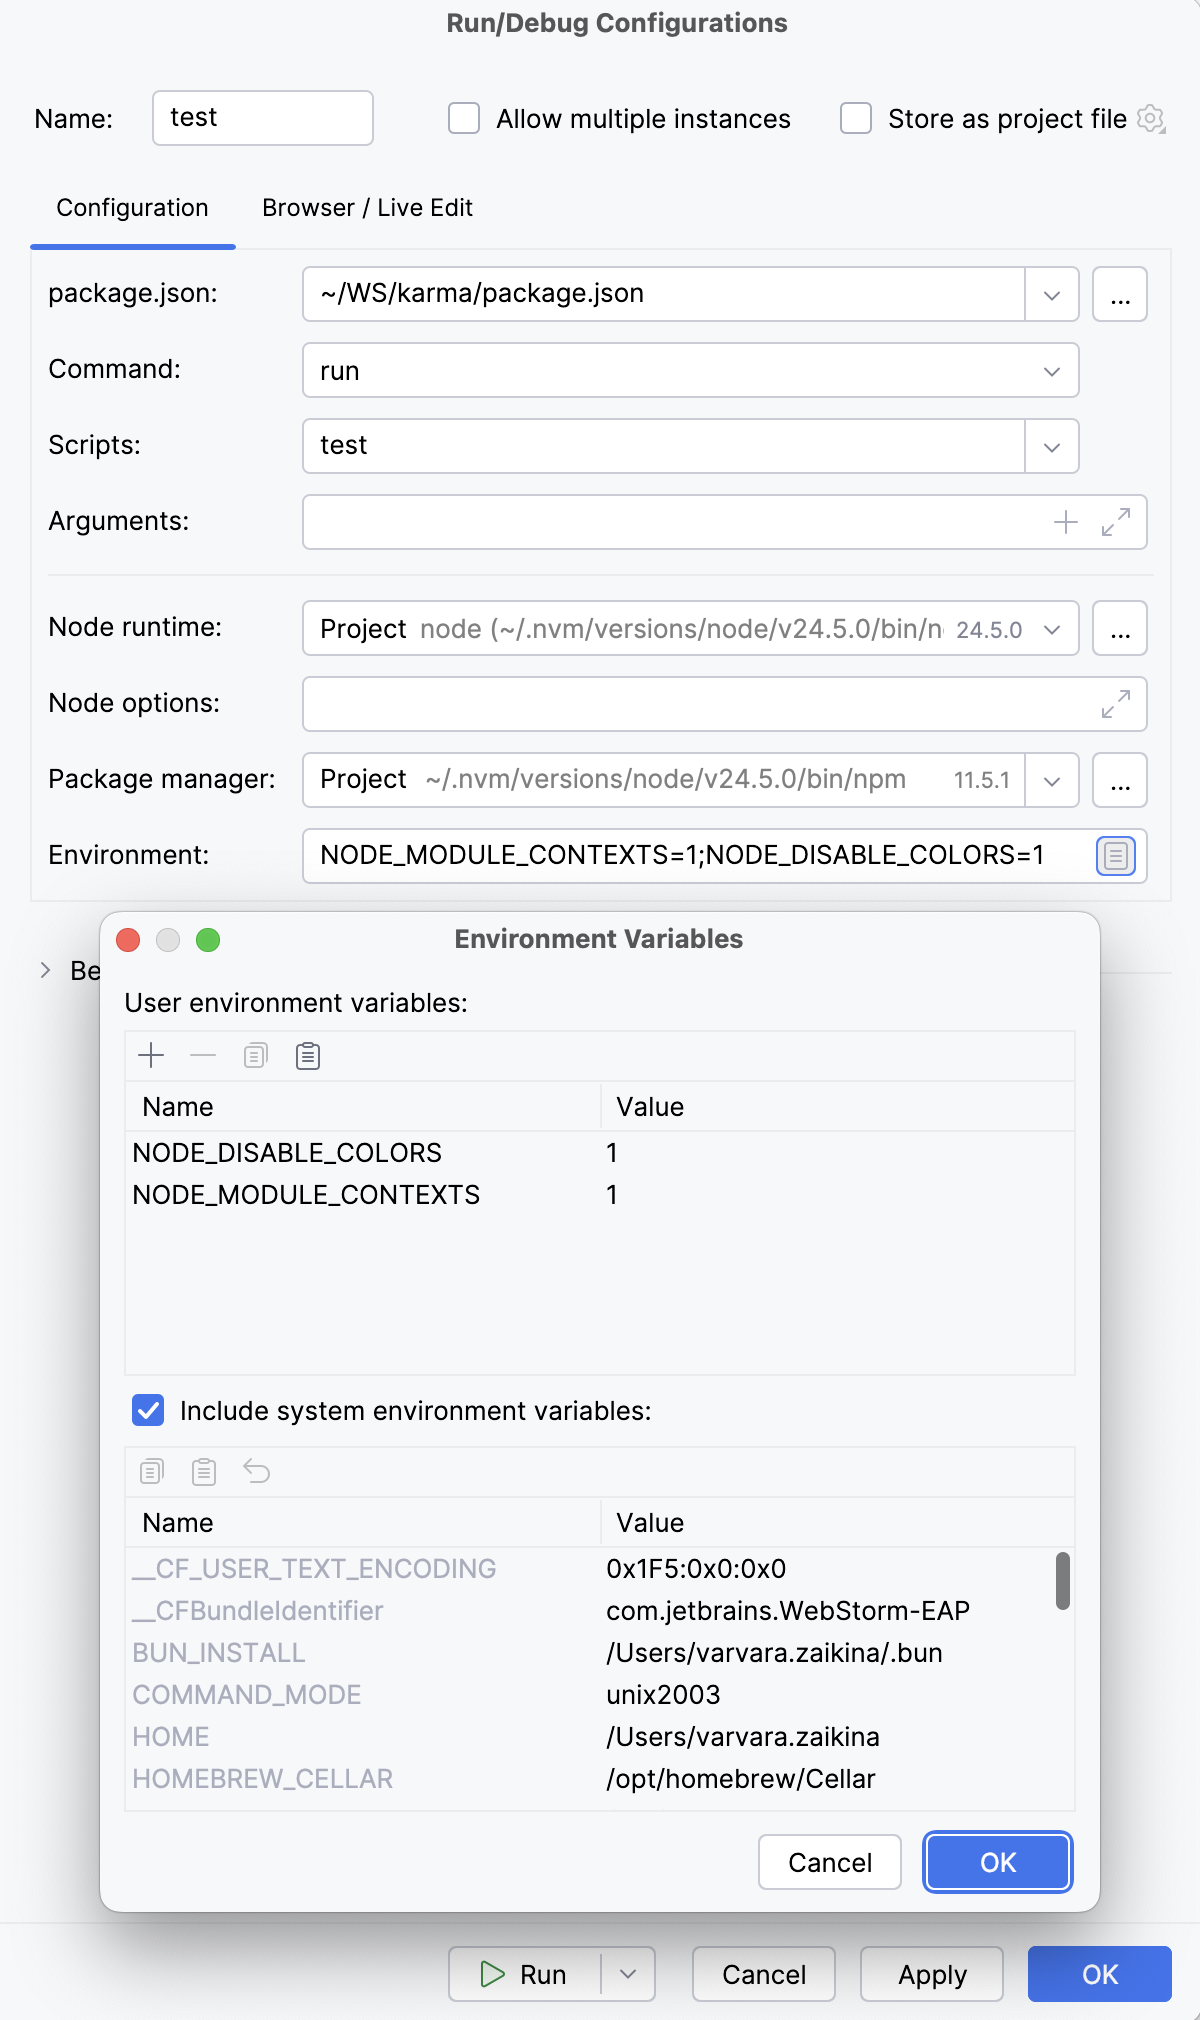
The definitions of variables are displayed in the Environment variables field with semicolons (
;) as separators, for example:NODE_PATHA list of additional directories to search when resolving modules. To separate directories in a list, use colon (
:) on macOS or Linux, use semicolon (;) on Windows.NODE_MODULE_CONTEXTSSet to 1 to load modules in their own global contexts.
NODE_DISABLE_COLORSSet to 1 to disable colors in the REPL.
Alternatively, click Browse
 to the right of the field and configure a list of variables in the Environment Variables dialog, that opens:
Use
,  ,
,  and
and  buttons to manage the list of custom variables.
The dialog also shows a list of available system environment variables. Clear the Include system environment variables checkbox if you don't want to use the system environment variables for the current configuration.
Click OK, when ready.
Specify the location of the
vitestpackage.Specify the working directory of the application. By default, the Working directory field shows the project root folder. To change this predefined setting, specify the path to the desired folder.
Specify the tests to run. This can be a specific test or suite, an entire test file, or a folder with test files.
By default, vite.config.ts is used. If vite.config.ts is missing, or you want to use a custom configuration, specify the vitest.config.ts to use. Learn more from the Vitest official website.
Optionally:
Configure rerunning tests automatically on changes in them or in the related source files. To do that, add the
--watchflag in the Vitest options field.You can also add other Vitest options. For more information, refer to the Vitest official website.
Optionally:
In the Node options field, type the Node.js-specific command-line options to be passed to the Node.js executable file. The acceptable options are:
Use
--require coffeescript/registerto have CoffeeScript files compiled into JavaScript on the fly during run.This mode requires that the register.js file, which is a part of the
coffeescriptpackage, is located inside your project. Therefore, make sure you have thecoffeescriptpackage installed locally as described in Install the CoffeeScript compiler.Use
--inspector--inspect-brkparameter for Chrome Debugging Protocol support.
Run tests via a run configuration
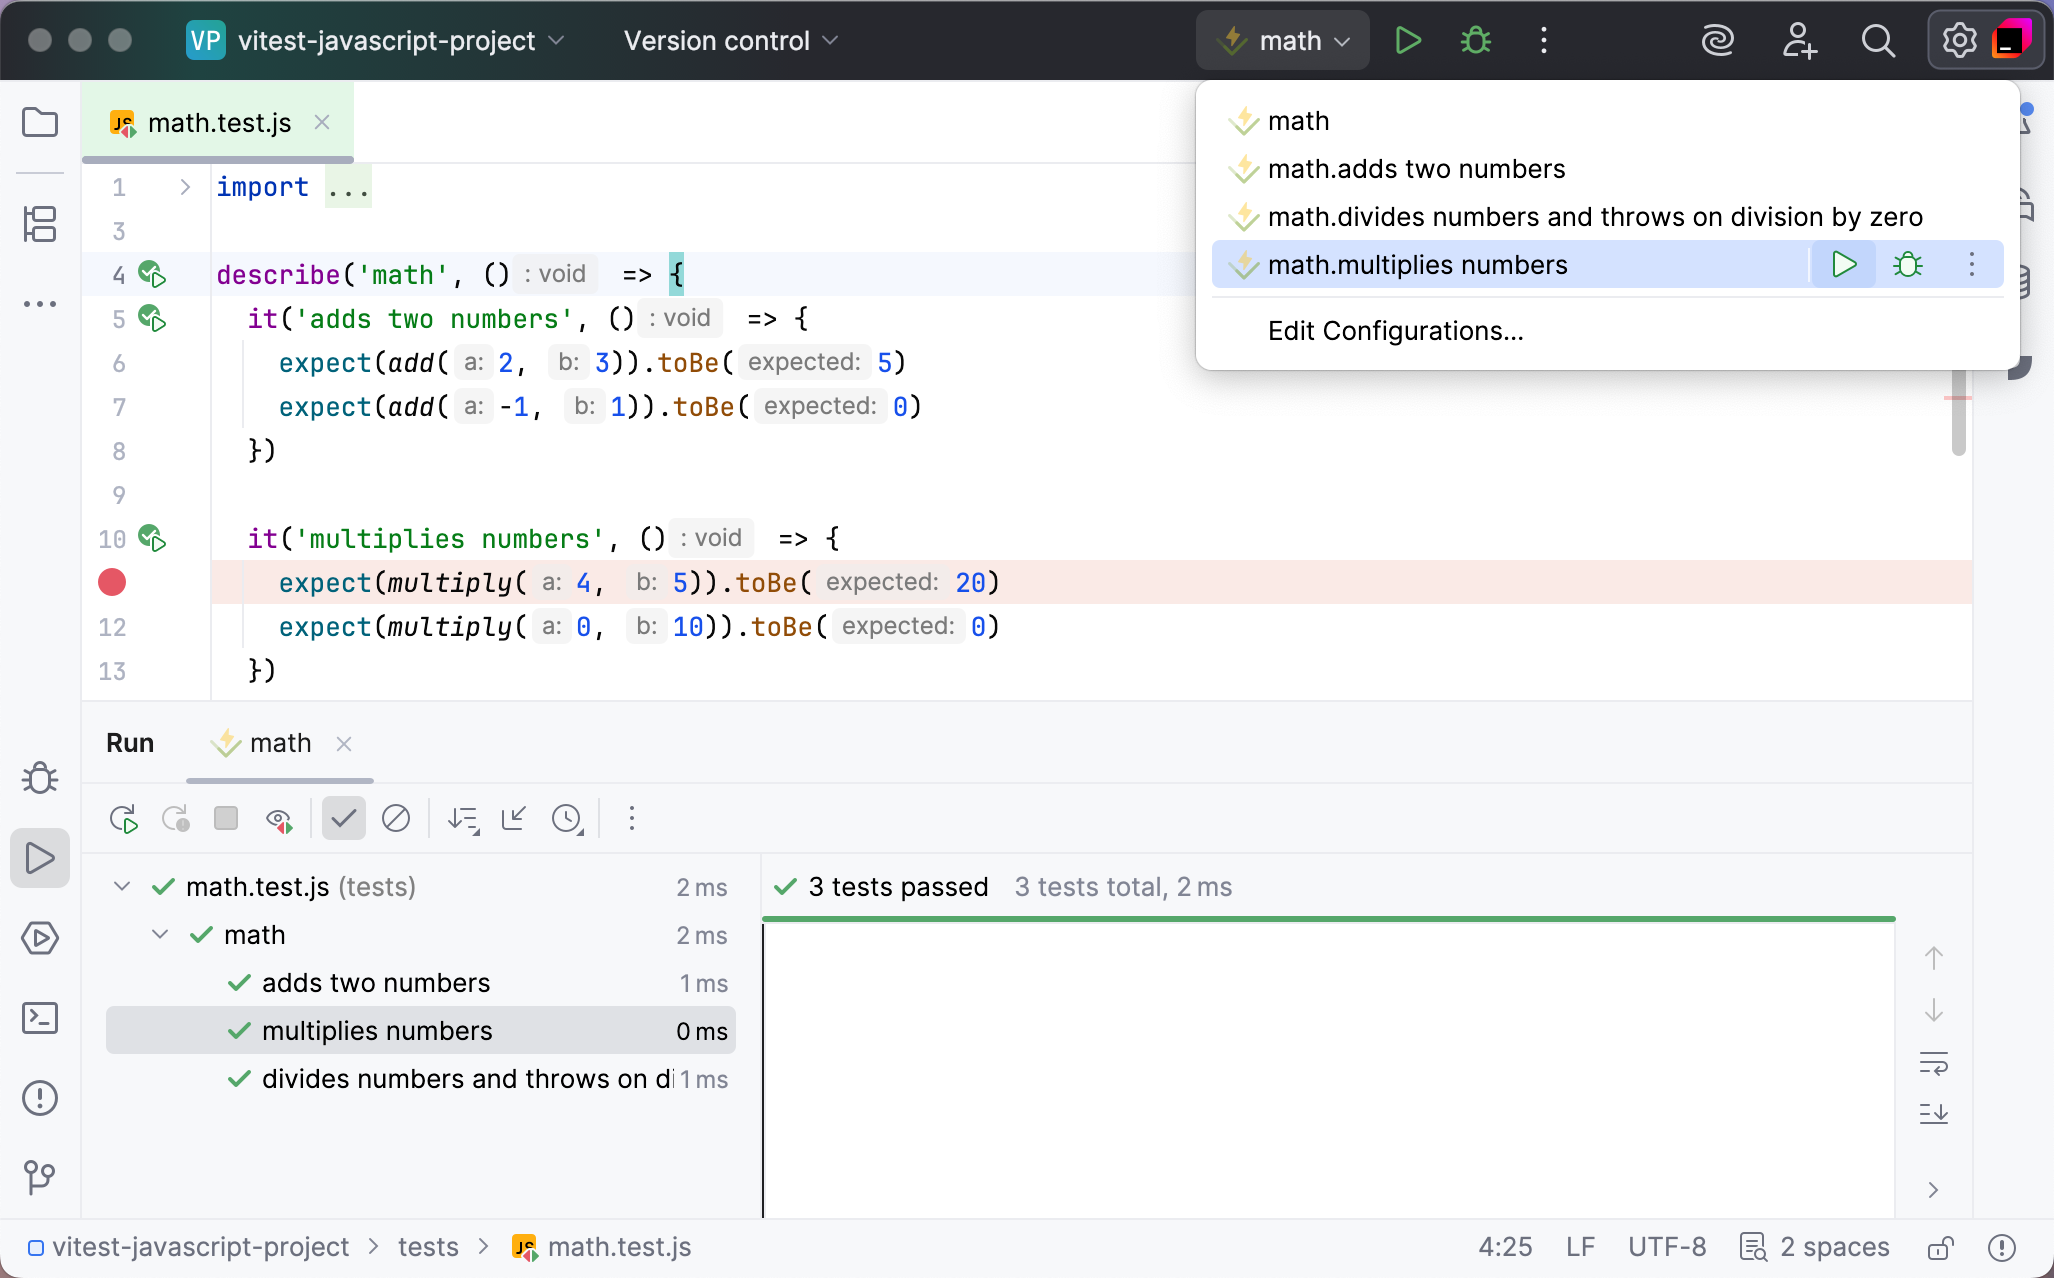
Select the Vitest run/debug configuration from the list of configurations and click
 in the list or on the toolbar.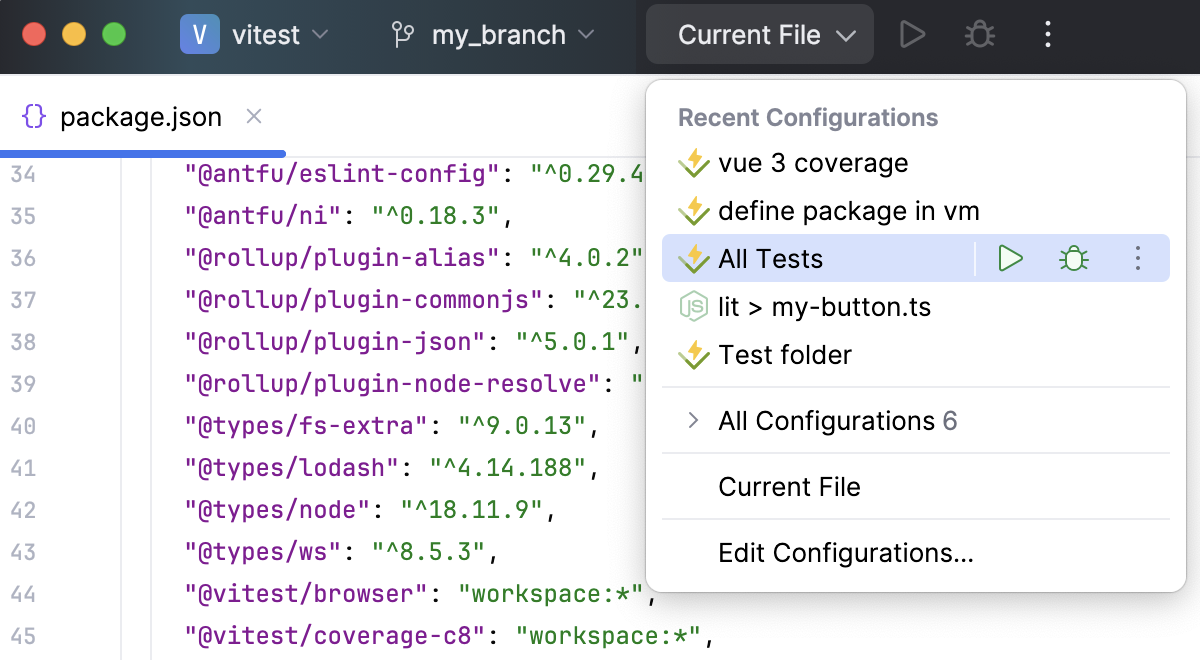
Monitor test execution and analyze test results in the Test Runner tab of the Run tool window. For more information, refer to Explore test results.
To debug tests, set breakpoints where necessary, select the run/debug configuration, and click
 .
.
Rerun tests
You can rerun all the tests in the specified scope Alt+Shift+R or rerun only the tests that failed.
You can also launch tests in the --watch mode. In this mode, WebStorm monitors saved changes to tests and related test subjects. As soon as a change is detected, WebStorm reruns the affected test without stopping the current test session.
Rerun failed tests
Click
 on the test results toolbar. WebStorm will execute all the tests that failed during the previous session.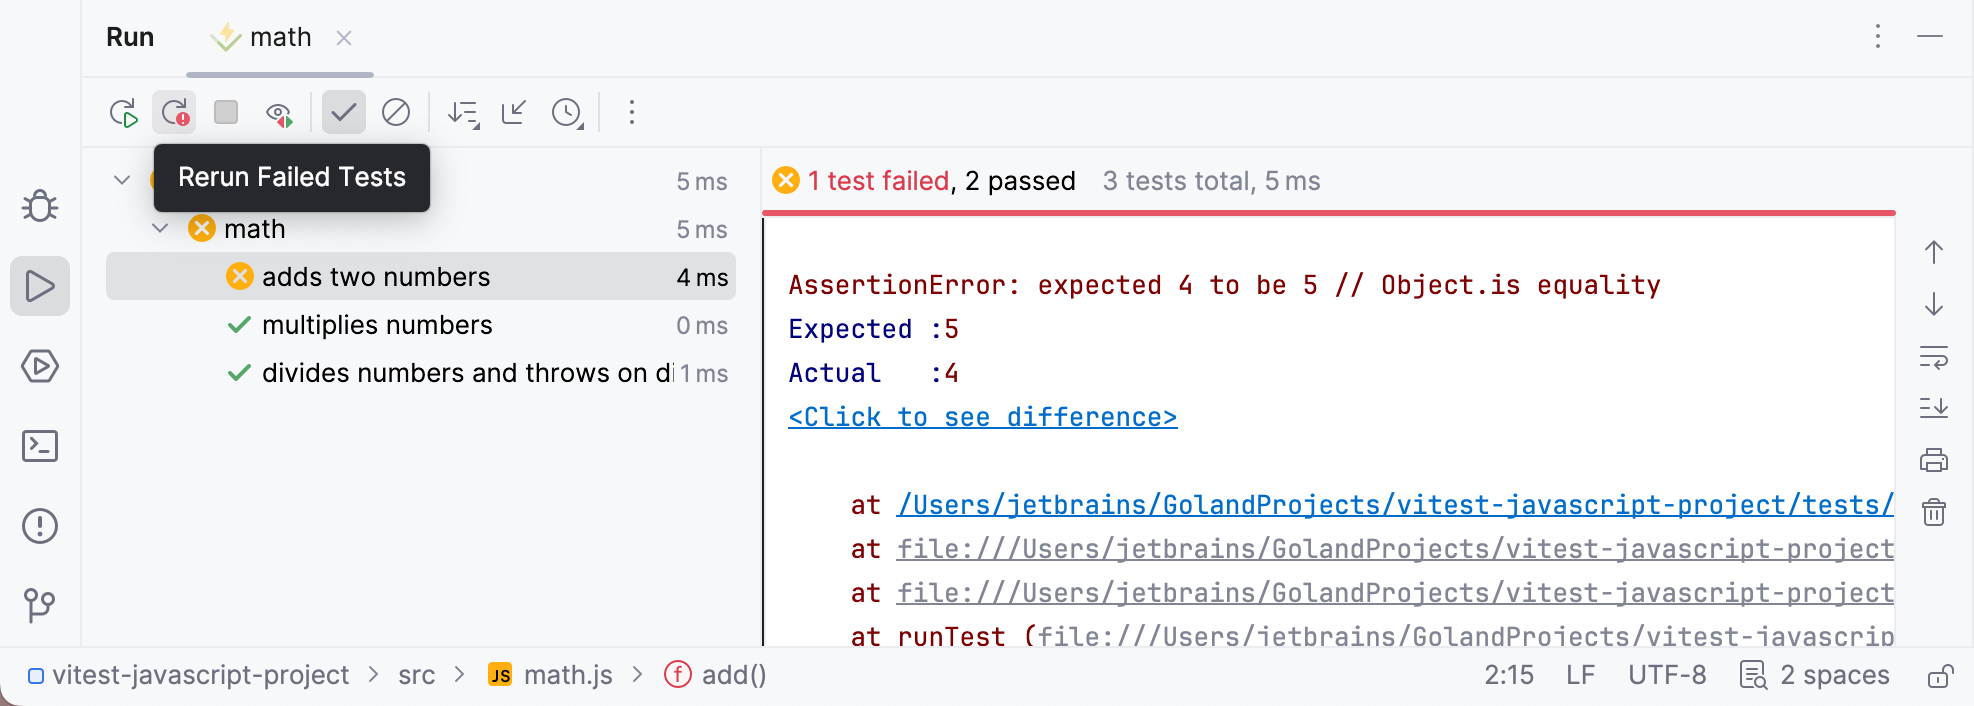
To rerun a specific failed test, select on its context menu.
For more information, refer to Rerunning tests.
Rerun updated tests automatically (--watch mode)
Open a Vitest run/debug configuration or create a new one as described above.
In the Vitest options field, type
--watch. In the autogenerated All tests configuration, the--watchoption is already specified.Launch the run/debug configuration. If some tests fail, you can update them or related test subjects without stopping the test session. As soon as your changes are saved, WebStorm detects them and reruns the affected tests.
In the example below, the test at line
29of vue.test.ts fails. With the--watchoption, the test is rerun after you replace'4 x 4 = 18'with'4 x 4 = 16'in vue.test.ts an save the changes with Ctrl+S or move the focus from WebStorm.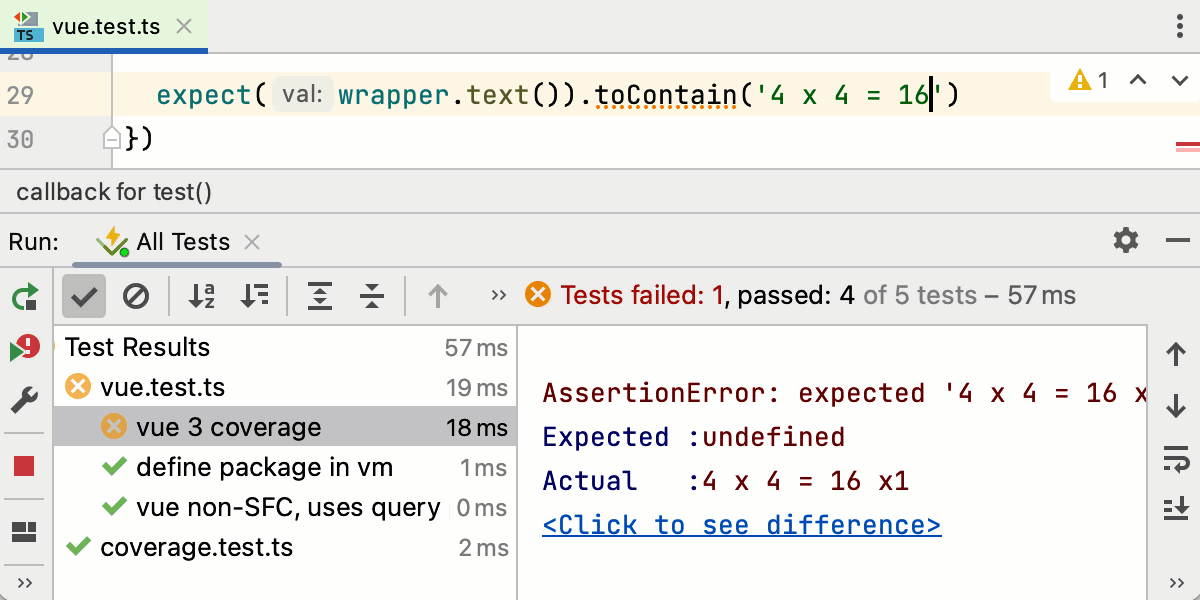
Snapshot testing
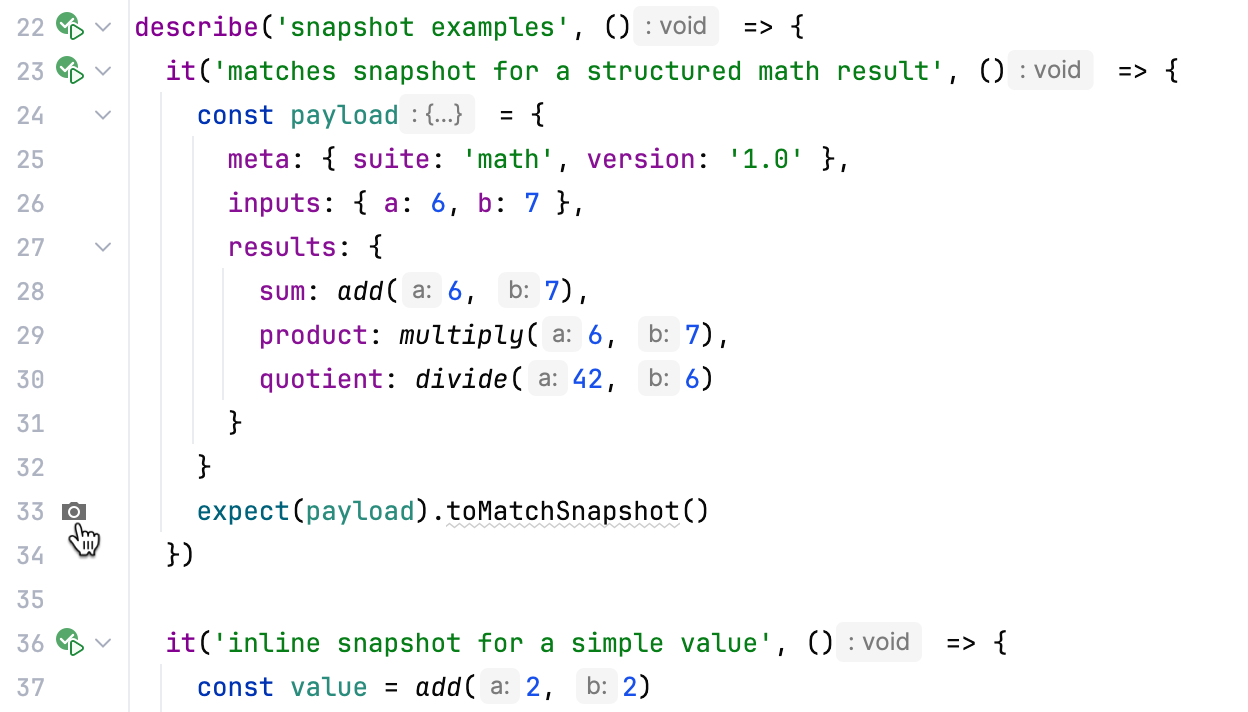
WebStorm also supports Vitest snapshot testing. When WebStorm runs a test with the toMatchSnapshot() method for the first time, a snapshot file is created and a  icon appears in the gutter next to
 toMatchSnapshot (). Click to open the generated snapshot.
Monitor code coverage
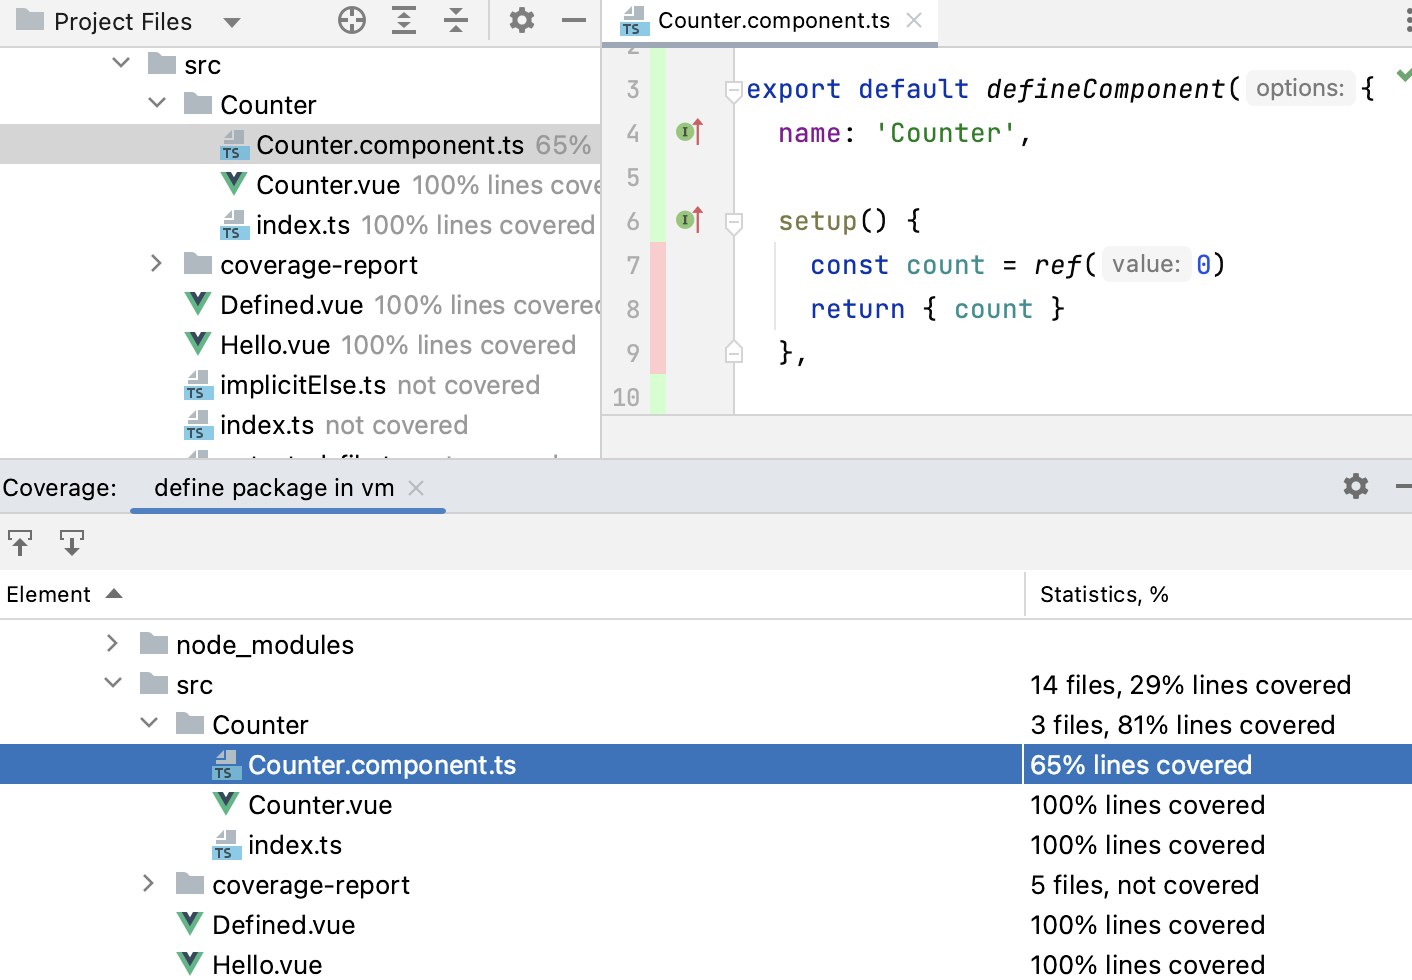
With WebStorm, you can also monitor how much of your code is covered with Vitest tests. WebStorm displays this statistics in a dedicated Coverage tool window and marks covered and uncovered lines visually in the editor and in the Project tool window (Alt+1) .
Enable code coverage for Vitest
Install @vitest/coverage-v8 or istanbul. To do that, open the built-in Terminal Alt+F12 and type one of the following:
npm install --save-dev @vitest/coverage-v8npm install --save-dev @vitest/coverage-istanbul.
Learn more from Coverage on the Vitest official website.
Run tests with coverage
Run a specific suite or a test with coverage from the editor: click
or in the gutter and select Run <test_name> with Coverage from the list.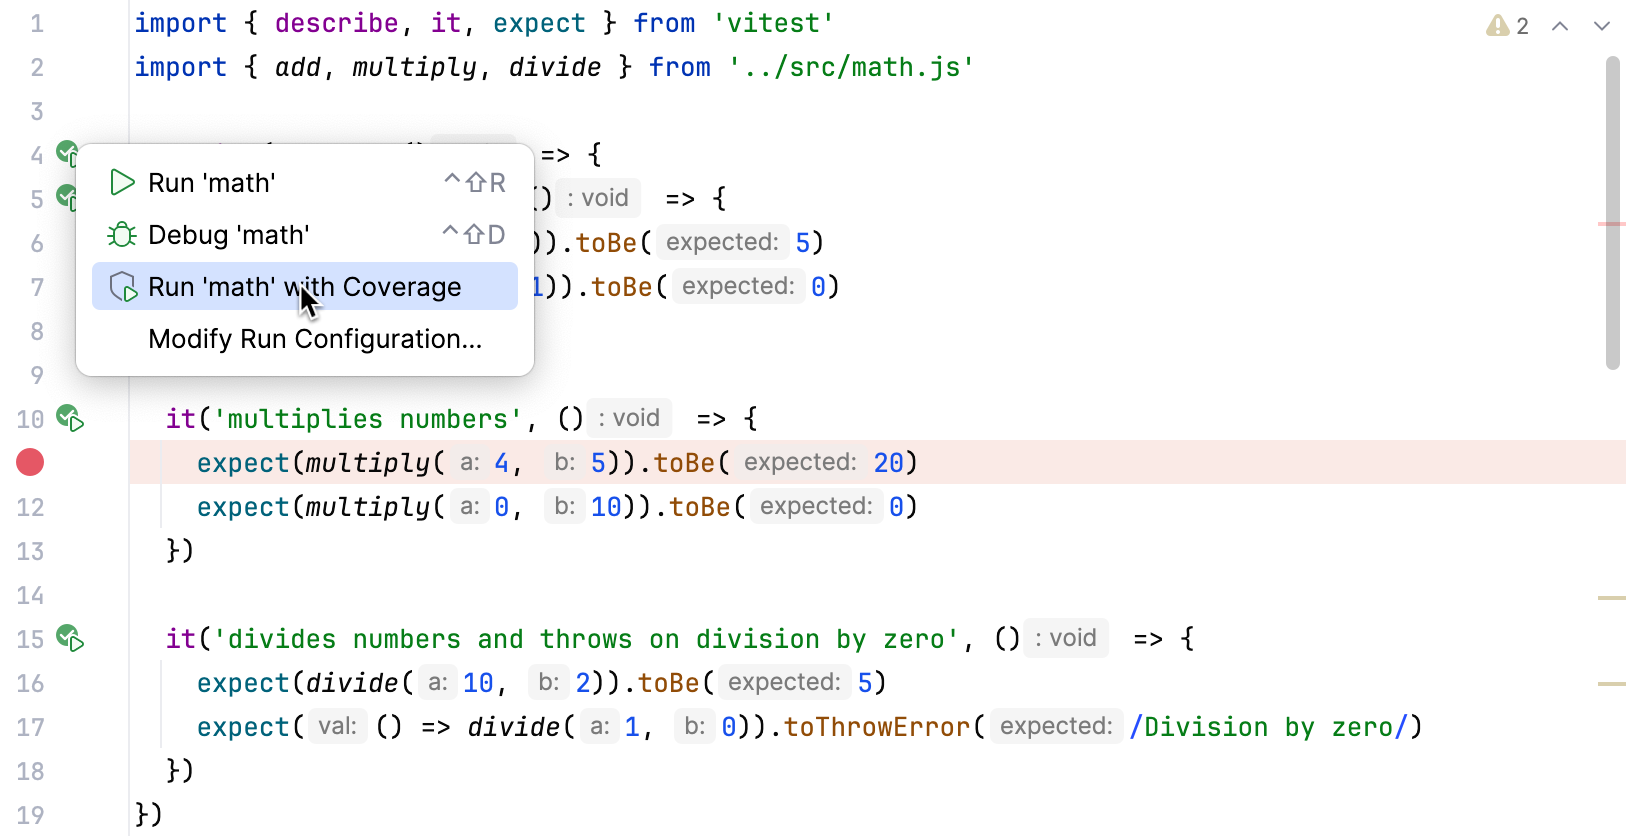
Alternatively:
Create a Vitest run/debug configuration as described above. Select the Vitest run/debug configuration from the list on the main toolbar and click
 to the right of the list.
Monitor the code coverage in the Coverage tool window. The report shows how many files were covered with tests and the percentage of covered lines in them. From the report you can jump to the file and see what lines were covered – marked green – and what lines were not covered – marked red:
Troubleshooting
Quick troubleshooting checklist
Open your command-line shell or the embedded Terminal (Alt+F12) and check whether
npm testornpx vitest runis executed successfully.In the Vitest run/debug configuration, make sure that the project root is specified in the Working directory field.
In case you use your custom Vitest configuration, make sure the path to the vitest .config.ts or vite.config.ts configuration file is specified correctly.
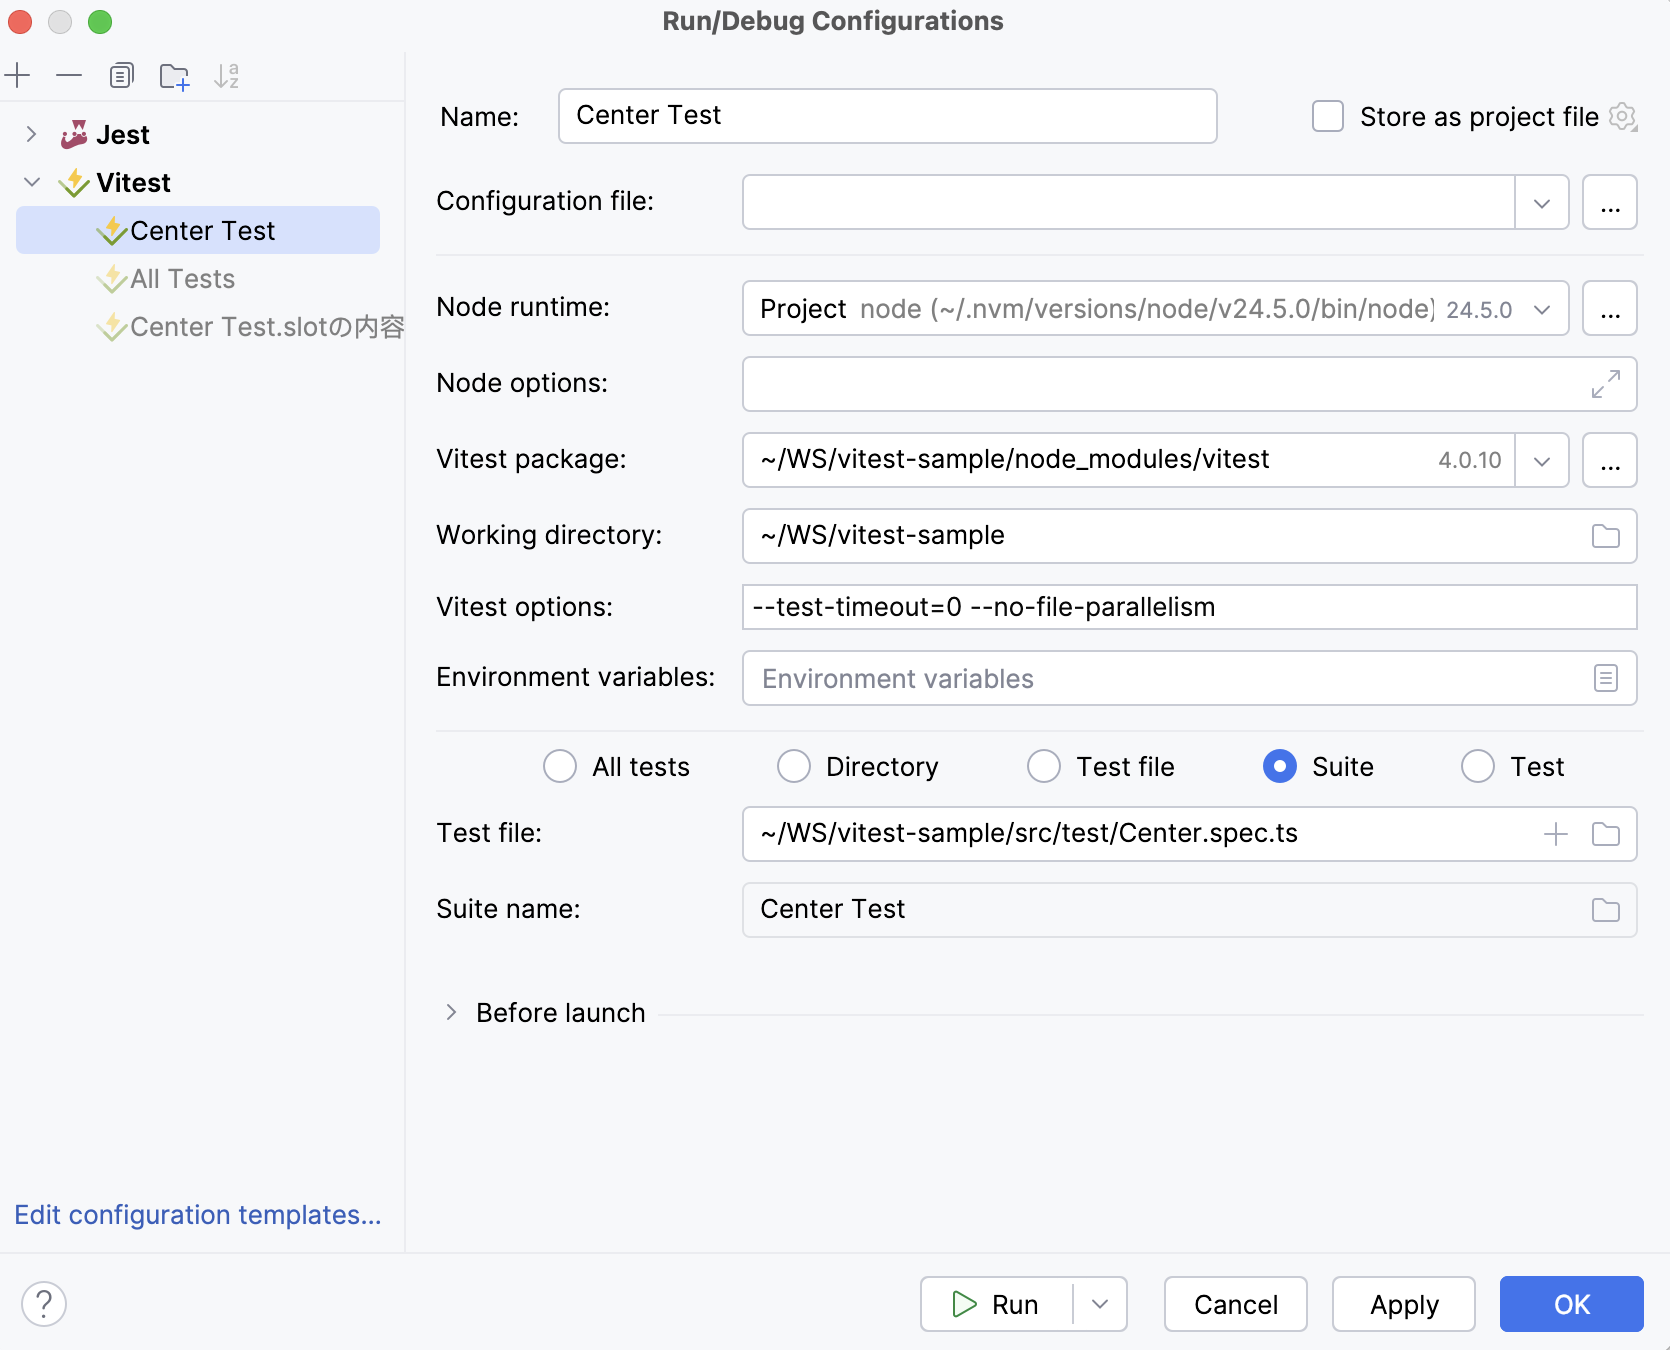
Check the command line options. For debugging, add
--test-timeout=0 --no-file-parallelismto the Vitest options field.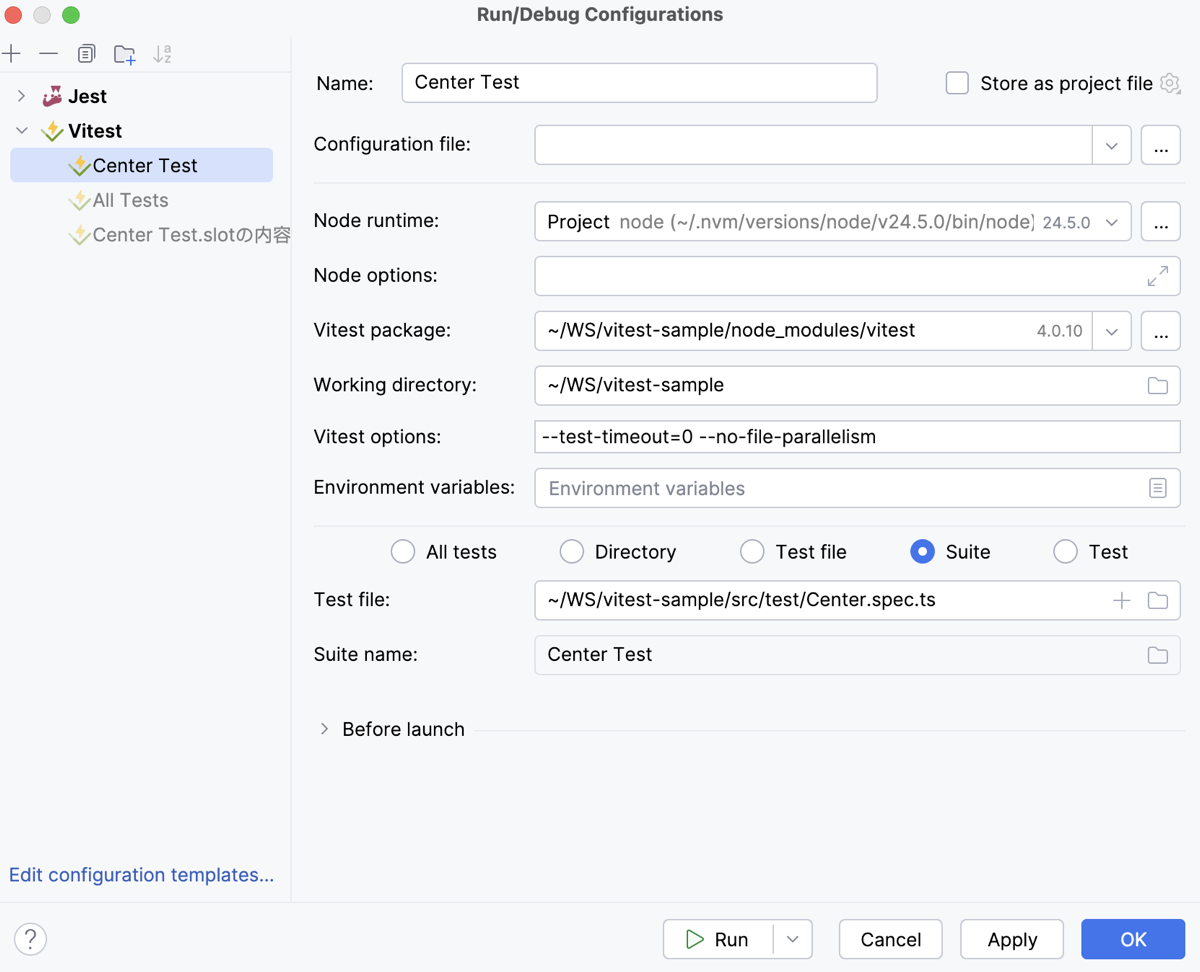
If you are using Docker or WSL, check path mappings and source maps.
For Docker debugging, the most common root cause is not Vitest itself, but the difference between the local environment and the environment in the container.
Below are the most frequent Vitest-in-WebStorm complaints.
WebStorm does not detect Vitest tests
Typical symptoms:
No
 gutter icons next to tests are displayed.
A
Test not founderror is shown.
Make sure you have installed Vitest in your project. Open your command-line shell or the embedded Terminal (Alt+F12) and type
npm vitest --v. The version of the currently installed Vitest should be displayed. If it is not, typenpm install --save-dev vitestto install Vitest in the current project.Make sure the names of your test files follow the Vitest naming convention.
Breakpoints are not hit
That may happen for the following reasons:
Source maps mismatch, which means that WebStorm is debugging generated JavaScript, but the source map points it to the wrong TypeScript/TSX source location.
Wrong working directory. As a result, Vitest may find a wrong package.json, fail to find the correct vitest.config.ts, or resolve aliases incorrectly.
Tests run in worker threads, so multiple test files can be run in parallel. That is good for speed, but may cause problems when debugging.
Docker/WSL path mismatch, which means that the debugger sees one file path, but WebStorm has the source code under another path.
Add the
--test-timeout=0and the--no-file-parallelismVitest debug-friendly flags to the Vitest options field of the Vitest run/debug configuration.This helps avoid timeouts and parallel test execution issues, learn more from the Vitest official website.
Press Ctrl+Alt+S to open settings and then select . Then check your Docker/WSL mappings and compare them with the path mappings in the run/debug configuration.
Tests pass in the command-line shell but fail when launched via the WebStorm UI
This may happen because the test environment in WebStorm differs from the one in your command-line shell. WebStorm may start Vitest with different settings, causing the tests to behave differently.
Open the Vitest run/debug configuration.
Verify that the specified version of the Node.js runtime is the same as the one used from the command line.
Make sure that the working directory is the same as the one used from the command line.
Compare environment variables, if any.
Ensure that the same Vitest configuration and Vitest options are used.
Run the tests without debugging from WebStorm. If they pass, the issue is most likely related to the debugger.
If you are going to debug your tests, temporarily disable parallel execution by adding the following in the Vitest options field:
--test-timeout=0--no-file-parallelismIf using Docker or WSL, verify that WebStorm path mappings match the Docker or WSL paths.
Path aliases fail
A test file that has an import statement in the format import { foo } from '@/foo' fails.
Check that aliases are configured consistently in the following configuration files:
tsconfig.json
vite.config.ts
vitest.config.ts
Try placing test config in vite.config.ts or vitest.config.ts. This may help because Vitest reads Vite config by default.
DOM APIs are missing
Examples of errors:
documentis not definedwindowis not definedHTMLElementis not defined
Use a browser-like test environment.
Install
jsdome. To do that, open your command-line shell or the embedded Terminal (Alt+F12) and type:npm install --d jsdomOpen the vitest.config.ts configuration file and add the following code in it:
import { defineConfig } from 'vitest/config' export default defineConfig({ test: { environment: 'jsdom' } })
Environment variables are missing
Make sure frontend-style environment variables have the VITE_ prefix, for example:
Also in your code:
The watch mode behaves unexpectedly
Watching files can be tricky with Docker, WSL, or mounted volumes.
In your command-line shell or in the embedded Terminal (Alt+F12) , type vitest run.
If the command is executed successfully, the issue is probably in the watch mode or in file system notifications.