What’s New in IntelliJ IDEA 2026.1
Welcome to the IntelliJ IDEA 2026.1 release overview. This version brings built-in support for more AI agents, including Codex, Cursor, and any ACP-compatible agent, and delivers targeted, first-class improvements for Java, Kotlin, and Spring. The release also advances IntelliJ IDEA’s mission to provide support for the latest languages and tools from day one.
Any agent, built-in:
- ACP Registry: Browse and install AI agents in one click.
- Git worktrees: Work in parallel branches and hand one off to an agent while you keep moving in another.
- Database access for AI agents: Let Codex or Claude Agent query and modify your data sources natively.
Intelligence in the platform:
- Quota-free next edit suggestions: Propagate changes throughout a given file with IDE-driven assistance.
- Spring runtime insight: Inspect injected beans, endpoint security, and property values without pausing execution.
- Kotlin-aware JPA: Detect and fix Kotlin-specific pitfalls in Jakarta Persistence entities.
First-class language support:
- Java 26: Enjoy day-one support, including preview features.
- Kotlin 2.3.20: Enjoy day-one support, including experimental features.
- C/C++ in IntelliJ IDEA: Access first-class C/C++ coding assistance for multi-language projects.
- Support for JavaScript without an Ultimate subscription.
Productivity and environment:
- Expanded command completion, now with AI actions, postfix templates, and config file support.
- Better performance for large-scale TypeScript projects.
- Native Dev Container workflow: Open containerized projects as if they were local.
Along with new features, 2026.1 delivers numerous stability, performance, and usability improvements across the platform. These are described in a separate What’s Fixed blog post.
AI
IntelliJ IDEA is evolving as an open platform that allows you to bring the AI tools of your choice into your professional development workflows.
In addition to Junie and Claude Agent, you can now choose more agents in the AI chat, including Codex. Also, Cursor and GitHub Copilot, along with dozens of external agents, are now supported via the Agent Client Protocol. With the new ACP Registry, you can discover available agents and install them in just one click.
Next edit suggestions are now available without consuming the AI quota of your JetBrains AI Pro subscription. These suggestions go beyond traditional code completion for Java, Kotlin, and now Scala. Instead of updating only what’s at your cursor, they intelligently apply related changes across the entire file, helping you keep your code consistent and up to date with minimal effort.
This natural evolution of code completion delivers a seamless Tab Tab experience that keeps you in the flow.
JVM language support
Java 26
IntelliJ IDEA continues to provide support for the latest Java releases from day one, as well as early support for upcoming Java releases, for example, by allowing you to install early access builds directly from the IDE.
Unlike Java 25, Java 26 doesn’t introduce any new stable language features, but it does bring previews for pattern matching and lazy constants, which are already supported in IntelliJ IDEA. Learn more.
Improvements for Kotlin development with JPA
The combination of Kotlin and Jakarta Persistence is popular for server-side development, but since Jakarta Persistence was originally designed for Java, some Kotlin features – like null safety, as well as val and data class semantics – can behave unexpectedly in entities. IntelliJ IDEA 2026.1 addresses these pitfalls with more Kotlin-aware JPA support. Here are a few examples of what you’ll get with the new release:
-
Autoconfiguration of Kotlin
no-argandall-opencompiler plugins when adding Kotlin to an existing project. -
Removal of redundant
no-argconstructions and open modifiers. -
Detection and quick-fixes for the pitfalls, like using data classes and
valfields on JPA entities and others.
Read more about these pitfalls in this blog post.

Kotlin 2.3.20 support
IntelliJ IDEA 2026.1 has improved support for the latest language features in Kotlin 2.3.0, as well as those in 2.3.20. The new versions promote nested type aliases and data-flow exhaustiveness checks for when expressions to stable, and also bring several experimental features that you can already try in IntelliJ IDEA:
- Name-based destructuring destructures by property name rather than position, so changing the order of properties doesn’t break the code (version 2.3.20).
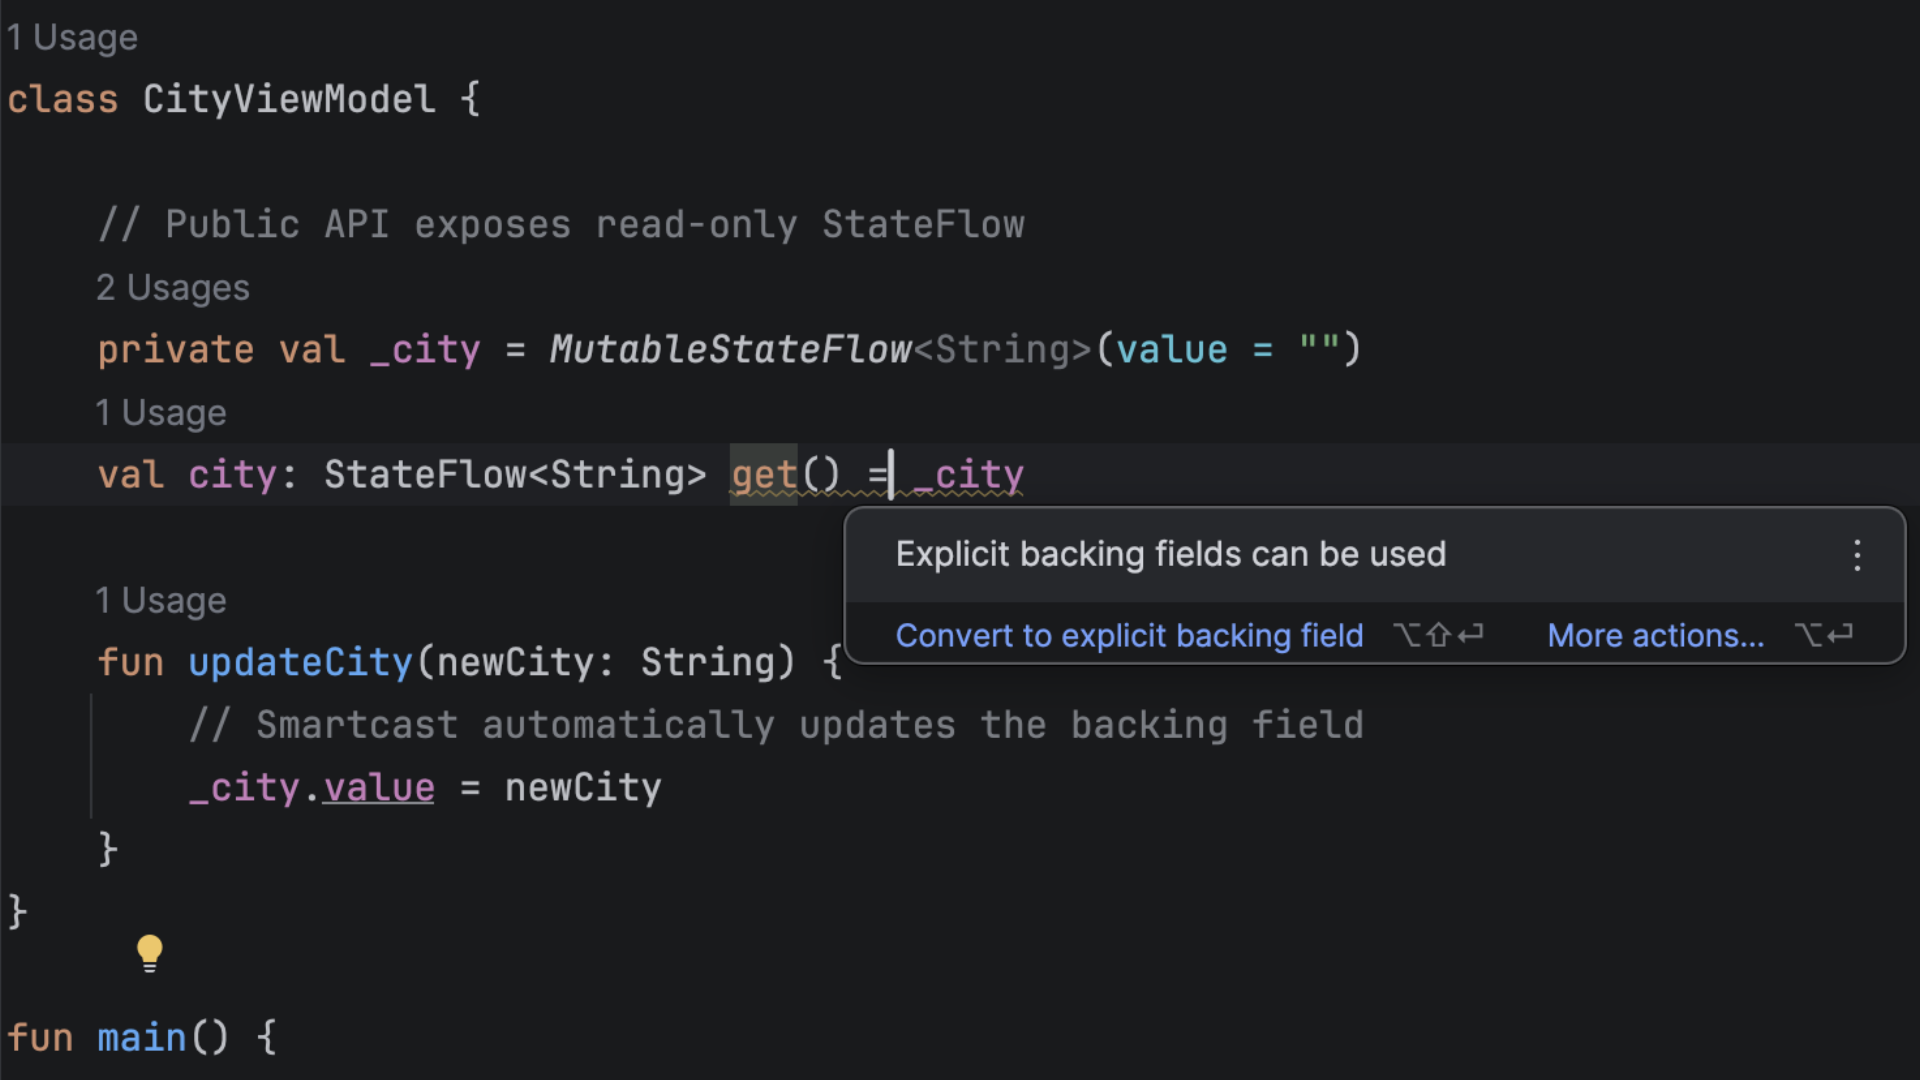
- Explicit backing fields cut boilerplate when you want a property that’s writable internally but read-only to callers (version 2.3.0).
- The unused return value checker warns you when you call something that returns a meaningful result and that result is silently ignored, helping you catch bugs (version 2.3.0).
Scala
This release brings full Scaladoc support for Scala 3, which means you can now use modern Markdown syntax directly in your doc comments.
Additionally, working with sbt projects inside WSL and Docker containers is now as smooth as working in local projects. We’ve also made various performance improvements to highlighting and sped up sbt project synchronization.
You can read more about these updates here.
Spring Ultimate
Runtime insight for Spring applications
Spring Debugger now allows you to see the state of your Spring application directly in your code, without pausing its execution. This means no more guessing and no more jumping to the project tree to understand wiring, profile configuration, and the environment. You can detect wrong bean injections, test secured endpoints, and review the application configuration in the running code, saving you time and money on static code analysis.
- Injected beans in code: See the exact bean class that is injected into your Spring component – the bean’s definition, related beans, and navigation to the bean definition class or factory method are now just one-click away.
- Endpoint security inlays [coming 2026.1.X]: See how each Spring MVC endpoint is secured and which rules are in effect and where they come from, view the current user context, and temporarily unlock an endpoint while debugging to verify behavior without editing the configuration – right from the HTTP Client!
-
Actual property values [coming 2026.1.X]: View the actual property value used at runtime in the
@Valueannotation, so you can spot overrides from the environment, run config, or config server faster.
Sources and documentation for dependencies out of the box
With more and more code being generated, review and debugging are becoming even more important for maintaining high-quality code. This is where having local access to sources and documentation for the dependencies used in your project becomes especially helpful.
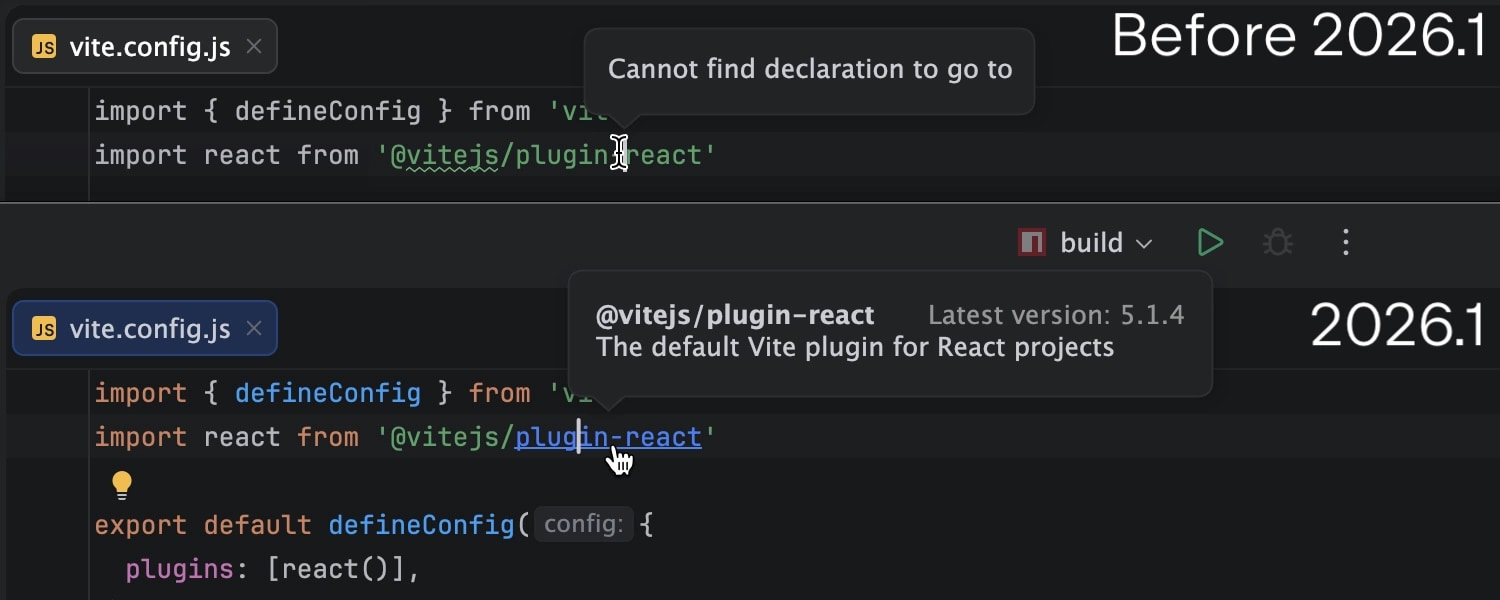
Starting with 2026.1, sources for all your dependencies are automatically downloaded in a non-intrusive manner. Now, you have the full context needed to inspect, debug, and navigate dependency code with ease.
C/C++ support in IntelliJ IDEA Ultimate
When working with Java, you sometimes need to benefit from the performance of C++ in individual cases, like optimized microservices or native libraries. New C++ plugins for IntelliJ IDEA allow you to stay in your flow without switching tools.
The CLion C and C++ plugin provides first-class coding assistance for modern C and C++ development in IntelliJ IDEA. It equips you with advanced code insight, real-time quality checks, and powerful refactorings to ensure your native code is as maintainable and high-quality as your JVM projects.
To enable this support, install the CLion C and C++ plugin and check that the Native Build Tools plugin has been automatically installed. This serves as the core infrastructure, connecting your projects to essential toolchains, debuggers, build systems such as CMake (installed separately) and Meson, the compilation database, vcpkg, and test framework plugins.
Productivity-enhancing features
Expanded Java and Kotlin support for command completion ..
Based on the positive feedback and adoption we’ve seen so far, we are continuing to expand command completion to support more Java and Kotlin workflows:
- New AI-powered actions are available via command completion. You can quickly ask the IDE to explain code, generate documentation, or make code changes directly through an integrated prompt dialog – all in context, without leaving the editor.
-
All postfix templates can now be discovered and invoked via
.., making it easier to use both mechanisms together in a single, consistent flow. -
Command completion is now also available in configuration
.propertiesfiles. This improves productivity in framework-based projects where configuration and code are closely connected.
Gradle best practices for humans and agents
Gradle offers multiple ways to configure builds, and not all of them are optimal. This might lead to confusion both for developers and AI agents.
To provide guidance, JetBrains joined forces with Gradle and Google to create a set of official best practices, covering the complex options for users and helping AI agents improve as well. New practices are authored regularly, and over 30 have already been published.
To make this resource even more accessible, IntelliJ IDEA 2026.1 brings the first batch directly to your fingertips as inspections and quick-fixes, with more to come.
Editor caret and selection updates
We’re continuing to modernize our IDEs, and in this update, we’ve refreshed something you interact with constantly – the editor. Smooth caret animation and updated selection behavior provide improved comfort, a cleaner look, and a more enjoyable coding experience. Read more.
Ability to work on multiple branches at once with Git worktrees
With the evolution of AI agents, running multiple tasks in parallel has become a major time-saver, and this is precisely where Git worktrees are extremely handy. To support cutting-edge workflows for AI-boosted software development, IntelliJ IDEA now provides first-class support for Git worktrees. Create a separate worktree for an urgent hotfix, hand off another one to an AI agent, and keep working in your main branch – all at the same time, without interruption.
Even if you don’t use agents, worktrees will save you time on branch switching, especially in big projects.
Native Wayland support
IntelliJ-based IDEs now run natively on Wayland by default. This transition provides Linux professionals with ultimate comfort through sharper HiDPI and better input handling, and it paves the way for future enhancements like Vulkan support.
While Wayland provides benefits and serves as a foundation for future improvements, we prioritize reliability: The IDE will automatically fall back to X11 in unsupported environments to keep your workflow uninterrupted. Learn more.
In-terminal completion
Stop memorizing commands. Start discovering them. In-terminal completion helps you instantly explore available subcommands and parameters as you type. Whether you're working with complex CLI tools like Git, Docker, or kubectl or using your own custom scripts, this feature intelligently suggests valid options in real time.
Previously introduced for Bash and Zsh shells, it is now also available in PowerShell.
Ability to work with projects from Dev Containers as with local ones Ultimate
Modern software development increasingly relies on Dev Containers for defining consistent, professional-grade environments. While IntelliJ IDEA has long supported these via Remote Development mode, a more streamlined approach is now available to keep you in the flow.
Starting with IntelliJ IDEA 2026.1, you can open projects from a Dev Container natively in your local IDE. Unlike previous methods that required a full IDE backend inside the Dev Container, this new agent-based architecture provides a high-performance connection to the file system without draining system resources. This reduces cognitive load and setup time, ensuring you stay focused on your most important tasks.
Databases
The AI chat integration for Codex and Claude Agent now offers full, native support for your connected databases. With that, you can now query, analyze, and modify your database state using natural language right from the IDE.
The same functionality is available for external agents via an MCP server.
Data source settings can now be stored in your JetBrains Account via data source templates. Especially nifty for All Products Pack users or anyone who uses multiple instances of JetBrains IDEs, this upgrade allows you to access data source templates and settings in every JetBrains IDE with database functionality.
Support for Terraform Stacks Ultimate
You can now manage your Terraform infrastructure with more clarity and control by working with Terraform Stacks directly in the IDE. Benefit from code completion, get a better understanding of the structure, create new components and deployments, and jump between them with ease. Stay oriented in complex infrastructure setups.
Streamlined Kubernetes experience Ultimate
Working with Kubernetes in IntelliJ IDEA is now more straightforward than ever before. We created a dedicated welcome screen that guides you to get the most out of your cluster workflow. You can study features, connect to clusters, select context with ease, apply configs, view the resource tree, examine logs, and debug – all without leaving your IDE.
JavaScript and TypeScript
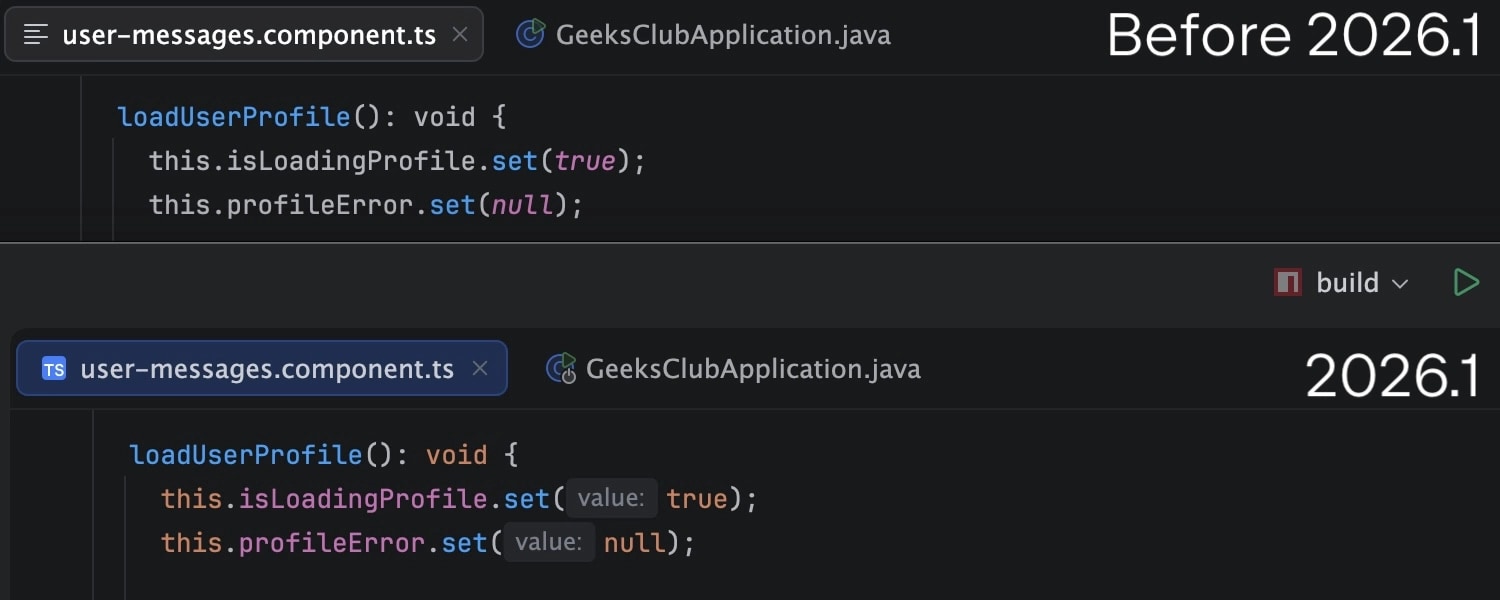
Experience a smoother, more reliable workflow with TypeScript support now running on the service-powered type engine by default. Optimized for professional-grade development, this update delivers more accurate type inference and significantly lower CPU usage, even in large-scale enterprise projects. The TypeScript support is further improved with better auto-import handling for path aliases and project references, as well as the integration of inlay hints from the Go-based TypeScript language server. JavaScript parsing now also correctly handles string-literal import / export specifiers.
IntelliJ IDEA keeps you at the cutting edge of the web ecosystem with refined support for your favorite frameworks:
-
The IDE now highlights React’s new
use memoanduse no memodirectives. -
The Vue integration uses the updated 3.1.8 version of
@vue/typescript-plugin. - Astro settings accept JSON-based configuration for language server integration.
- Angular 21.x template syntax is supported.


Support for JavaScript and TypeScript without an Ultimate subscription
With the unified IntelliJ IDEA, we are striving to provide the best experience for every Java and Kotlin developer. Frontend development is a must for most projects, with JavaScript being the default choice.
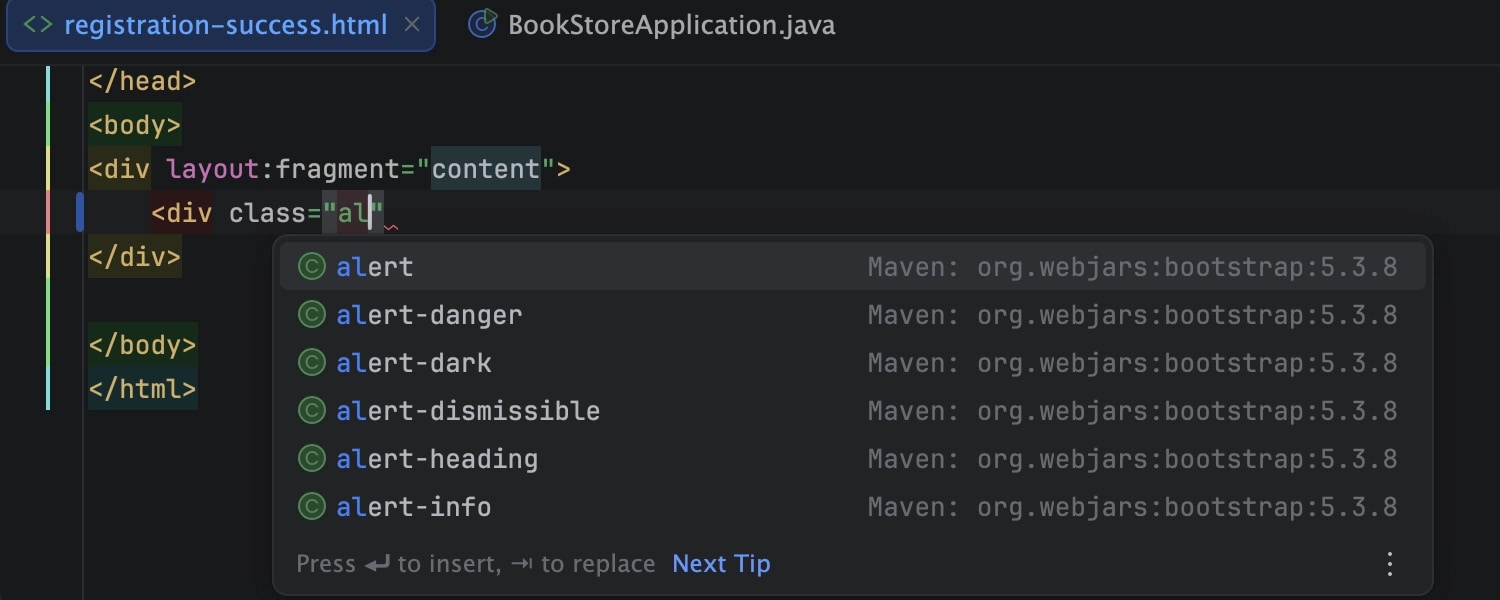
In version 2026.1, IntelliJ IDEA provides support for JavaScript without requiring an Ultimate subscription, though you will still need one to use advanced productivity features for JavaScript. Learn more.
Stay tuned
You can learn more about IntelliJ IDEA 2026.1’s improvements to stability, performance, and the user experience in the dedicated What’s Fixed blog post.
Let us know what you think about the new features in this release, as your feedback helps us shape the product so it works even better for you.
Update to IntelliJ IDEA 2026.1 now to try out these new features. Don't forget to join us on X, Bluesky, or LinkedIn, and be sure to share your favorite updates.
Thank you for using IntelliJ IDEA!