What's New in Rider 2026.1
Rider 2026.1 brings improved support for the .NET ecosystem and game development workflows, as well as refinements to the overall developer experience. Highlights of this release include:
Any agent, built-in
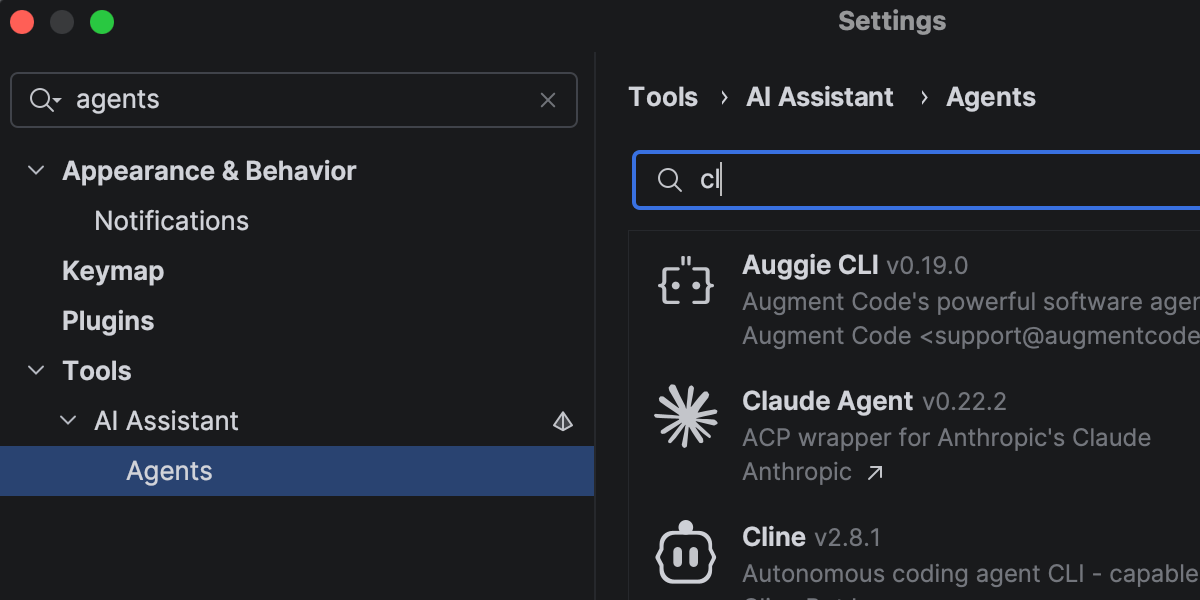
- ACP Registry: Browse and install AI agents in one click.
- Git worktrees: Work in parallel branches and hand one off to an agent while you keep moving in another.
The latest language support
- C# 14 newness, C# 15 Preview features, and more
.NET support and productivity improvements
- Support for file-based C# programs
- NuGet Package Manager Console Preview
- Viewer for .NET disassemblies
Game development improvements
- Complete mobile development support for Unreal Engine on Android and iOS
- CMake support for C++ gaming projects Beta
- Redesigned Unity Profiler integration
- Enhanced Godot editor integration
AI
Rider is continuing to evolve as an open platform that allows you to bring your preferred AI tools into your professional development workflows.
In addition to Junie, Claude Agent, and Codex in the AI chat, you can now choose from a wider range of agents, including GitHub Copilot and Cursor, and dozens of external agents supported via the Agent Client Protocol. With the new ACP Registry, you can discover available agents and install them in just one click.
More improvements for working with AI agents in Rider here.
Faster solution loading and code completion
Rider 2026.1 improves performance in areas you notice during everyday work.
Opening solutions and attaching to running processes is now faster thanks to more efficient indexing of the referenced assemblies. Code completion is also more responsive, particularly for import suggestions, helping you stay in flow with fewer interruptions.
Code analysis has also been optimized, contributing to lower overall IDE overhead.
The latest language support
C#
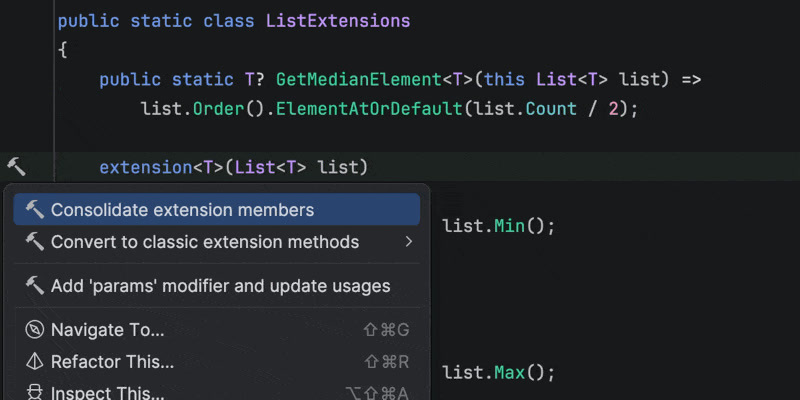
Rider 2026.1 brings improvements to code analysis, new inspections, and support for evolving language features. Enhanced support for C# extension members includes better navigation and refactorings, as well as improved quick-fixes that automatically import missing extension members when needed.
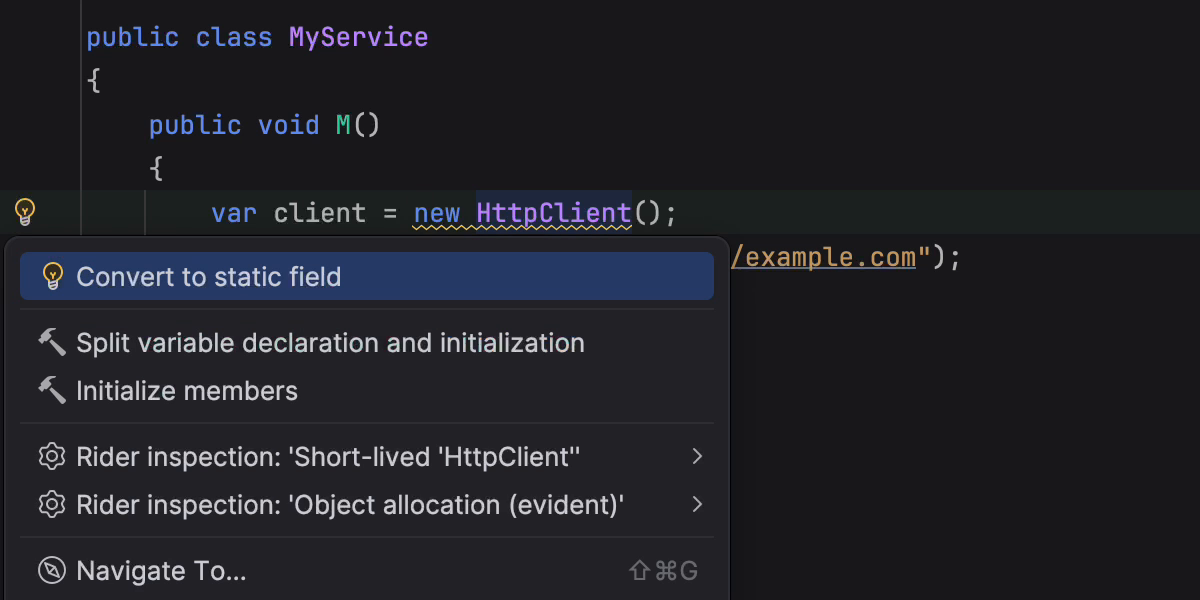
This release also introduces early support for C# 15 Preview language features, such as collection expression arguments and the [ExtendedLayout] attribute, helping you experiment with new syntax as the language evolves. In addition, several new inspections and style options help catch subtle issues, such as short-lived HttpClient instances or incorrect use of ImmutableArray<T> with collection initializers.
Rider’s C# code intelligence is powered by ReSharper. If you want to dive deeper into C# language updates, we describe them in detail on the What’s New in ReSharper 2026.1 page.
Improved debugging for F#
Rider's new Smart Step Into for F# support makes it easier for you to choose your step target. The debugger can also display return values for function calls, helping you understand program flow without adding extra logging. Stepping has been improved for async and task expressions, and multiple issues affecting F# debugging have been fixed.
For the full list of changes and fixes, see the F# plugin release notes.
.NET support and productivity improvements
Support for file-based C# programs
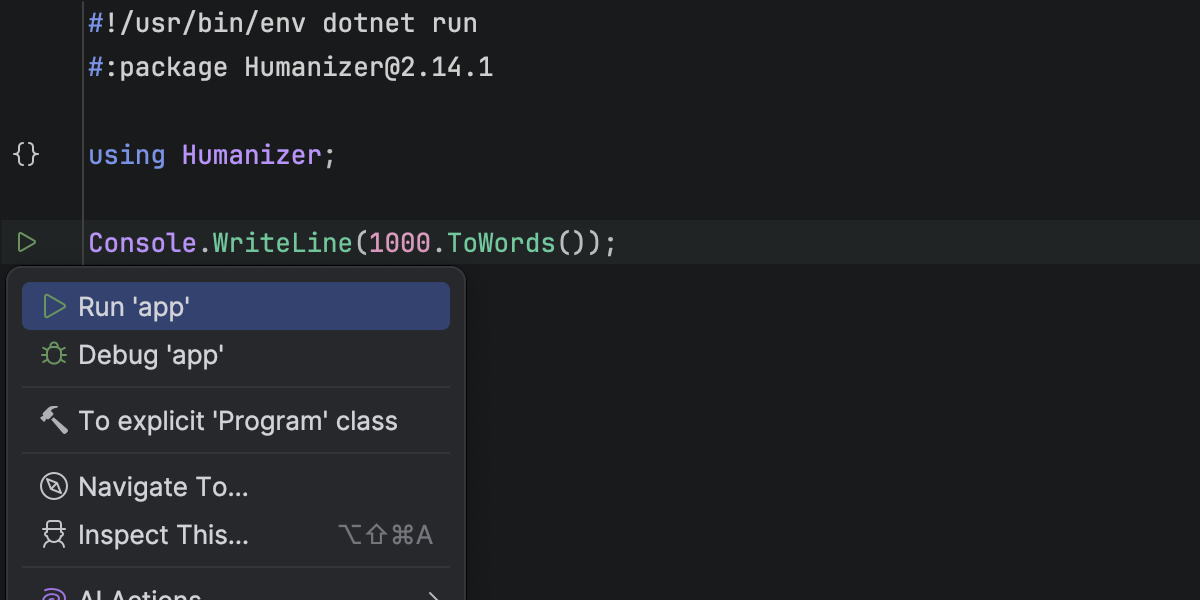
Rider now supports working with single-file C# programs that can be run using dotnet run file.cs. You can open and run a standalone .cs file directly from the IDE, without requiring a .csproj.
Rider's editor recognizes file-based programs with top-level statements, #! shebangs, and #: directives, including #:package and #:sdk. Code highlighting, code completion, run markers, and debugging are all available, allowing you to create quick scripts, prototypes, and one-off tools written as a single C# file.
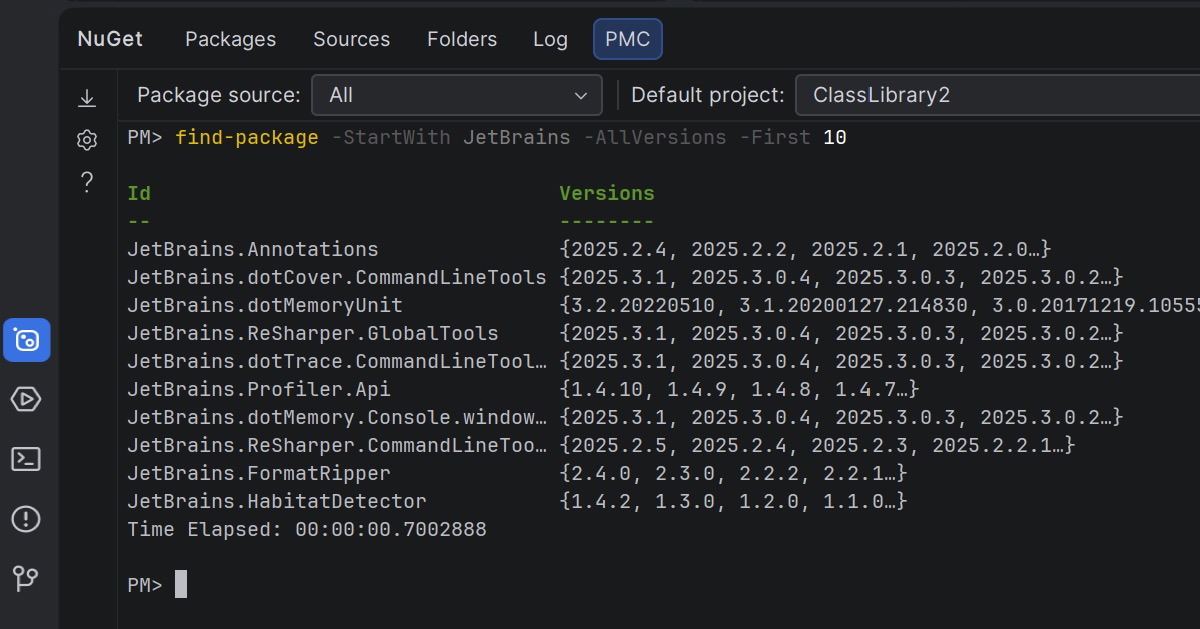
NuGet Package Manager Console Preview
Rider 2026.1 brings NuGet’s PowerShell-based workflow into the IDE, offering a Package Manager Console (PMC) that’s currently in preview.
The new console supports standard NuGet PowerShell commands, as well as commands provided by NuGet packages themselves. Entity Framework Core PowerShell commands are fully supported, allowing you to take advantage of familiar EF Core workflows without leaving Rider.
You can run NuGet and Entity Framework Core commands either from the NuGet tool window or directly in the terminal. In the NuGet tool window, you can select the package source and default project using UI controls. In the terminal-based console, this context is displayed in the PowerShell prompt and can be changed using PowerShell commands.
Let us know what you think about this feature here.
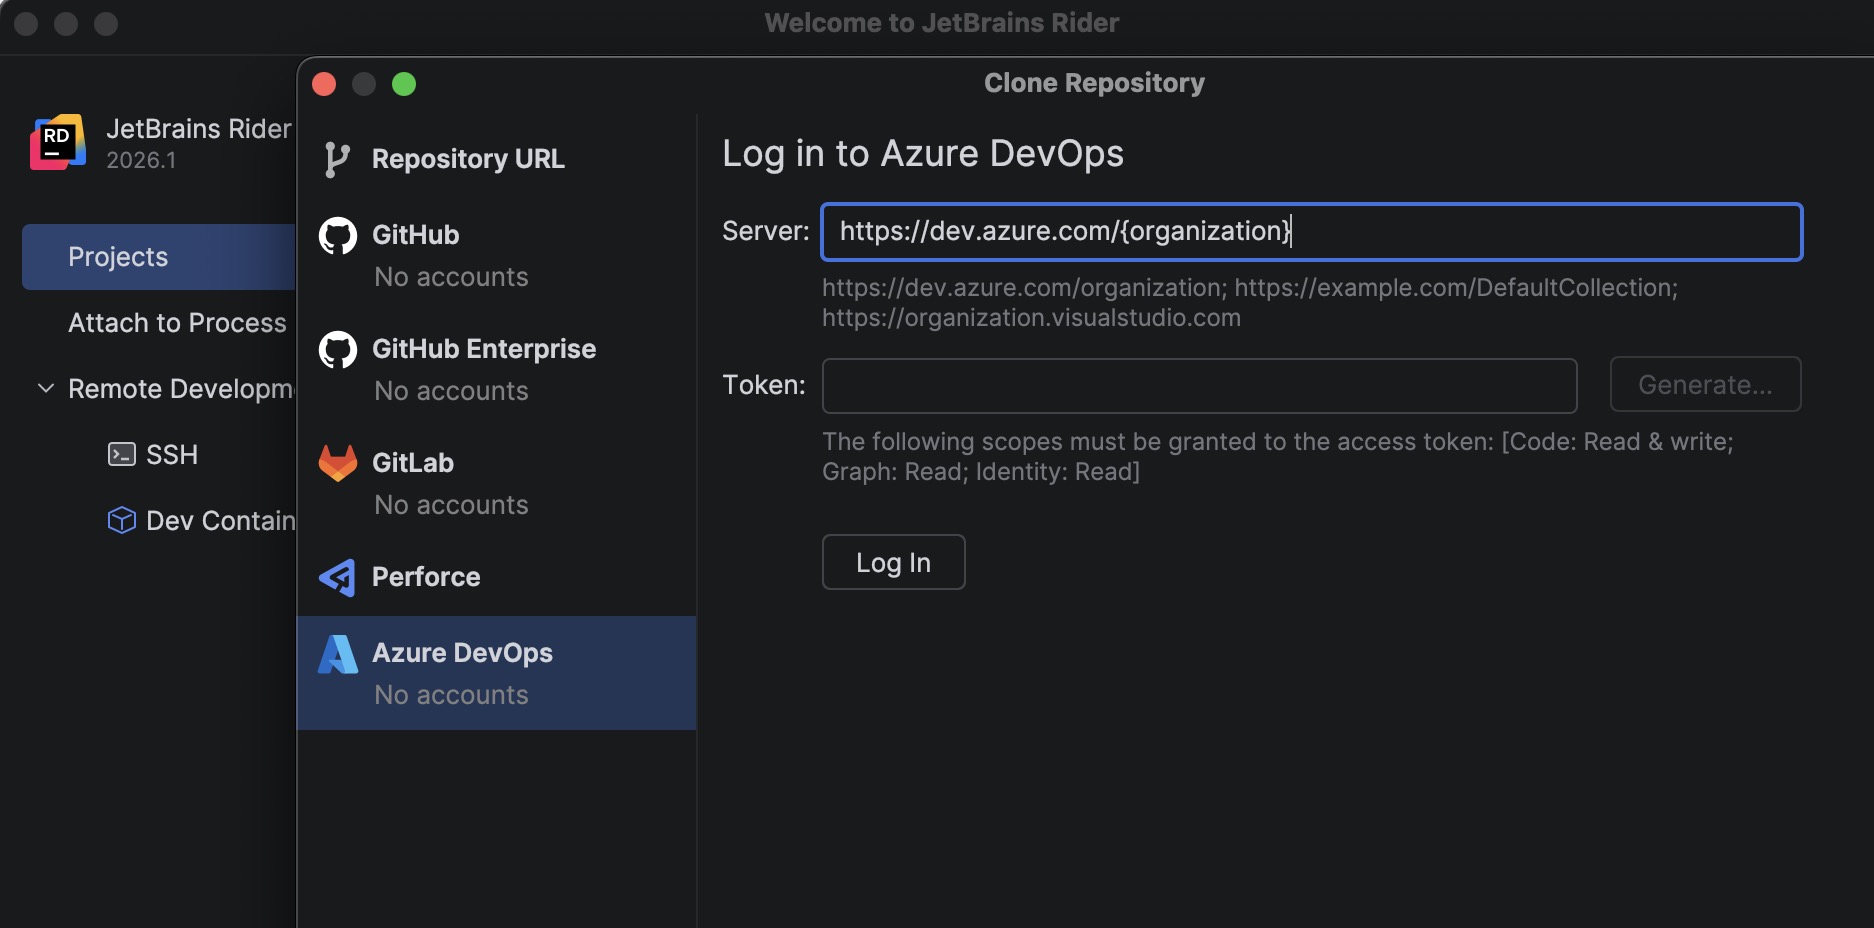
Azure DevOps: Ability to clone repositories
A new bundled Azure DevOps plugin allows you to clone repositories directly from Rider.
To get started, go to File | Open | Get from Version Control and select Azure DevOps from the list of providers. Rider authenticates you using a personal access token (PAT) and then displays the repositories available to your account so you can clone them directly from the IDE.
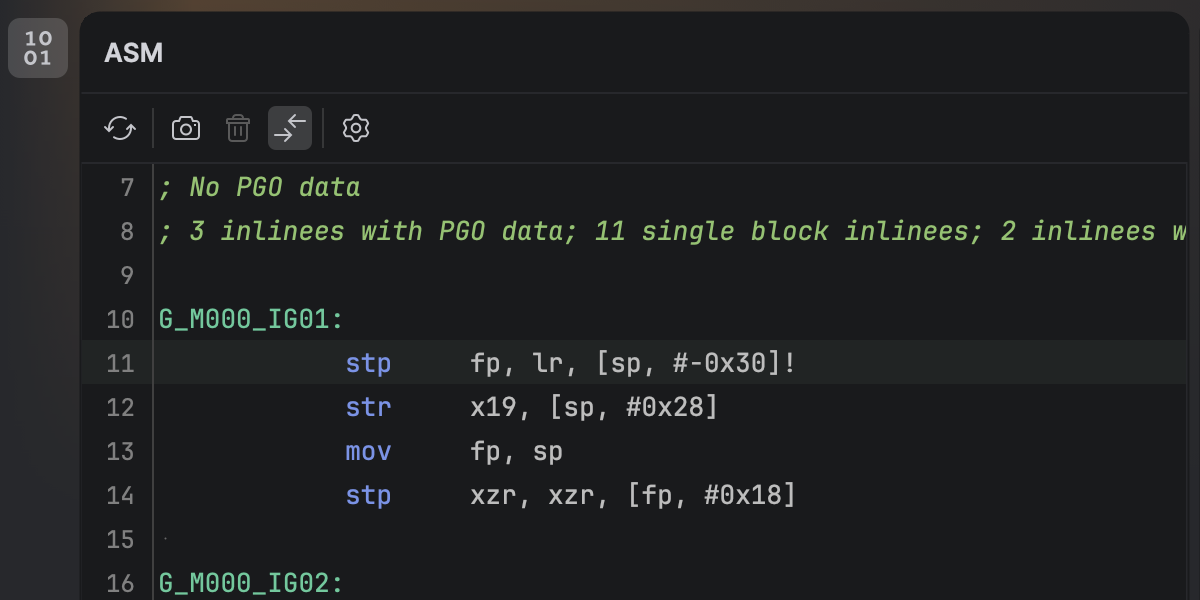
Viewer for .NET disassemblies
You can now view the native disassembly generated from your C# code without leaving Rider. Once you’ve installed the new .NET Disassembler plugin, you’ll be able to inspect output produced by the JIT, ReadyToRun, and NativeAOT compilers inside the new ASM Viewer tool window.
Smoother MAUI iOS development workflow from Windows
Developing .NET MAUI applications for iOS from Windows requires connecting Rider to a Mac build host. Rider 2026.1 streamlines this workflow with a new setup experience that automatically prepares the remote environment.
When you connect to a Mac, Rider now verifies that the remote system has everything configured, including macOS, Xcode, the .NET SDK, and required MAUI workloads. If any components are missing, Rider can install or update them automatically, helping you get started faster.
Additionally, you can now build, deploy, and debug MAUI iOS applications from Windows more reliably. We’ve improved diagnostics and connection stability, and fixed issues that previously prevented MAUI apps from deploying to iOS simulators or Windows devices.
Game development improvements
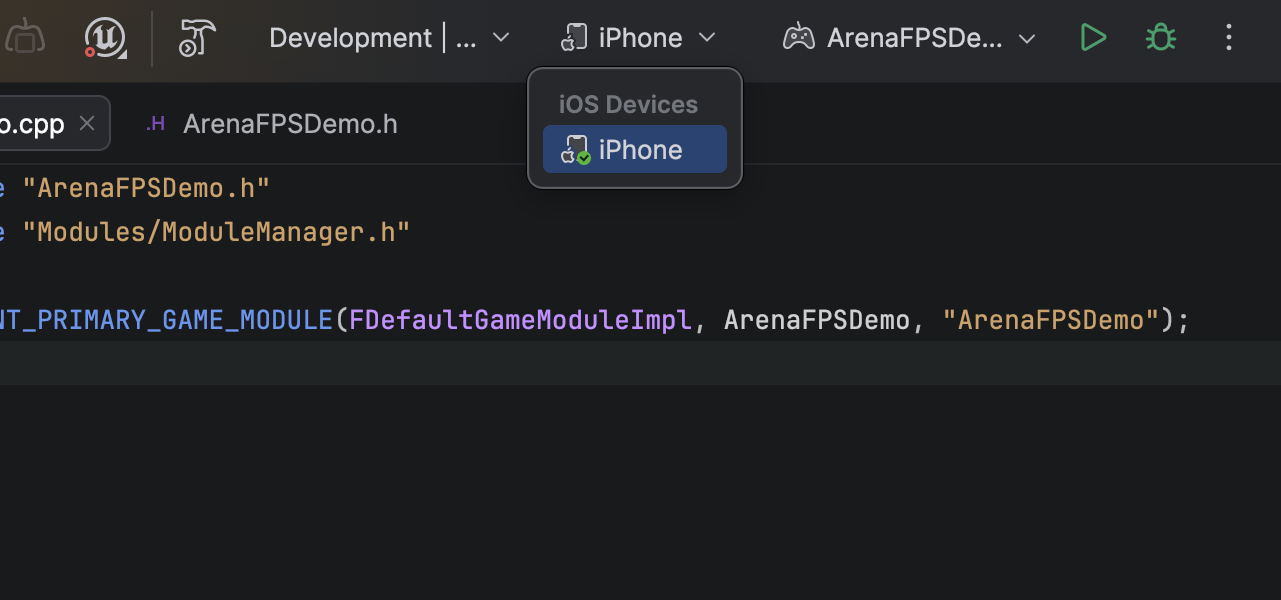
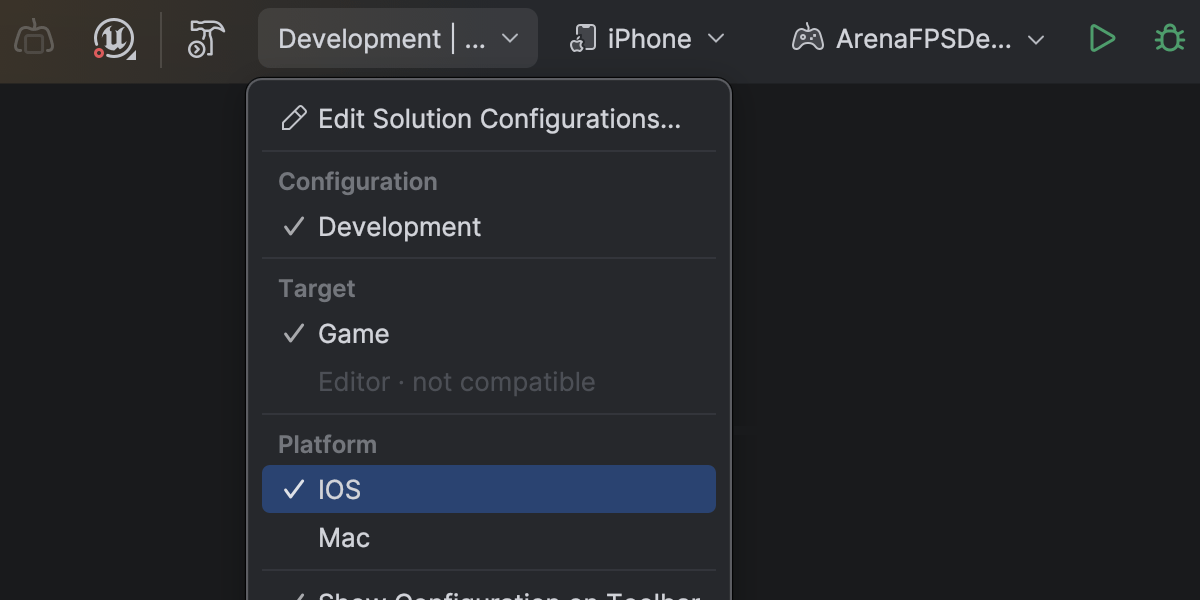
Complete mobile development support for Unreal Engine on Android and iOS
Rider 2026.1 fully supports mobile game development for Unreal Engine across both major mobile platforms. This release builds on Rider 2025.3’s introduction of debugging support for Android-based mobile and VR devices, adding support for iOS-based mobile and VR ones.
On macOS, you can debug Unreal Engine games running on iOS devices directly from Rider. Set breakpoints, inspect variables, step through code, and analyze call stacks – all within the familiar debugger interface.
Initial Xcode setup for provisioning and signing is still needed per Apple's requirements.
Dramatically faster variable inspections for UE projects
Inspecting complex variables while debugging Unreal Engine projects is now much faster and more responsive. Expanding containers no longer slows down your debugging session, making it easier to explore object state and understand what’s happening at runtime.
This improvement comes from a rewritten parser and evaluator for Natvis expressions used by Rider’s debugger. Variable inspection with the rewritten evaluator is up to 87 times faster on warm runs and 16 times faster on cold ones, and the debugger’s memory usage has dropped to just over a third of what it was.
Get the full story of how we were able to achieve that in this blog post.
Blueprint improvements
Finding usages, event implementations, and delegate bindings across Unreal Engine Blueprints and C++ code is now more reliable, making it easier to trace how gameplay logic connects across assets.
Code Vision now supports the BlueprintPure specifier and correctly detects blueprint events implementations in Blueprints. Find Usages has also been improved and now identifies additional BlueprintAssignable delegate bindings.
Blueprint usage search now relies on the asset path instead of the Blueprint name, ensuring accurate results even when multiple Blueprints share the same name.
Rider’s C++ intelligence is powered by JetBrains ReSharper C++. For a complete overview of the C++ improvements in this release, see the dedicated What’s New in ReSharper C++ 2026.1 page.
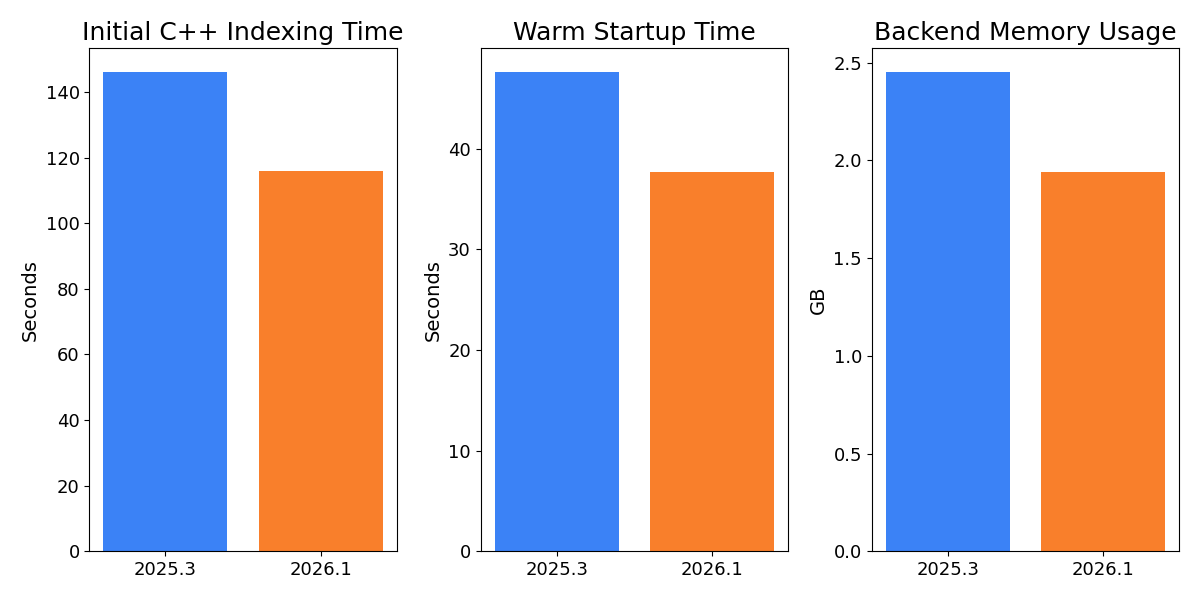
Faster indexing and lower memory usage for Unreal Engine projects
Working with large Unreal Engine codebases is now noticeably faster and more resource-efficient. In our measurements on Epic Games’ Lyra sample project, initial C++ indexing is over 20% faster, helping you get to work sooner when opening a project for the first time.
After opening an already indexed project, the backend uses approximately 14% less memory, reducing the IDE’s footprint and leaving more resources available for the rest of your workflow. Warm startup is also 10% faster, so returning to your project between sessions feels snappier.
Rider now also indexes Unreal Engine plugins by default. With the growing use of plugins in Unreal Engine projects and the recent performance gains, indexing plugins by default provides better code analysis and navigation out of the box. You can restore the previous behavior on the Language & Frameworks | C/C++ | Unreal Engine tab in Settings.
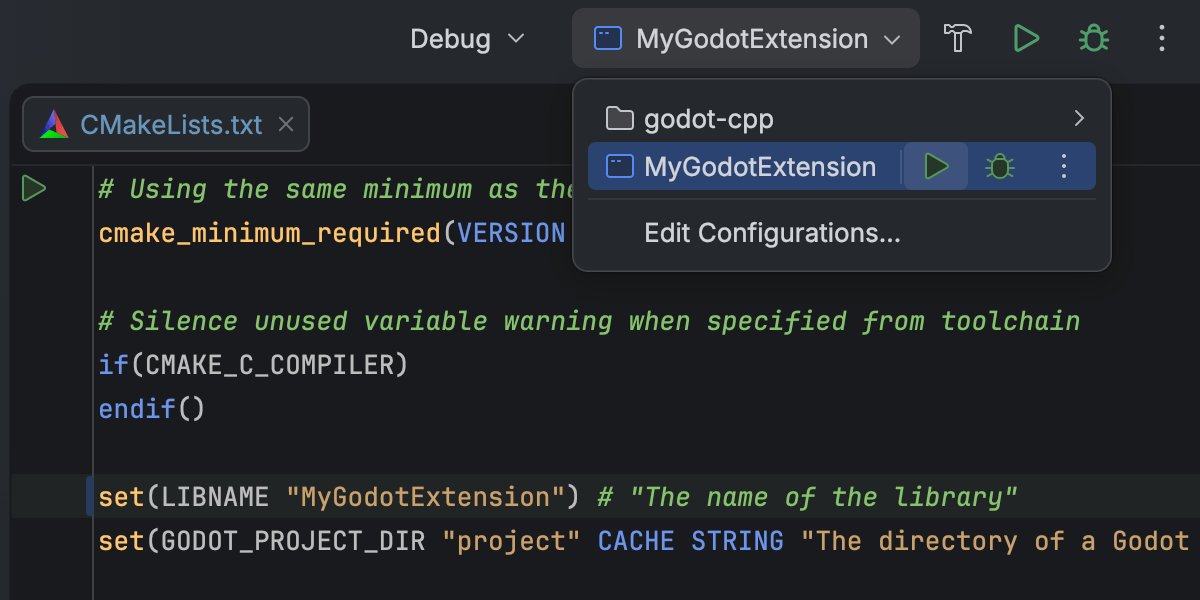
CMake support for C++ gaming projects Beta
Rider 2026.1 introduces Beta support for CMake-based C++ projects, allowing you to open, edit, and build them directly in the IDE. This makes it easier to work with cross-platform projects without switching to another build system.
This initial implementation focuses on C++ workflows, including those for editing and debugging CMake configuration files. Some workflows and edge cases may still require refinement, and we’ll continue improving performance and compatibility in upcoming releases. We would love for you to share your experience in this ticket.
This addition is intended to support game development workflows that rely on CMake, such as projects built around CMake-based engines or tooling. For general-purpose C++ and embedded development, CLion remains the primary JetBrains IDE.
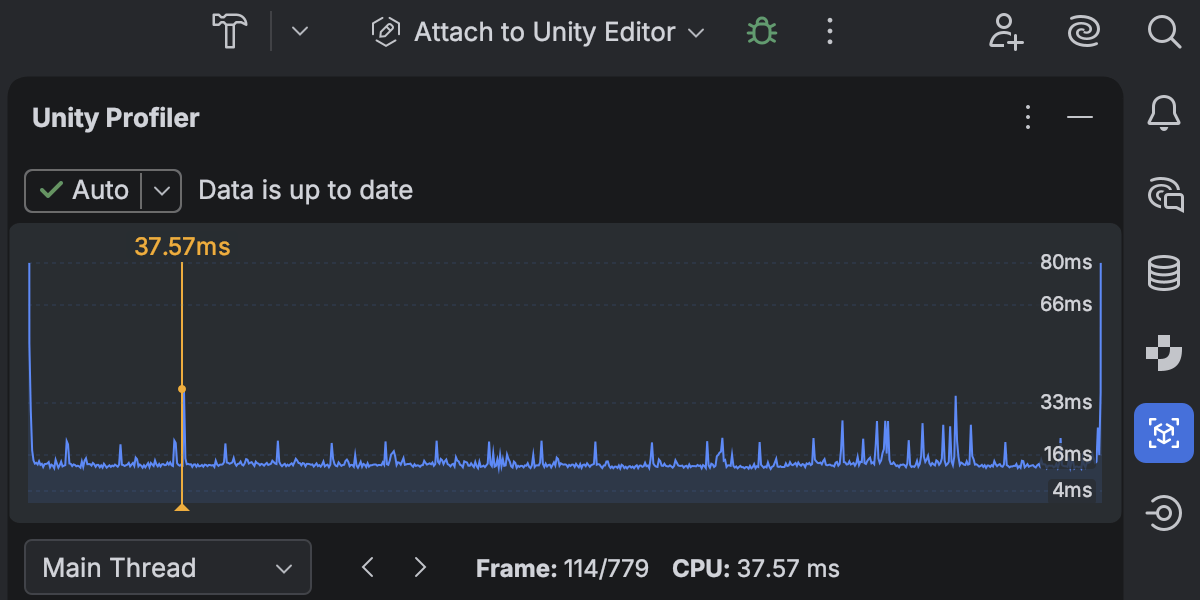
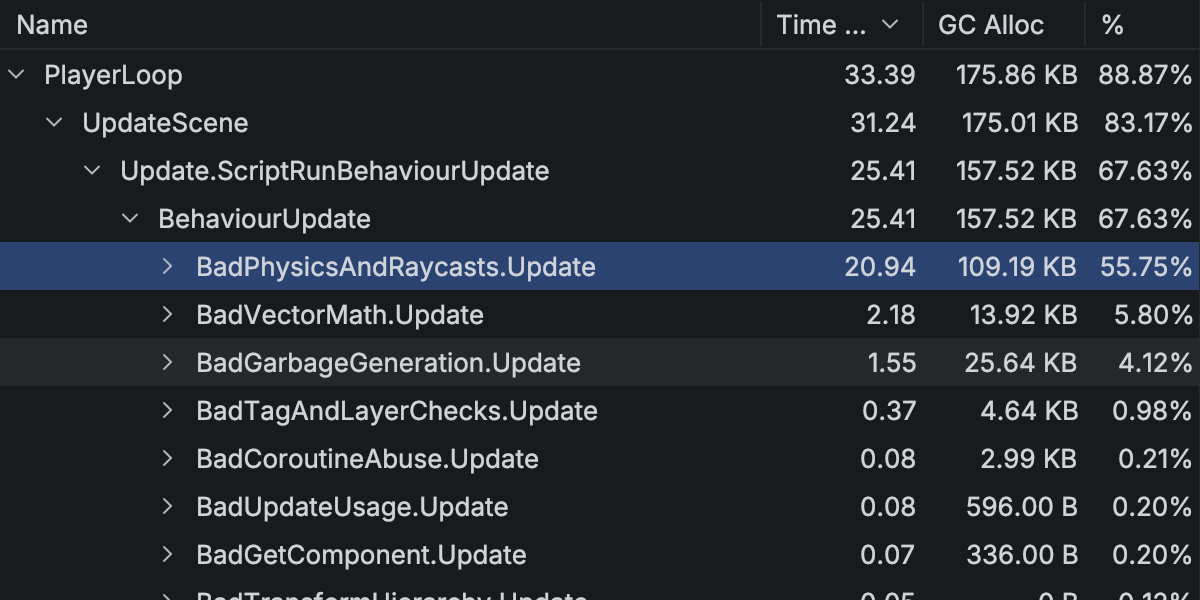
Redesigned Unity Profiler integration
Performance investigation for game projects has become a first-class workflow in Rider 2026.1, thanks to the redesigned Unity Profiler integration.
You can now open Unity Profiler snapshots directly in Rider and analyze them in a dedicated Profiler tool window with a structured view of frames and call stacks. A timeline view shows CPU time per frame, helping you quickly identify slow frames and performance hotspots.
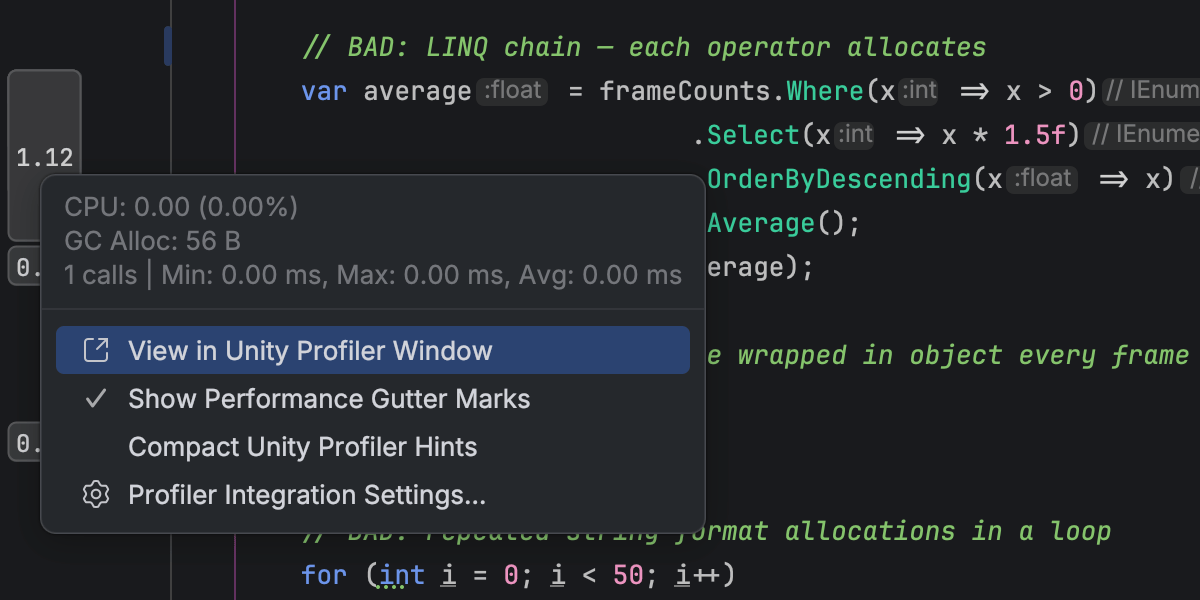
Profiler data is tightly integrated with your code. You can navigate directly from profiler frames and call stacks to the corresponding source, while editor gutter indicators display execution time and memory information inline.
This integration reduces context switching between the Unity Editor and Rider, allowing you to move more naturally between performance data and code when investigating runtime issues.
Please note that Rider does not perform profiling itself and relies on profiler data produced by Unity. Learn how to get started from our documentation.
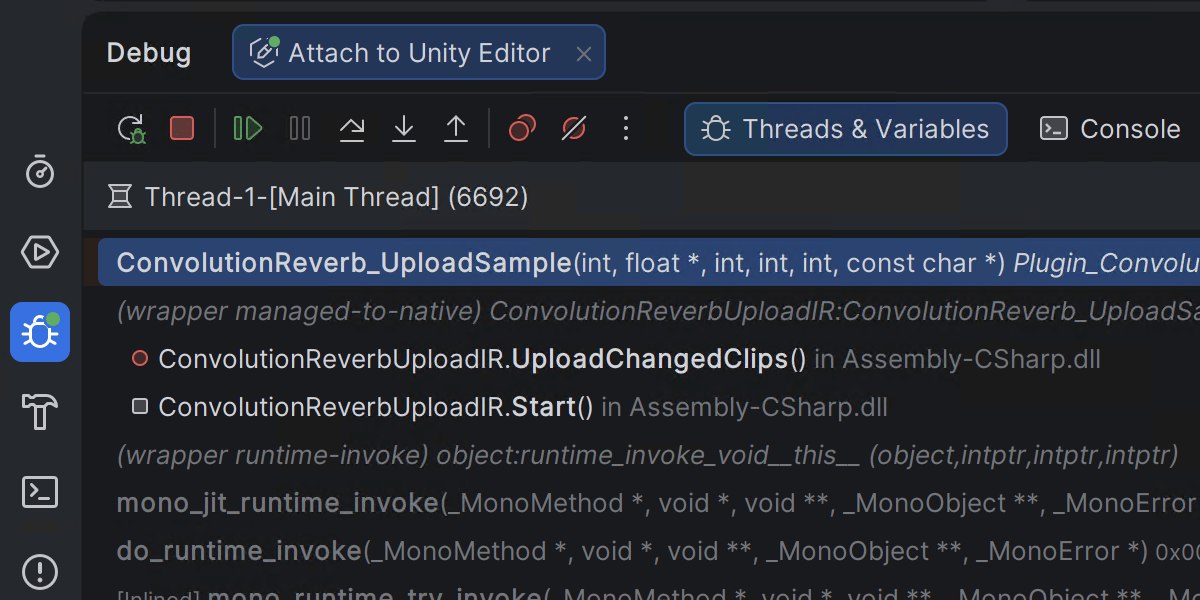
.NET mixed-mode debugging on Windows
Rider 2026.1 introduces mixed-mode debugging, which lets you debug both managed (.NET and .NET Framework) and native (C/C++) code in a single debugging session. This is particularly useful for applications that cross managed-native boundaries, such as those where .NET code calls into native libraries or game engines built from a mix of managed and native components.
This feature is currently available only on Windows. You can leave your feedback on the feature in this ticket.
Enhanced Godot editor integration
Rider’s Godot integration includes a new add-on that bridges the Godot editor and Rider. When enabled in the Godot toolbar, it automatically configures your Godot editor settings for a smoother development experience in Rider.
Search for “JetBrains Rider Integration” in the AssetLib inside the Godot editor to get started.
Platform and IDE changes
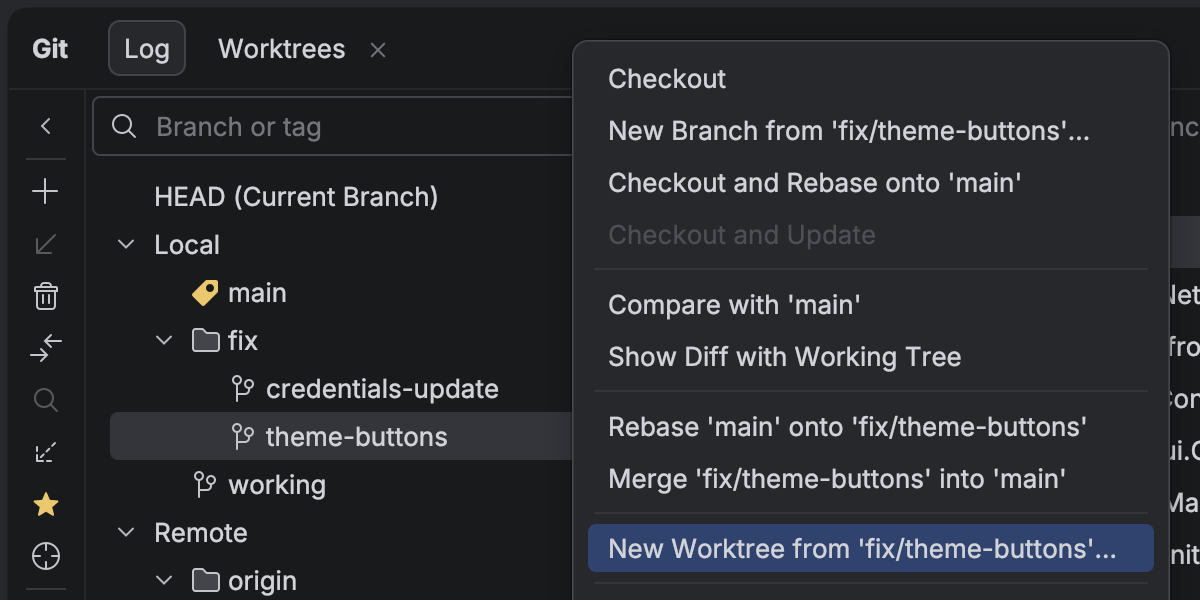
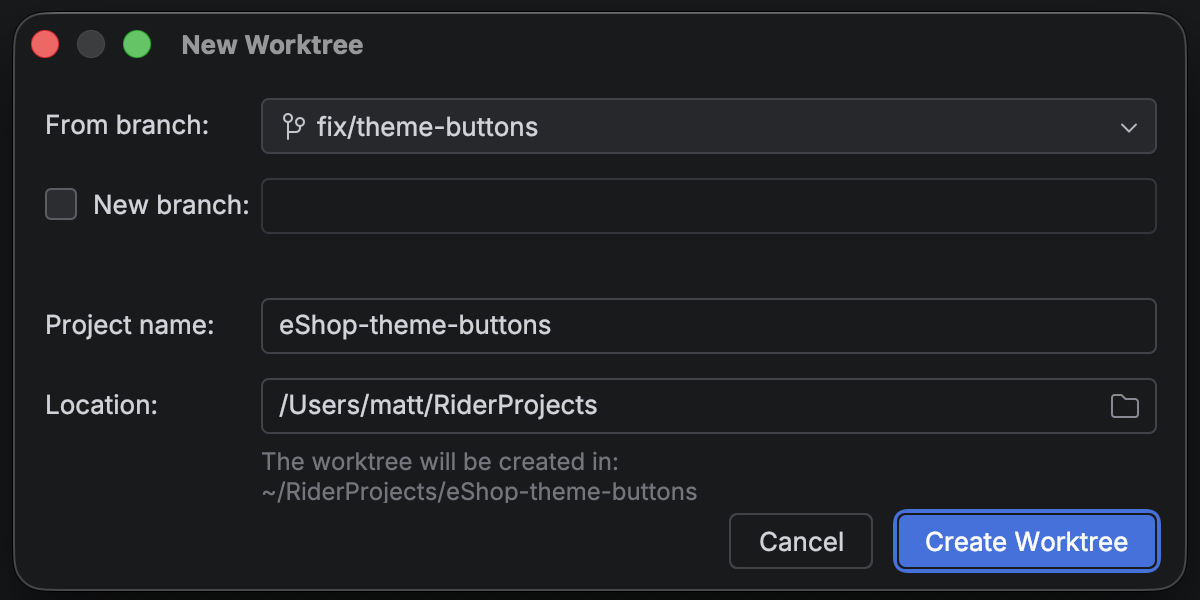
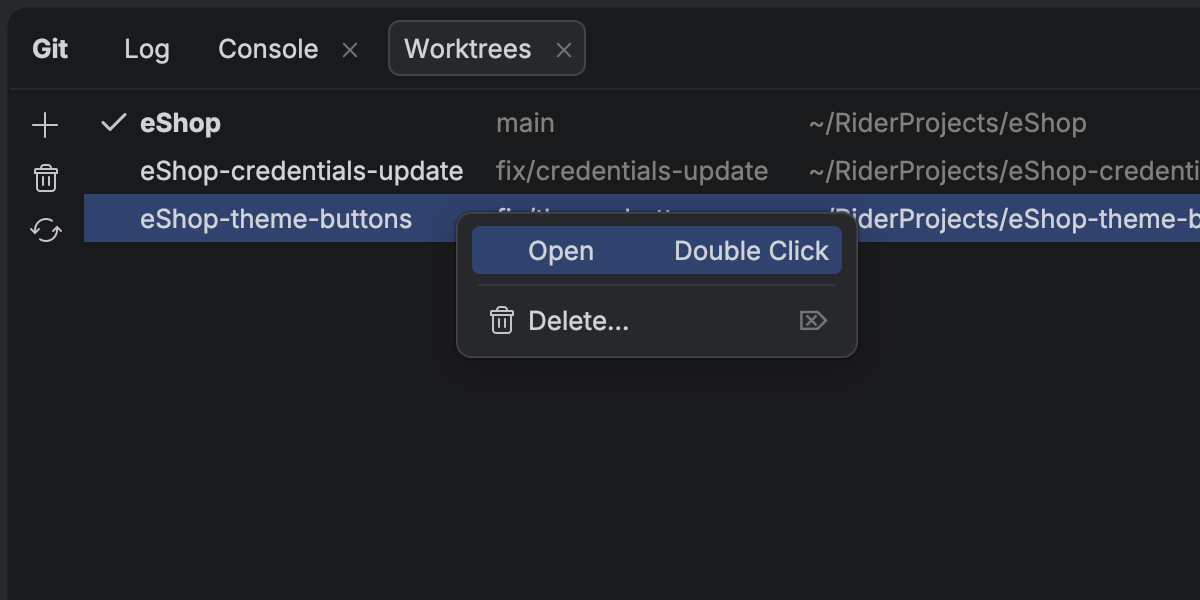
Ability to work on multiple branches at once with Git worktrees
Rider is continuing to evolve as an open platform that allows you to bring your preferred AI tools into your professional development workflows.
With the evolution of AI agents, running multiple tasks in parallel has become a major time-saver, and this is precisely where Git worktrees are extremely handy. To support cutting-edge workflows for AI-boosted software development, Rider now provides first-class support for Git worktrees. Create a separate worktree for an urgent hotfix, hand off another one to an AI agent, and keep working in your main branch – all at the same time, without interruption.
Even if you don’t use agents, worktrees will save you time on branch switching, especially in big projects.
Working with databases
The AI chat integration for Codex and Claude Agent now offers full, native support for your connected databases. You can query, analyze, and modify your database state using natural language right from the IDE. The same functionality is available for external agents via an MCP server.
Data source settings can now be stored in your JetBrains Account via data source templates. Especially nifty for All Products Pack users or anyone who uses multiple instances of JetBrains IDEs, this upgrade allows you to access data source templates and settings in every JetBrains IDE with database functionality.
Code With Me sunset
As we continue to evolve our IDEs and focus on the areas that deliver the most value to developers, we’ve decided to sunset Code With Me, our collaborative coding and pair programming service. Demand for this type of functionality has declined in recent years, and we’re prioritizing more modern workflows tailored to professional software development.
As of version 2026.1, Code With Me will be unbundled from all JetBrains IDEs. Instead, it will be available on JetBrains Marketplace as a separate plugin. 2026.1 will be the last IDE version to officially support Code With Me, as we gradually sunset the service.
You can read the full announcement and see the sunset timeline in this blog post.