What’s New in Rider
Rider 2023.3 offers support for the .NET 8 SDK, including the latest features from C# 12. This update also brings an improved experience for running multiple projects, a predictive debugging mode, and the ability to easily create and navigate through unit tests. The release of Rider 2023.3 is also enhanced by a major update to AI Assistant.
Key updates
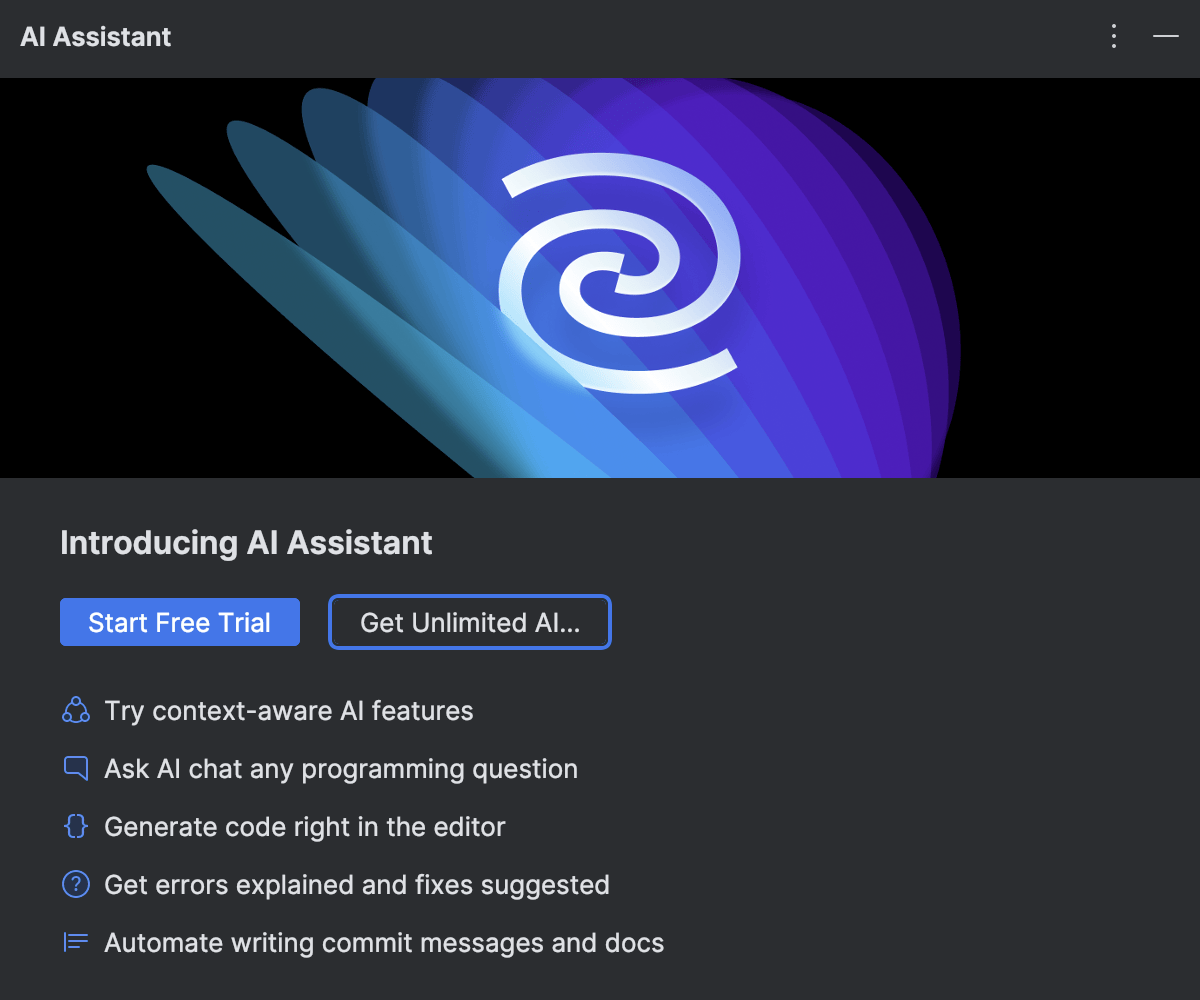
AI Assistant is out of preview General Availability
JetBrains AI Assistant is now generally available with a number of new and improved features to increase your productivity in JetBrains IDEs. The latest set of improvements for Rider includes:
- Context-aware AI chat
- Better project awareness for AI Actions
- Multi-line code completion
- In-editor code generation
- Unit test generation
- Documentation generation
- Diff view for AI-suggested refactorings
- Ability to create a library of custom prompts
Use AI Assistant in Rider as a supplemental feature with a JetBrains AI Service subscription.
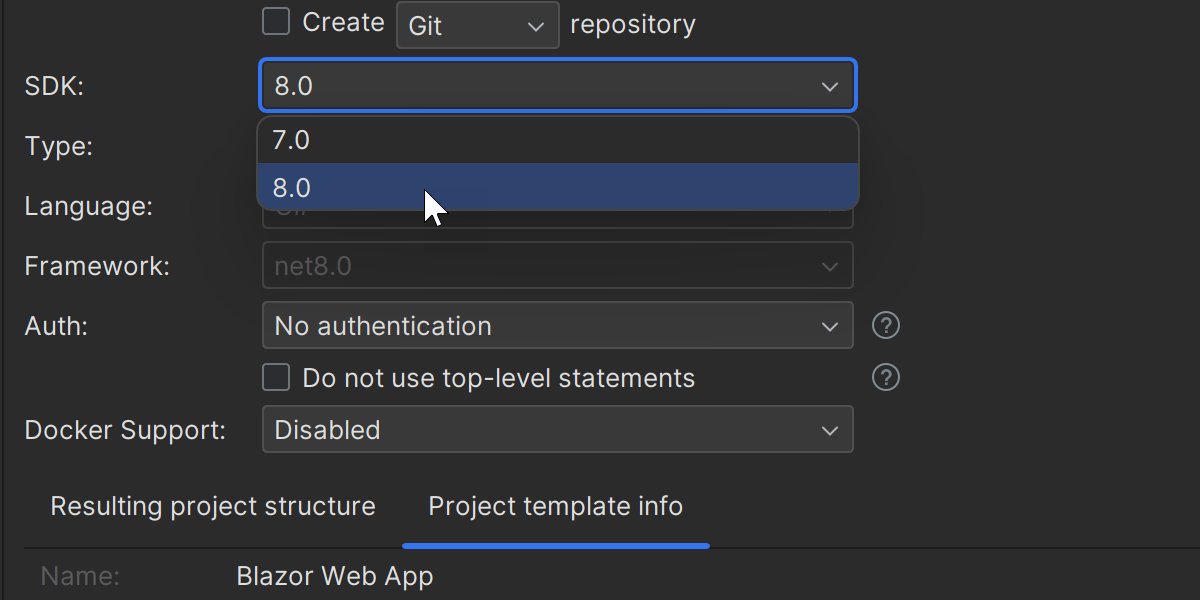
.NET 8 SDK support
Rider 2023.3 officially provides support for the .NET 8 SDK, including:
- Updated project templates.
- The ability to create, run, and debug projects targeting the new SDK.
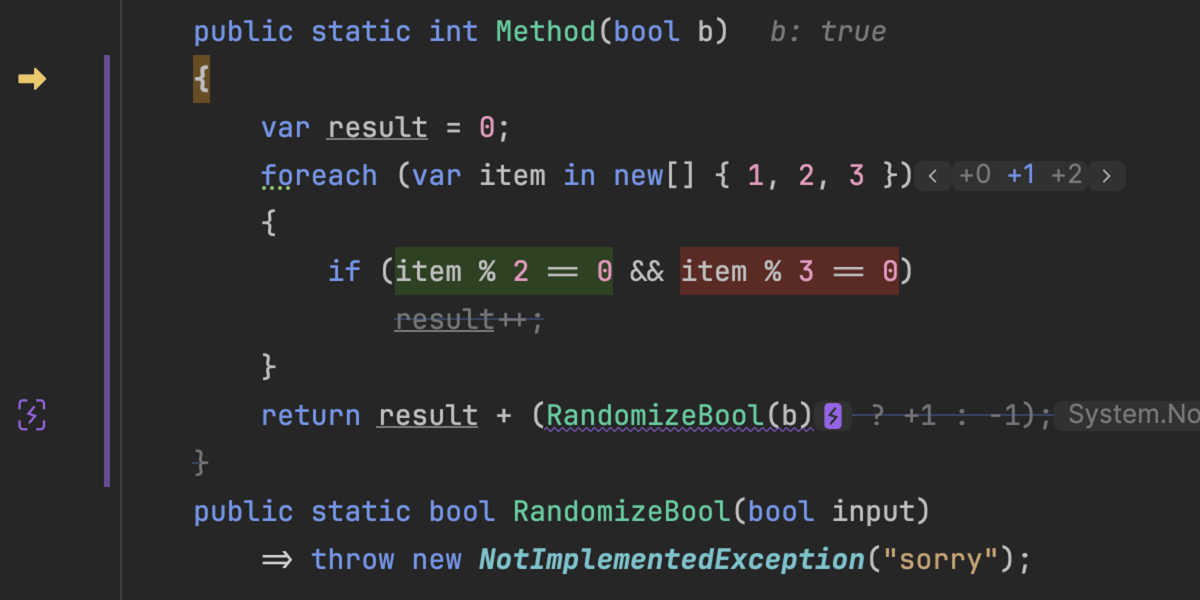
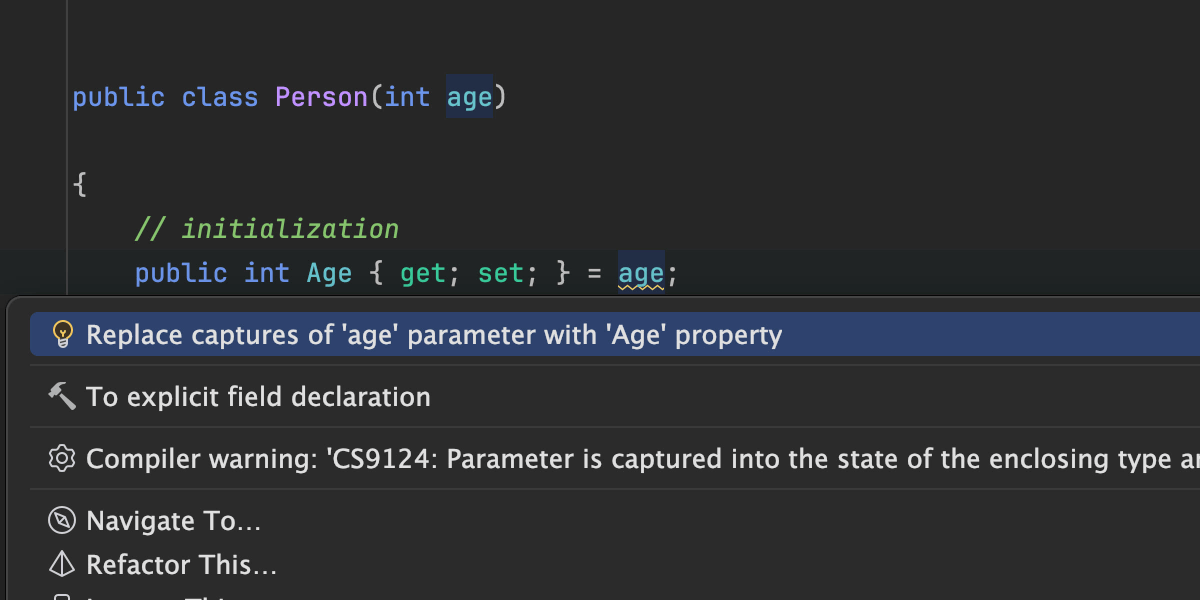
- New C# 12 features, including primary constructors, interceptors, and alias directives to reference any type.
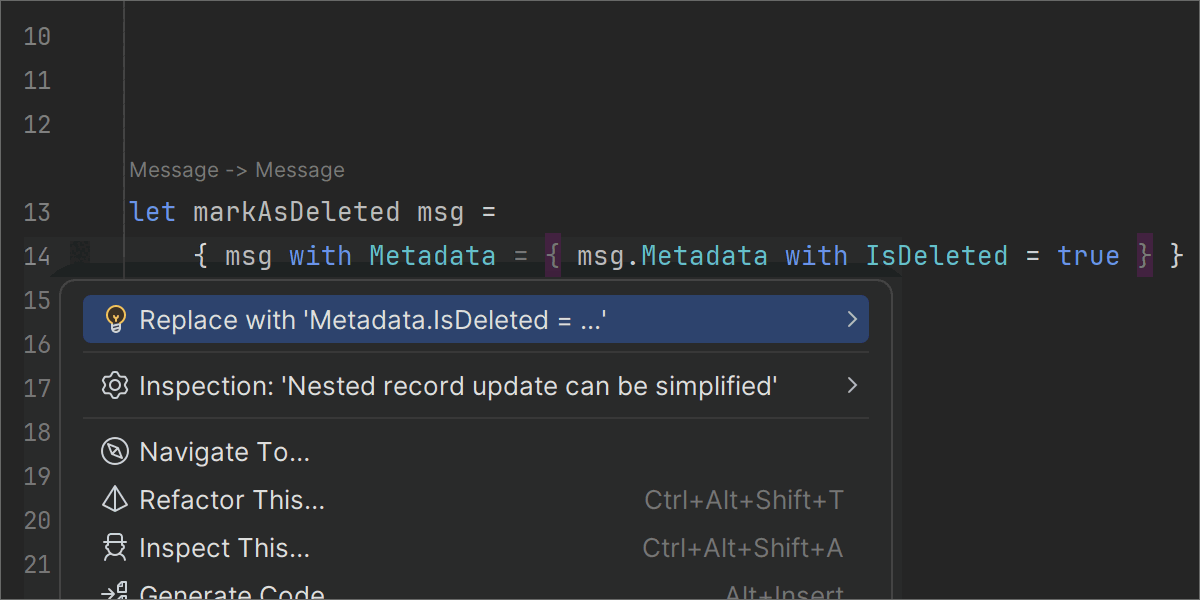
- Support for F# 8 features, namely shorthand lambda expressions, nested record updates, static interface members and let bindings, and more.
- Support for
@variables. - Support for Identity API endpoints.
Running multiple projects
With Rider 2023.3, you can run and debug multiple projects simultaneously with advanced control over task execution order and conditions.
Learn more in Rider’s documentation.
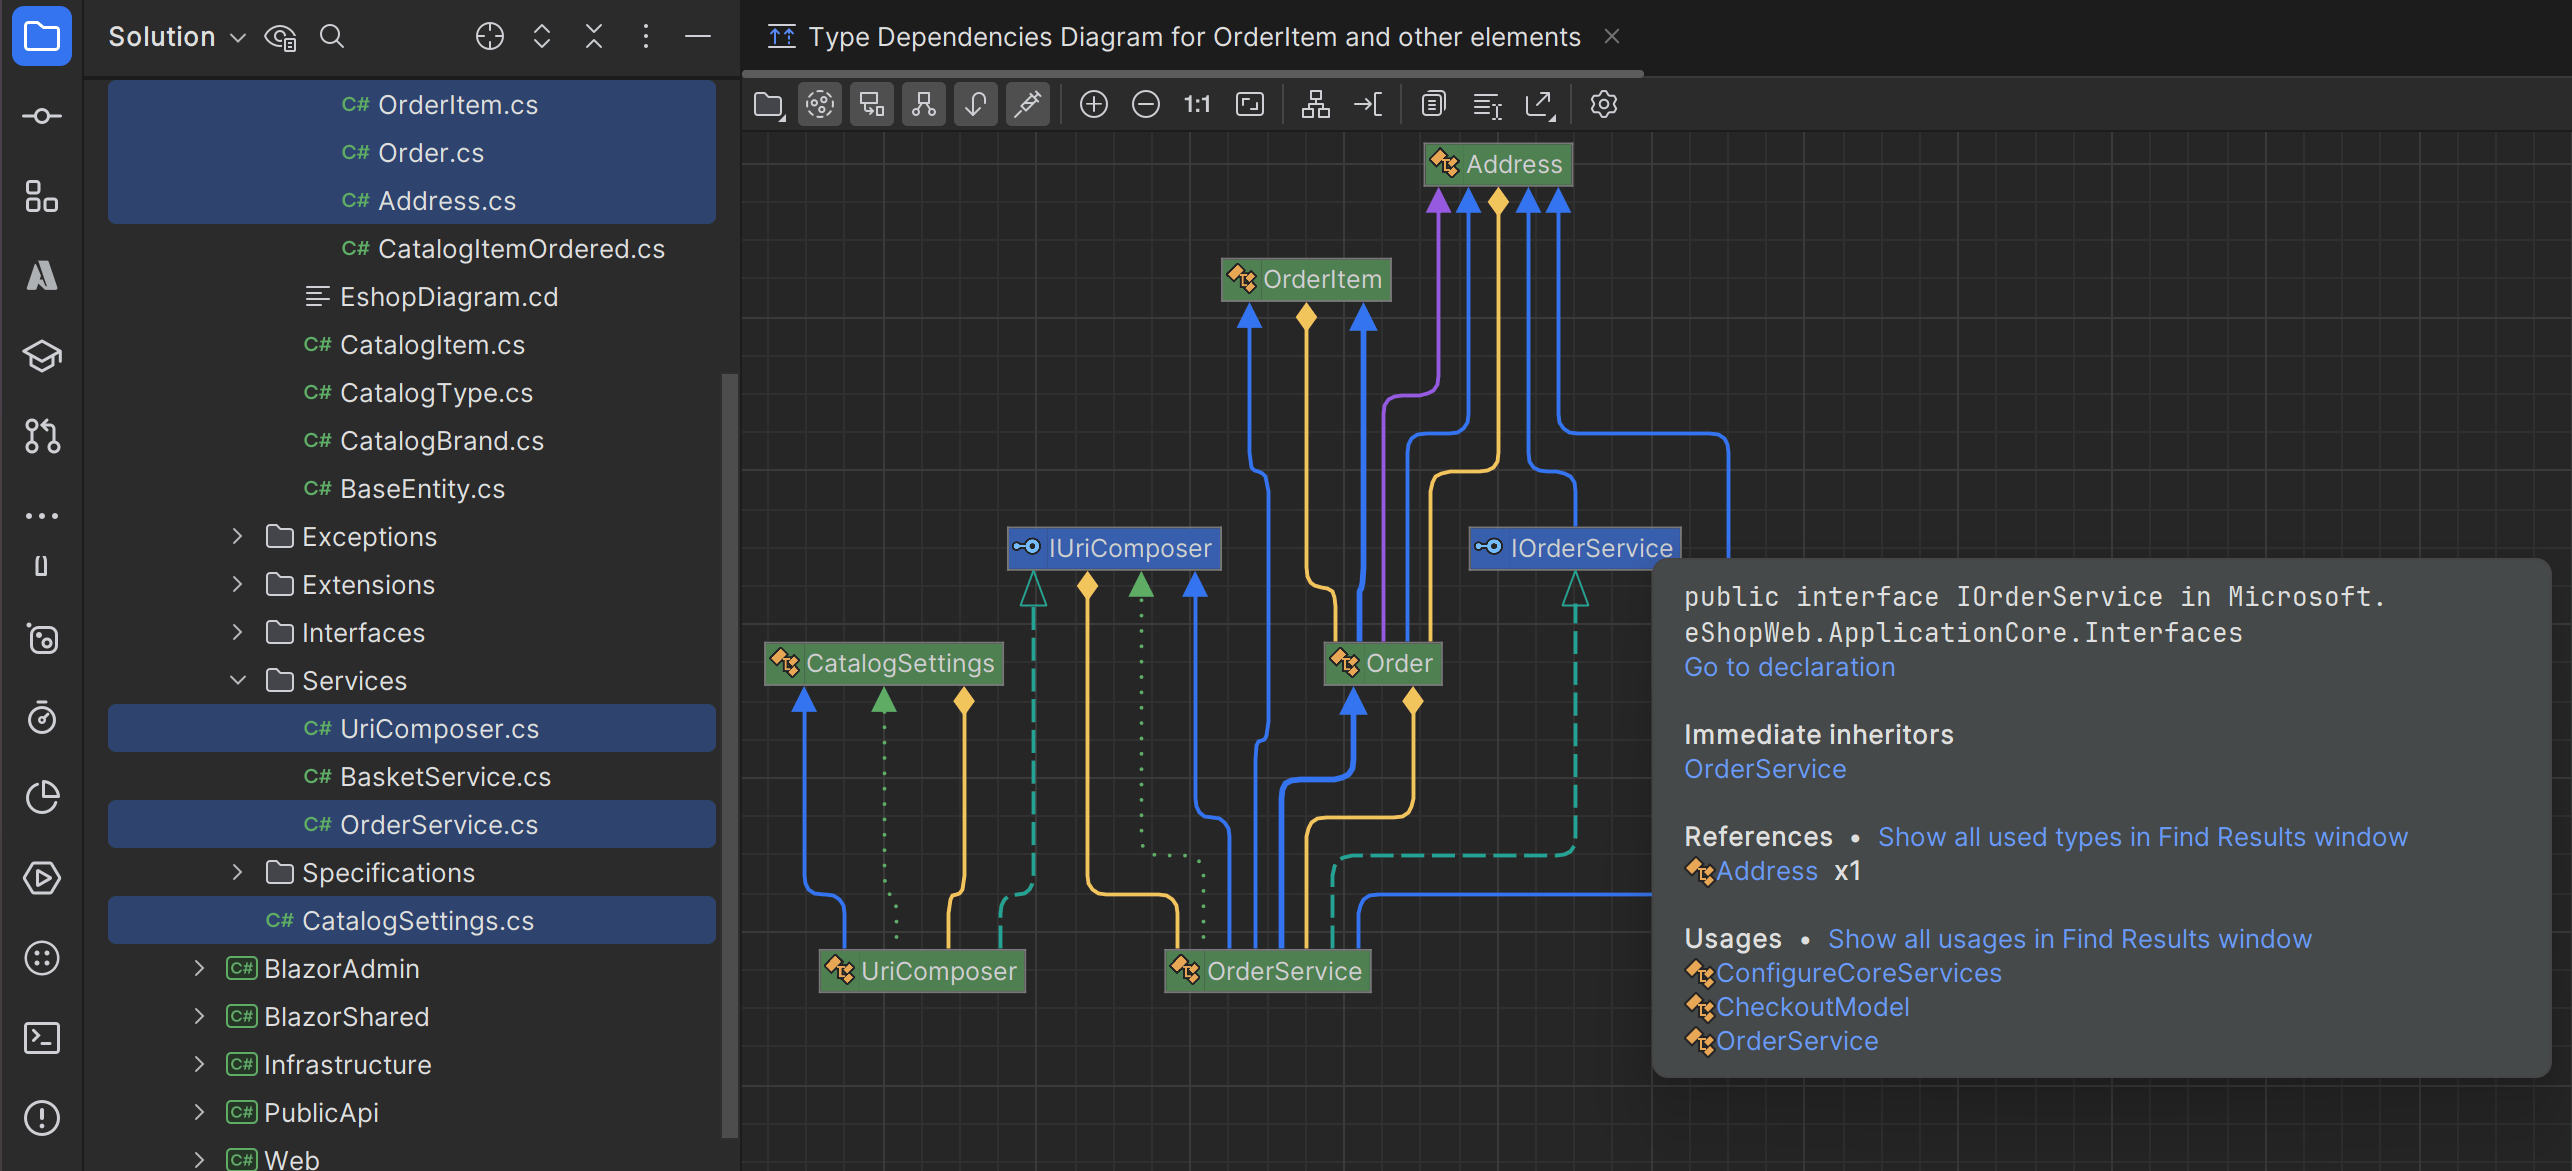
Type dependency diagrams
Rider 2023.3 allows you to explore the relationships and dependencies between different classes, structs, interfaces, and modules in your solution through type dependency diagrams.
Learn more in Rider’s documentation.
Predictive debugging
Predictive debugging is a new advanced debugging mode for Rider that predicts potential issues in your code and alerts you to them without the need to execute the code.
Learn more in Rider’s documentation.
Creating and navigating through unit tests
You can now easily navigate and create tests for your production code using Rider. With this release, we’re also introducing the ability to generate the tests using AI Assistant.
Learn more in Rider’s documentation.
С# support
С#12 updates
With its latest release, Rider extends the list of C# 12 features it supports, namely primary constructors, alias directives to reference any kind of type, collection expressions, interceptors, and others.
Check out this blog post to dive into the latest updates to C# support introduced in Rider and ReSharper 2023.3.
Inspections targeting Entity Framework-related issues
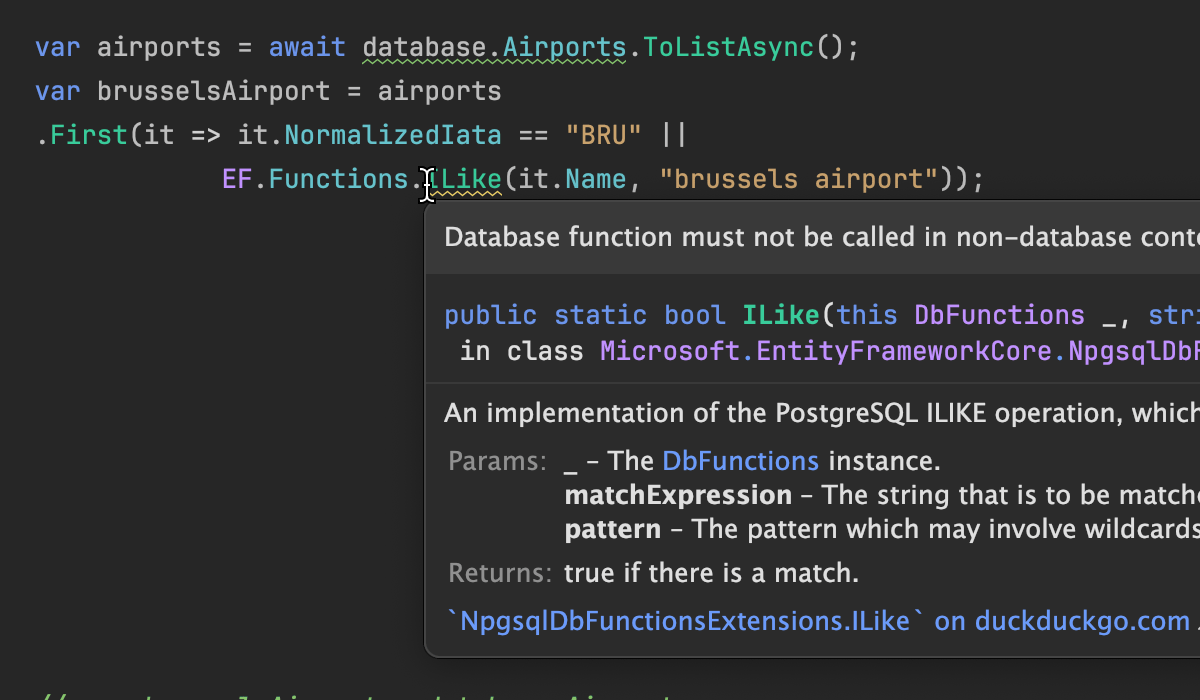
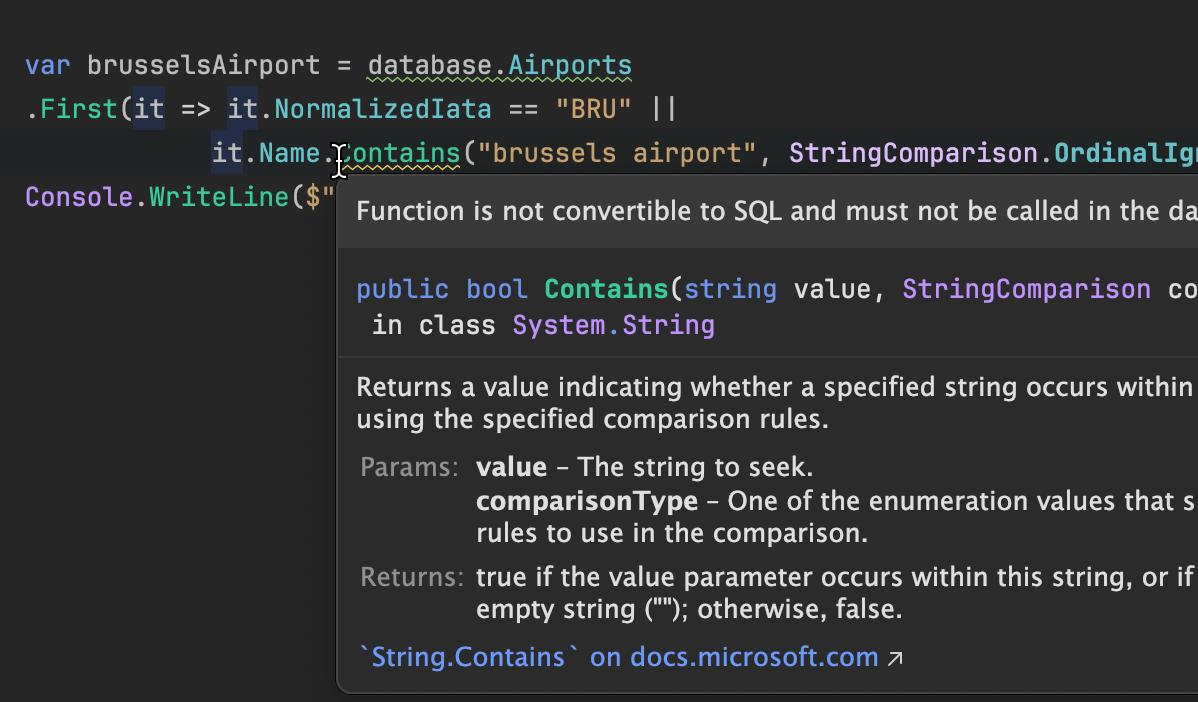
Rider 2023.3 brings a couple of new inspections for usages of methods in Entity Framework-related code that could potentially produce runtime exceptions.
You can learn all about the new inspections from this blog post.
Performance
Rider 2023.3 can now recognize and facilitate more scenarios where code analysis services can operate incrementally when interrupted by typing. This improvement is particularly beneficial for handling large files.
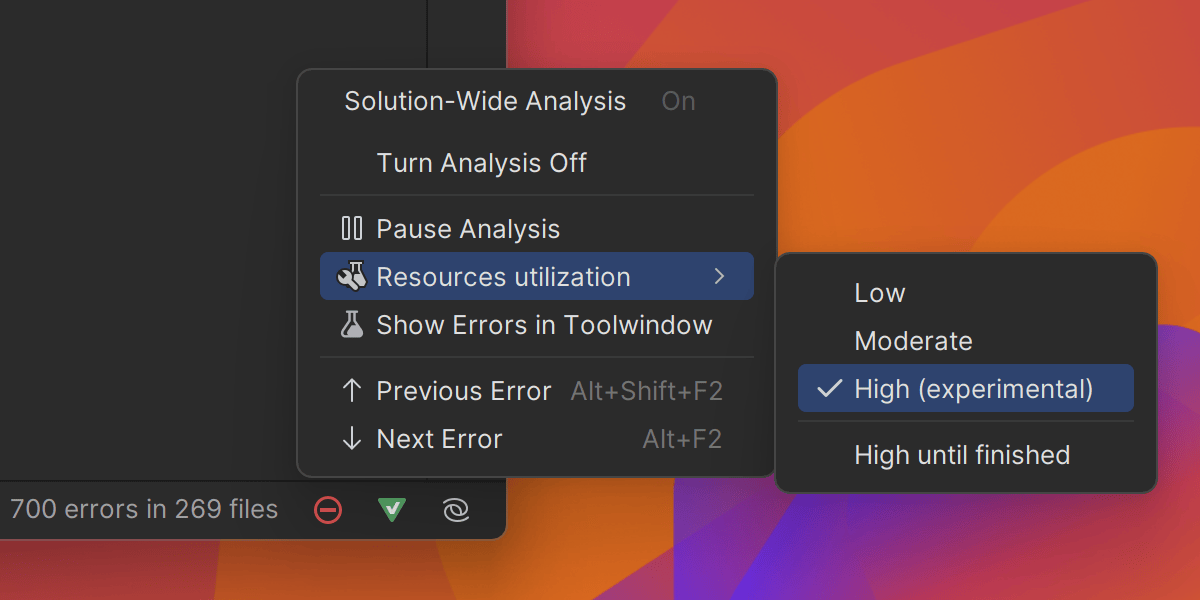
The latest update also puts you in control of the amount of resources to be allocated to solution-wide code analysis. You can now choose between Low, Moderate, and High modes of resource utilization.
Despite its name, the High mode is designed to not interfere with typing in the editor and does not degrade the IDE’s responsiveness. It gradually starts increasing the CPU usage only after code analysis is interrupted by code typing, maintaining a smooth typing experience, all while solution-wide analysis is processing the source code in the background.
Other performance enhancements
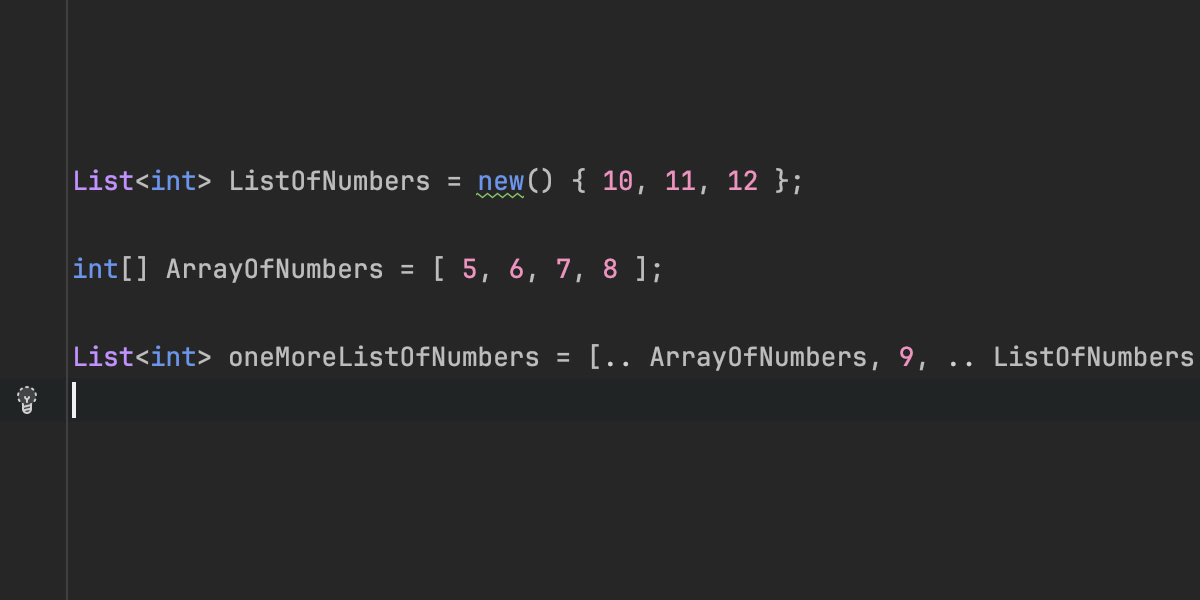
Finding usages of types and constructors is now faster for solutions with numerous
target-typed object creations, for example SomeType _field = new().
This improvement also positively affects refactoring speed.
We’ve also fixed some issues associated with handling injected languages, which used to cause increased CPU usage.
Editor
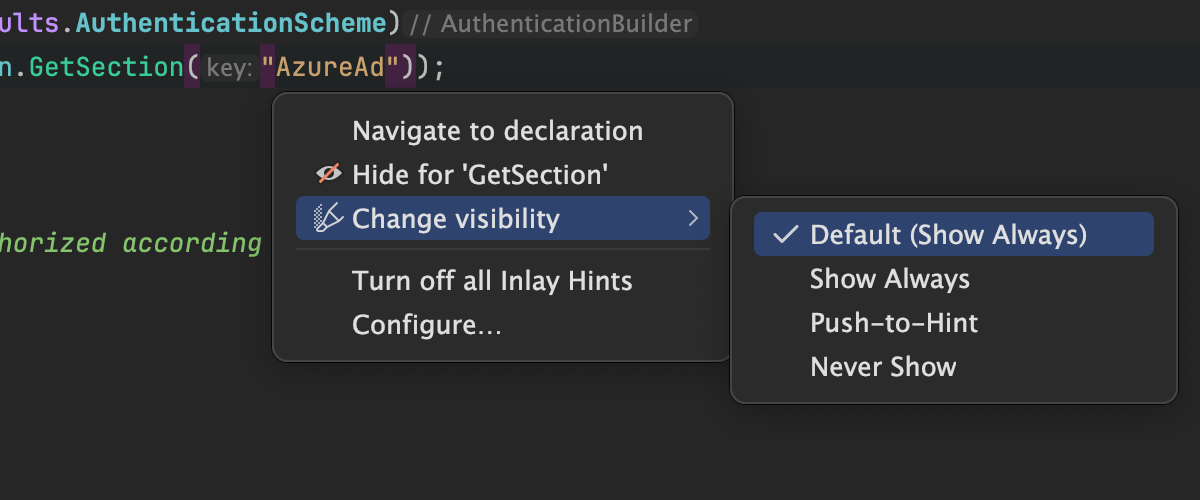
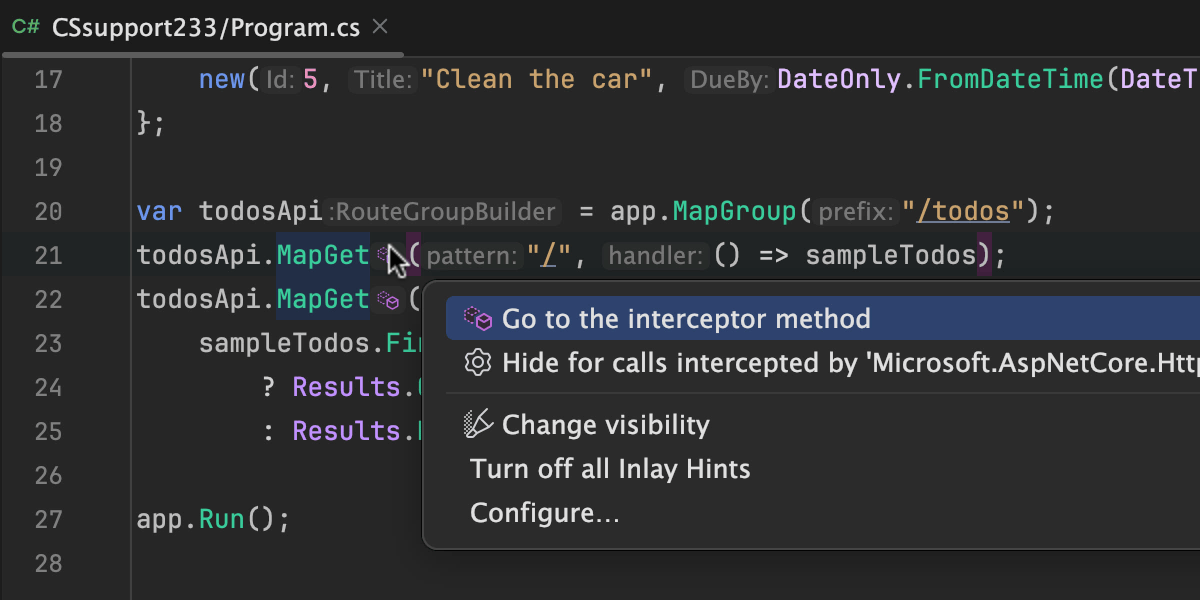
Improved UX for inlay hints
In Rider 2023.3, you are able to right-click inlay hints to reveal the context menu. You can also navigate to declarations from an inlay hint with Ctrl+Click.
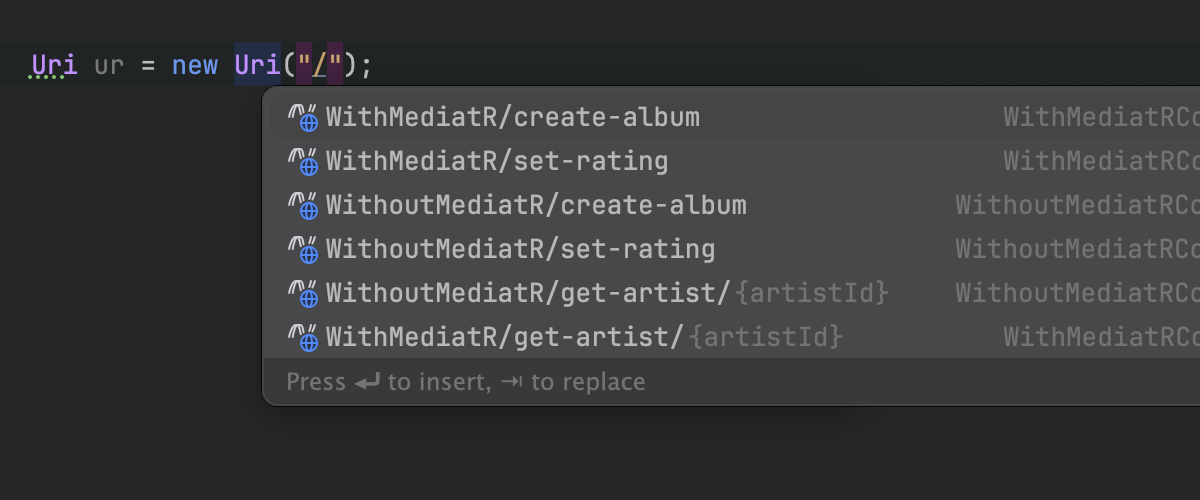
Automatic code completion for URL path references
We’ve improved the code completion functionality for handling URLs. Now, when you
type / in places where a URL path is expected, the IDE automatically
populates the code completion popup with the URLs of server endpoints. When doing
so, it considers both available APIs within your application and attached OpenAPI
specifications to help you specify the URL path more quickly.
UX/UI
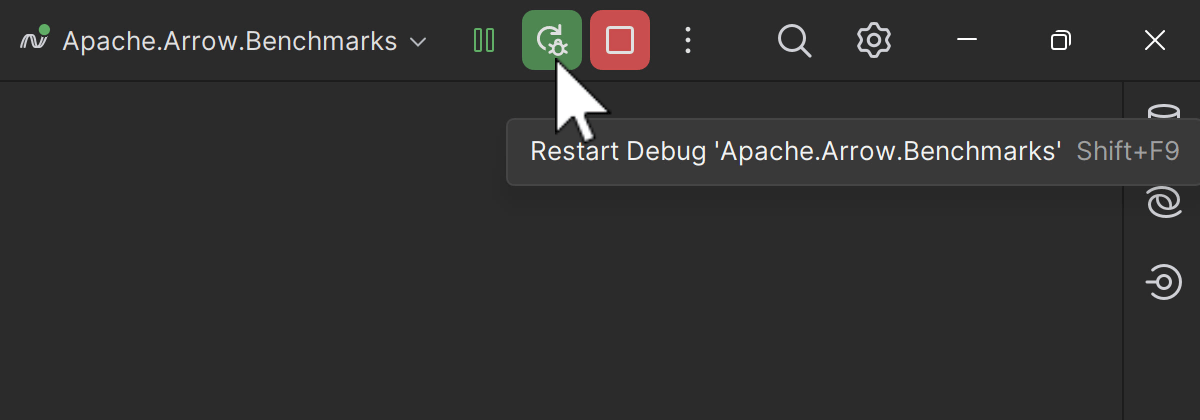
Resume button for debugging
As promised, the Run button in the main toolbar has been replaced with a Resume button during debugging.
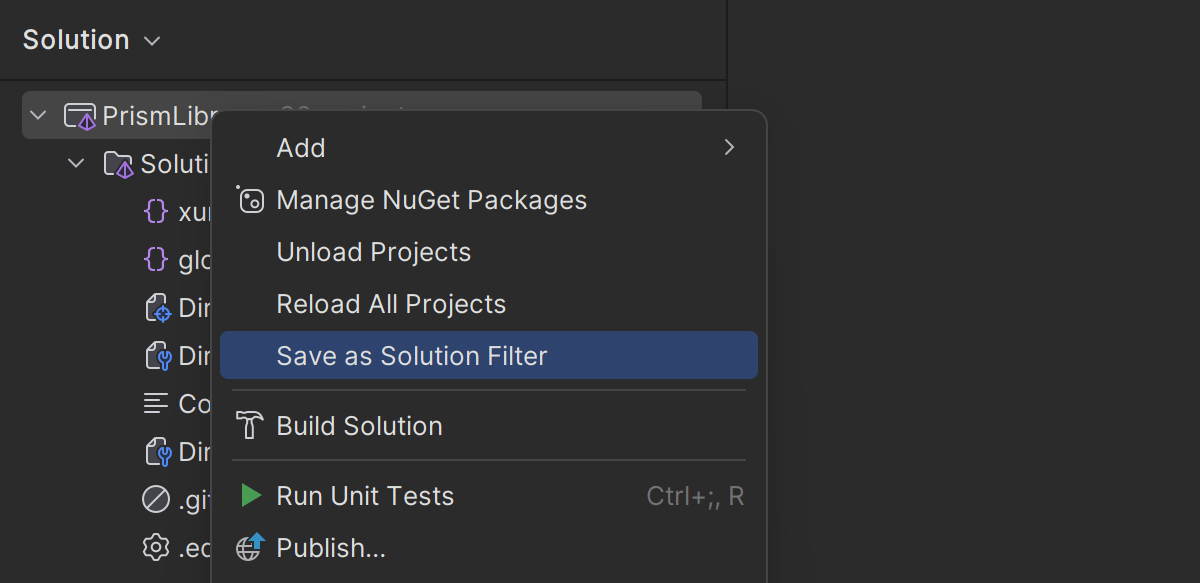
Save as Solution Filter
Rider 2023.3 will allow you to quickly and easily create solution filters
(.slnf files). Using solution filters can help you tailor your IDE’s
Project view to match the specific context you’re working in, making it
easier to manage large, complex projects. To create a solution filter, right-click
on your solution in the Solution Explorer and select
Save as Solution Filter.
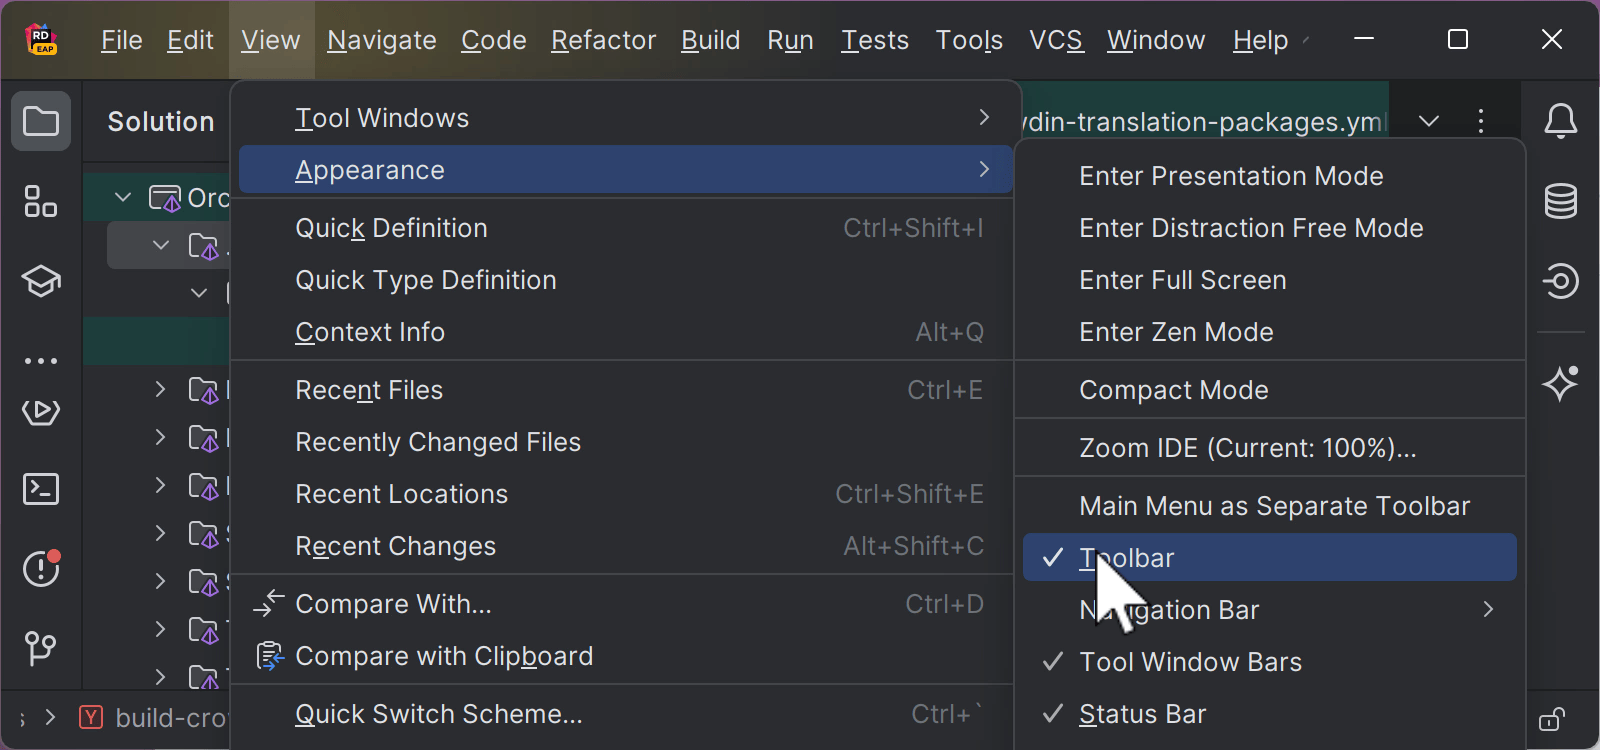
Option to hide the main toolbar in the default viewing mode
In response to your feedback about the new UI, we’ve implemented an option to hide the main toolbar when using the IDE’s default viewing mode, just like in the old UI.
To declutter your workspace and remove the toolbar, select View | Appearance and uncheck the Toolbar option.
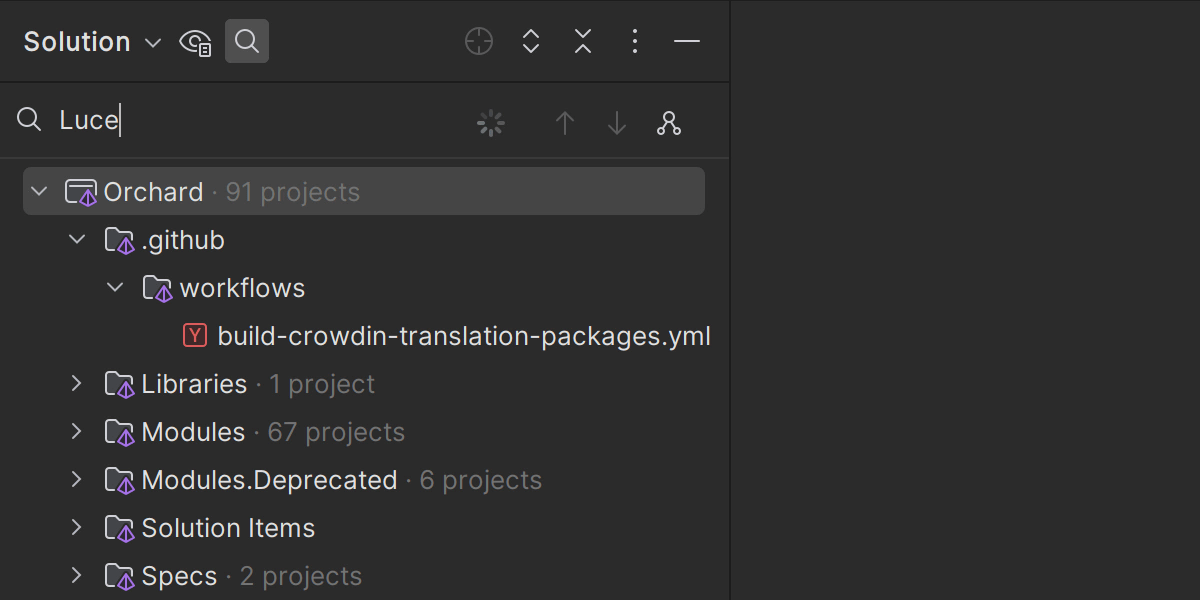
Speed Search shortcut
The Speed Search functionality, allowing you to quickly navigate within tool windows and dialogs, is now available via a shortcut. Once the focus is placed on a tree or list, you can easily invoke the search from the tool window’s Options menu by pressing ⌘+F on macOS, Ctrl+F on Windows or Linux, or simply by starting to type your query.
New product icon for macOS
With the release of Rider 2023.3, we’ve redesigned the Rider icon for macOS to align it with the standard style guidelines of the operating system.
Version control systems
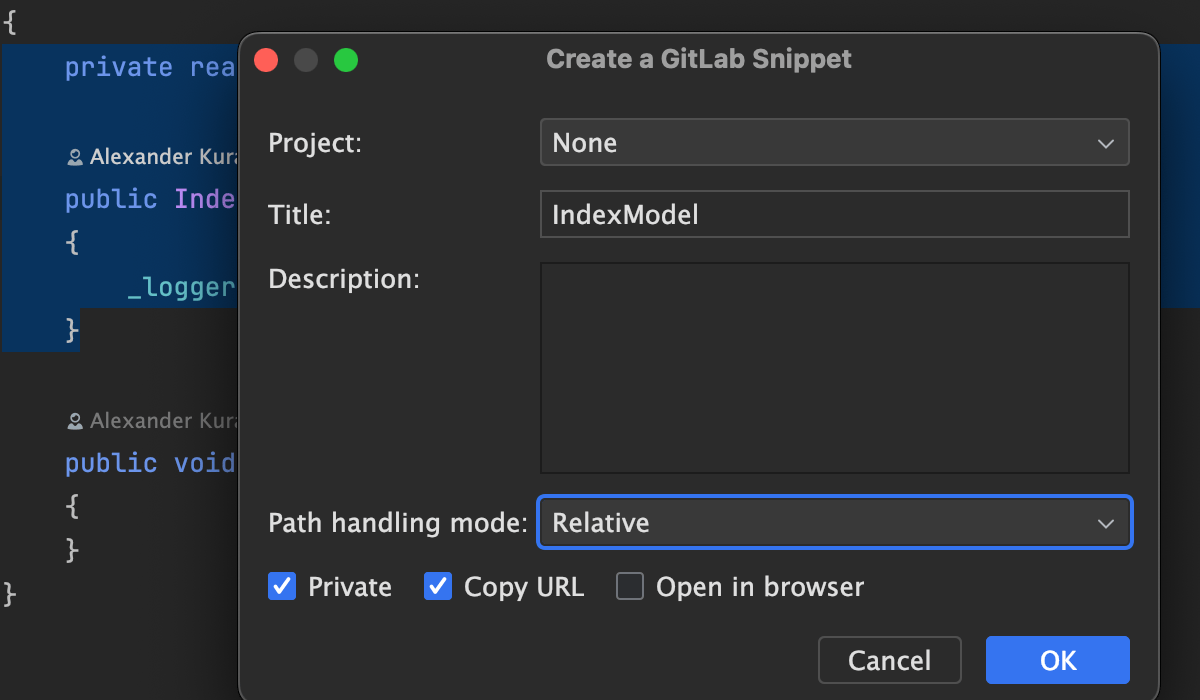
Support for GitLab snippets
Expanding the GitLab integration introduced with the Rider 2023.2 release, we’ve added support for GitLab snippets. Now, you can create public or private snippets directly within the IDE.
To create a new snippet, select a code fragment in the editor or a file or folder in the Project tool window, right-click on the selection to call the context menu, and choose the Create Snippet option. A dialog will appear, prompting you to provide general information about your snippet and define its privacy settings.
All-in-one diff viewer
Rider 2023.3 introduces a revamped way to review changes. Now, instead of going through each file one by one, you can see all of the modified files from a changeset in a single, scrollable frame. This new diff viewer is compatible with GitLab, GitHub, and JetBrains Space reviews.
Debugging
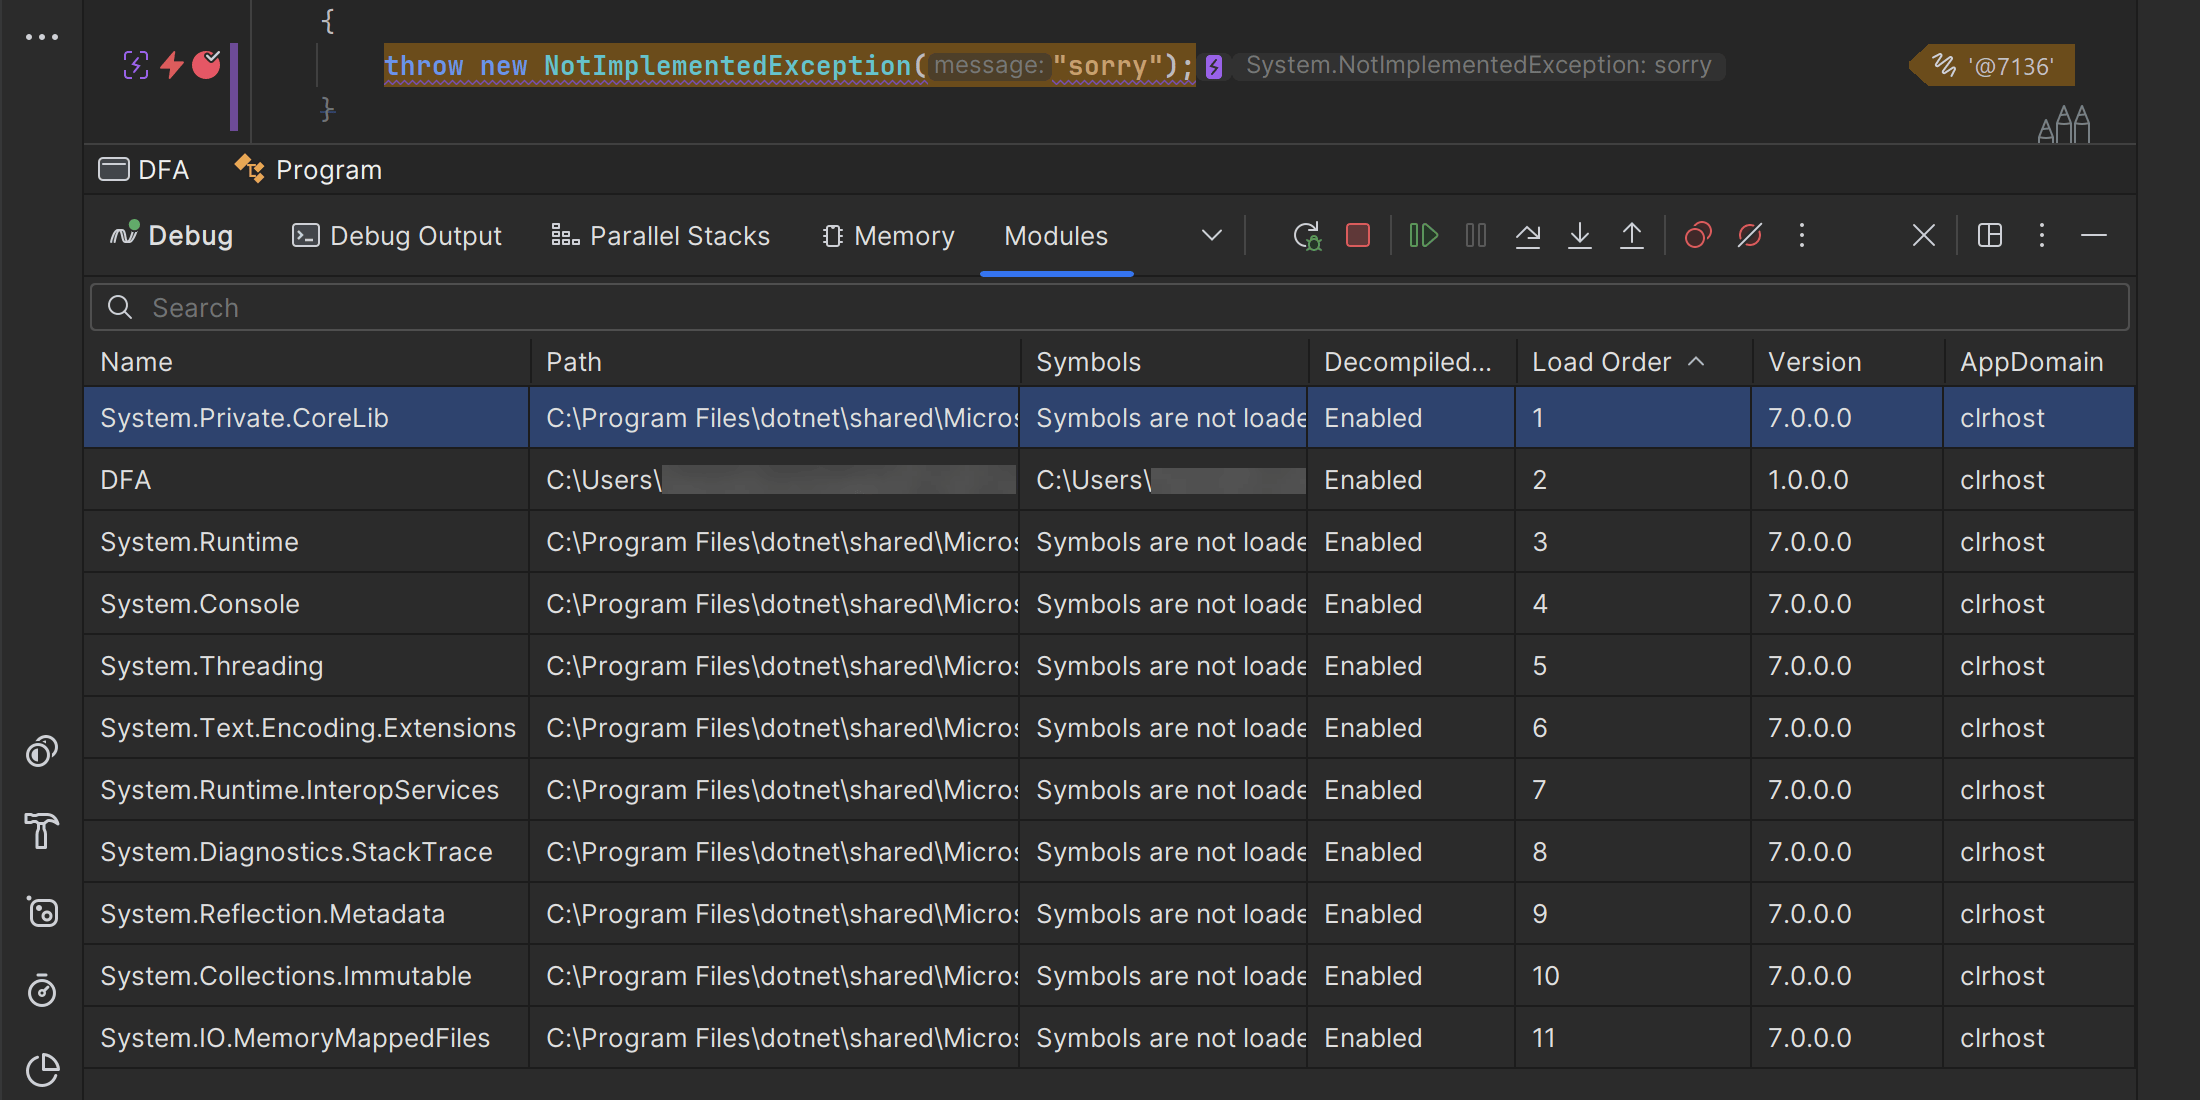
Modules view
The new Modules view lets you inspect the dynamic link libraries (DLLs) and executables that your app uses. In this view, you’ll find information such as module names, versions, application domains, paths to the module, and paths to module symbols.
The Symbols column lists the symbols used by the debugger for a specific module. You can manage module symbols by right-clicking a module row and selecting Load Symbols.
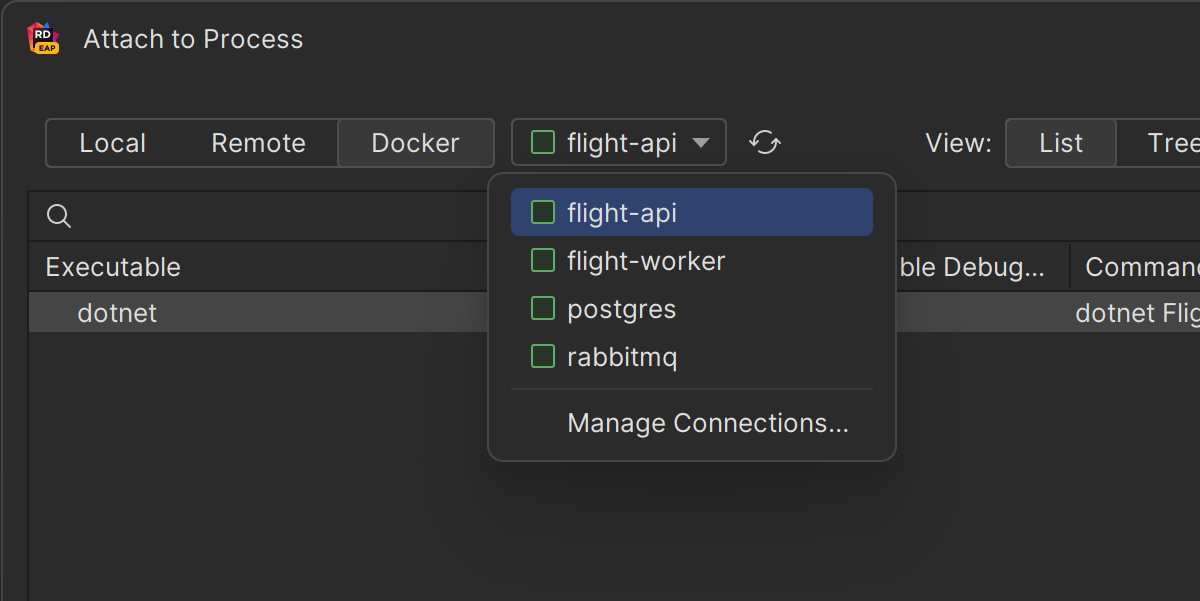
Attaching to a process inside a Docker container
Starting with Rider 2023.3, it is now possible to attach to a process inside a container for debugging. To do so, call up the Attach to Process dialog, go to the Docker tab, and select the target container. This new option will work in local environments and SSH configurations.
Game development
Unity
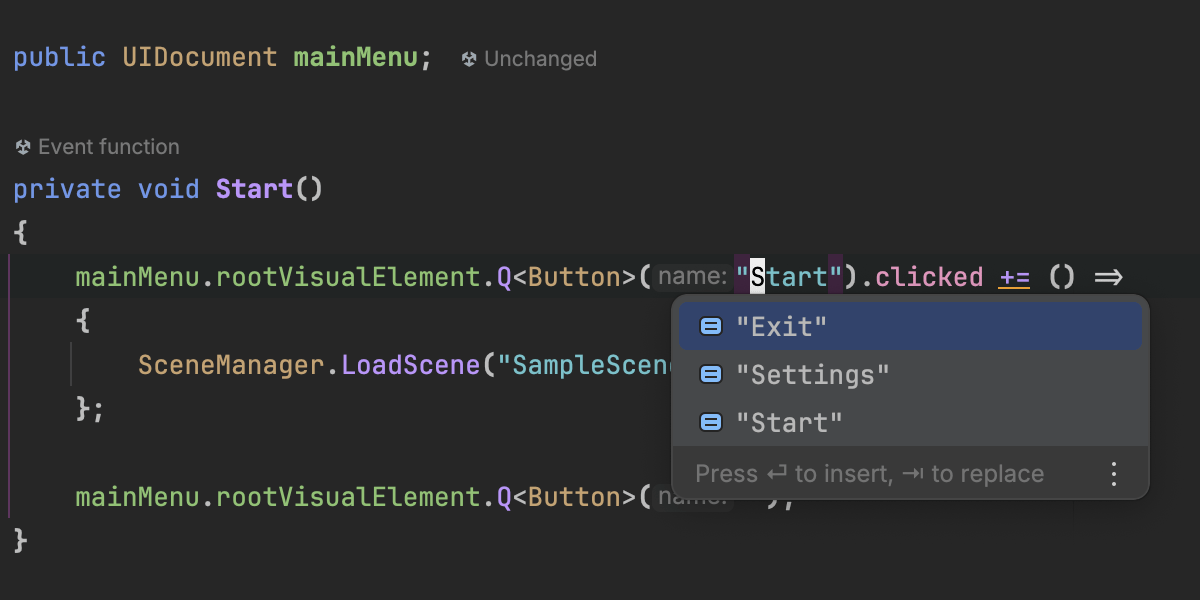
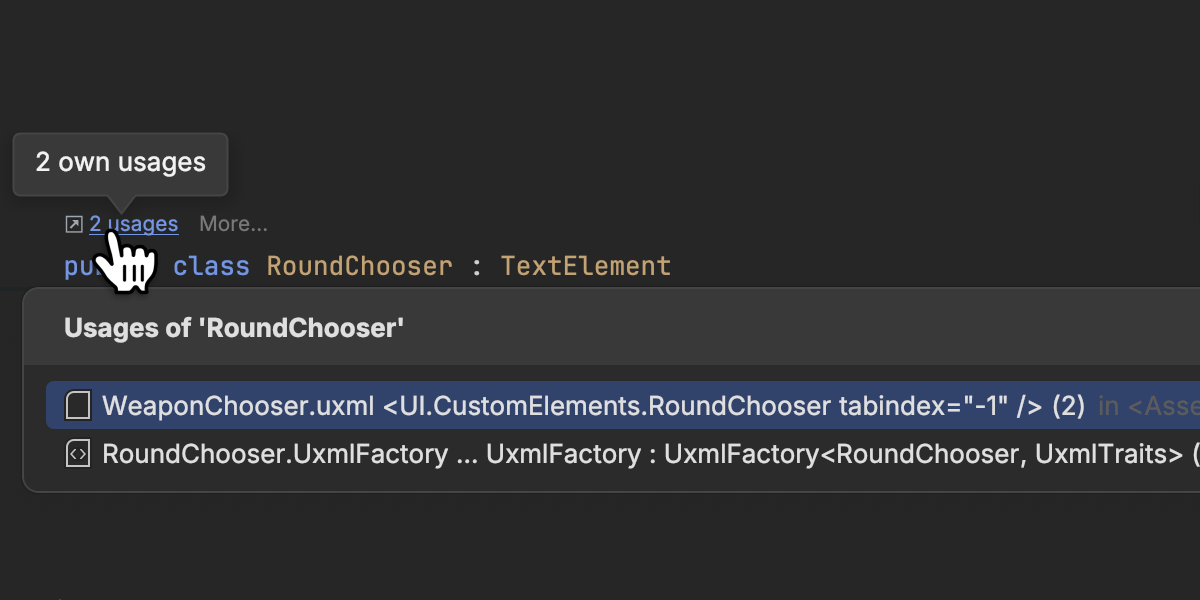
UI Toolkit support
Working with the UI Toolkit just got a whole lot more productive!
You can see where your UI elements are used in UXML files with Find Usages and use Ctrl+Click to navigate from elements in UXML files to C# code. What’s more, Rider also provides code completion for UI elements in C# queries.
This release also supports .tss theme files and includes up-to-date
knowledge of all USS properties for the latest Unity 2022.3 LTS version.
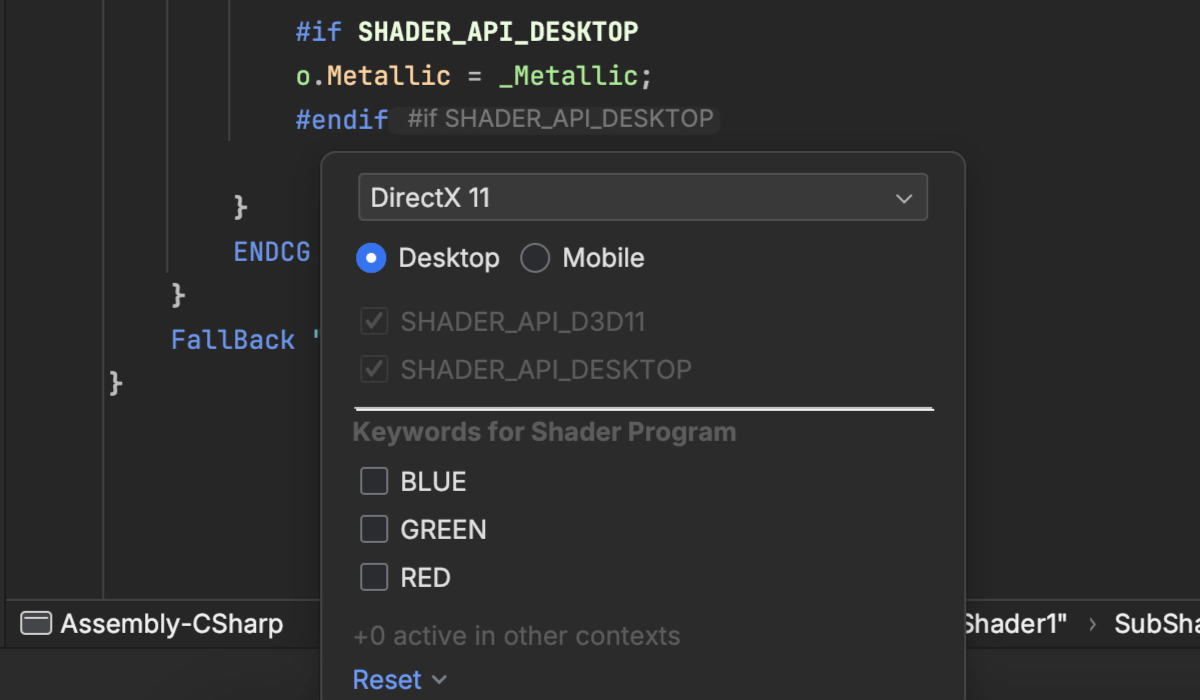
Shader variant support
A new optional preview feature allows selecting the keywords that are active while editing a shader file. This can enable different preprocessor blocks, allowing rich Rider editing features in previously disabled parts of the file.
Debugger updates
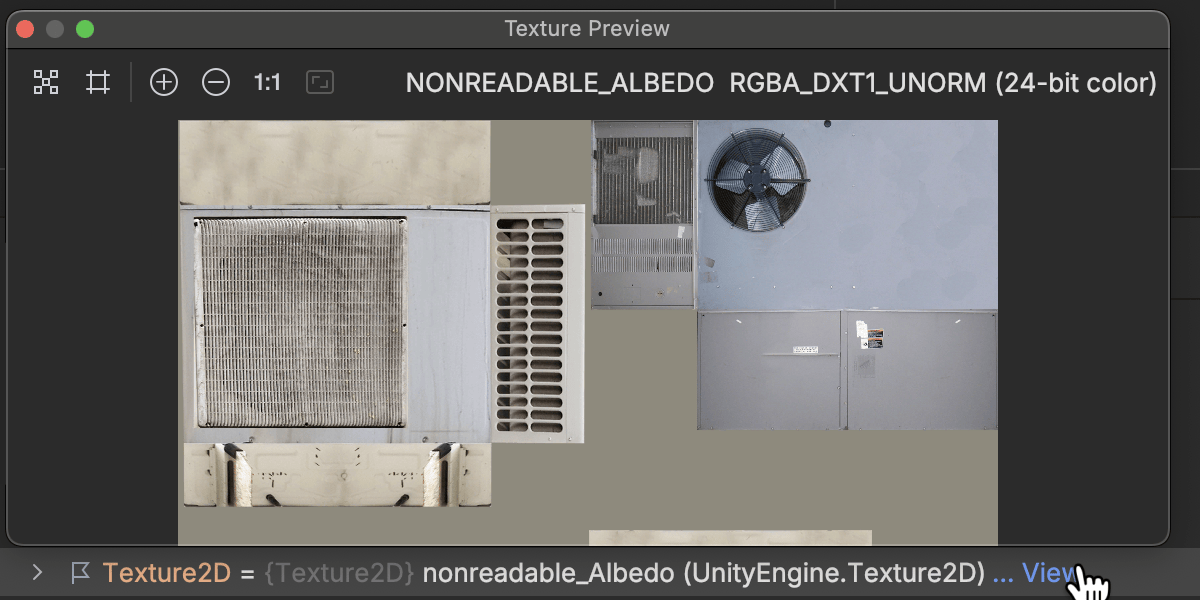
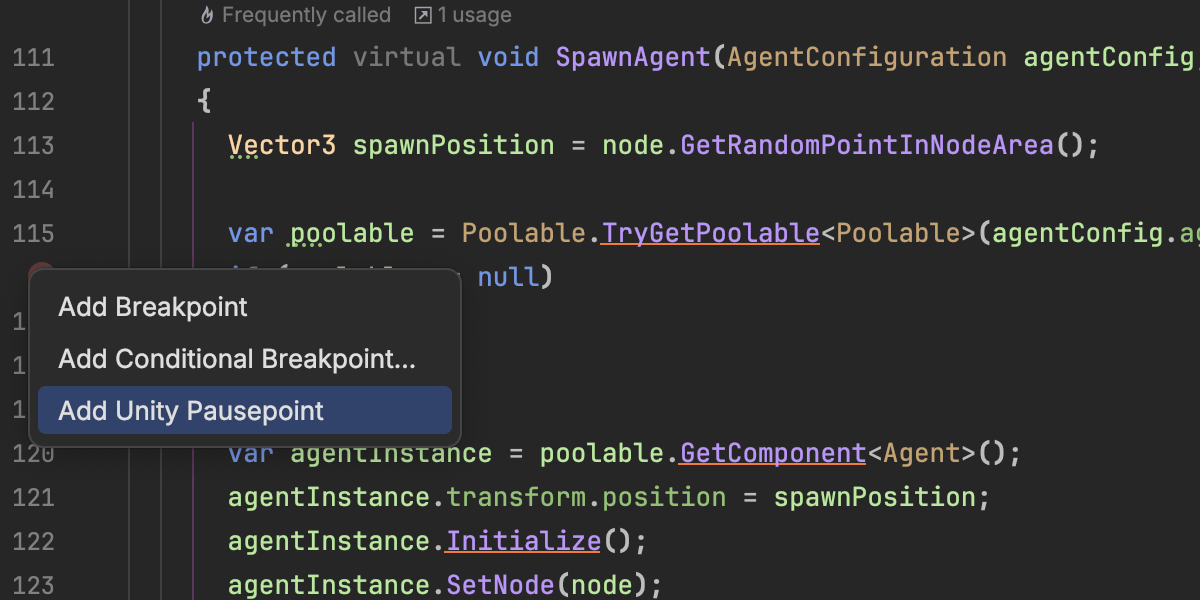
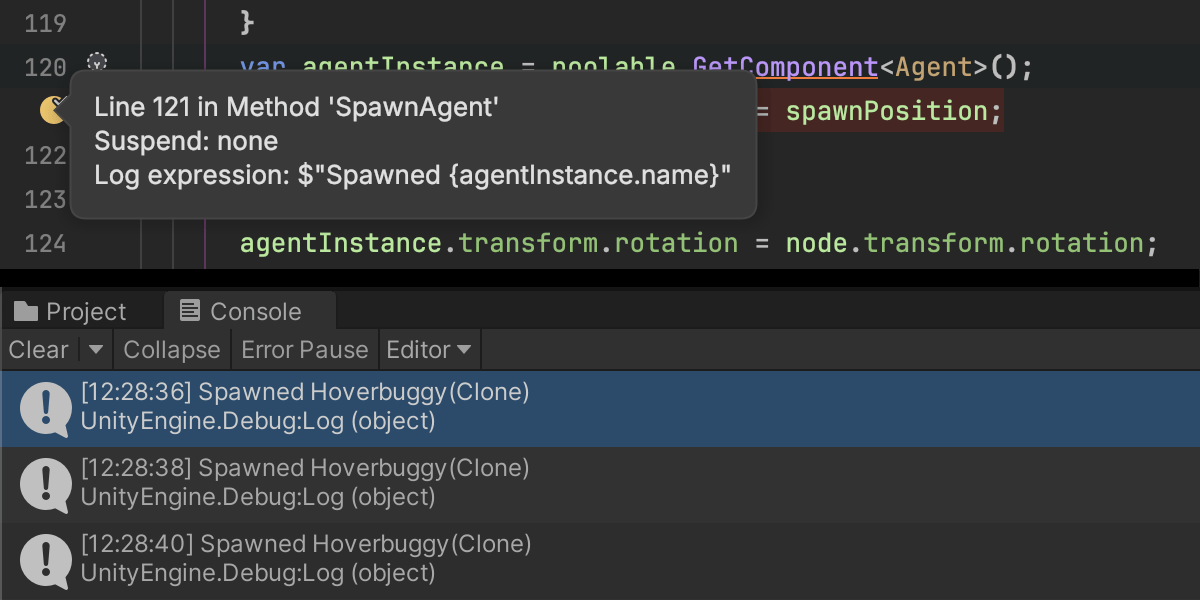
Unity debugging gets a lot more helpful with the ability to view textures in a new popup window. We’ve made it easier to add pausepoints from the editor’s context menu, and tracepoints will now also output to the Unity Console. Rider now correctly shows multiplayer virtual player instances in the Attach to Unity Process dialog, too.
Other updates
There are plenty more small fixes and features, such as completion of semantics in HLSL code, fixing the URL for online help for packages and incorrect warnings for certain DOTS scenarios. You can see the full list of changes in the changelog.
Unreal Engine
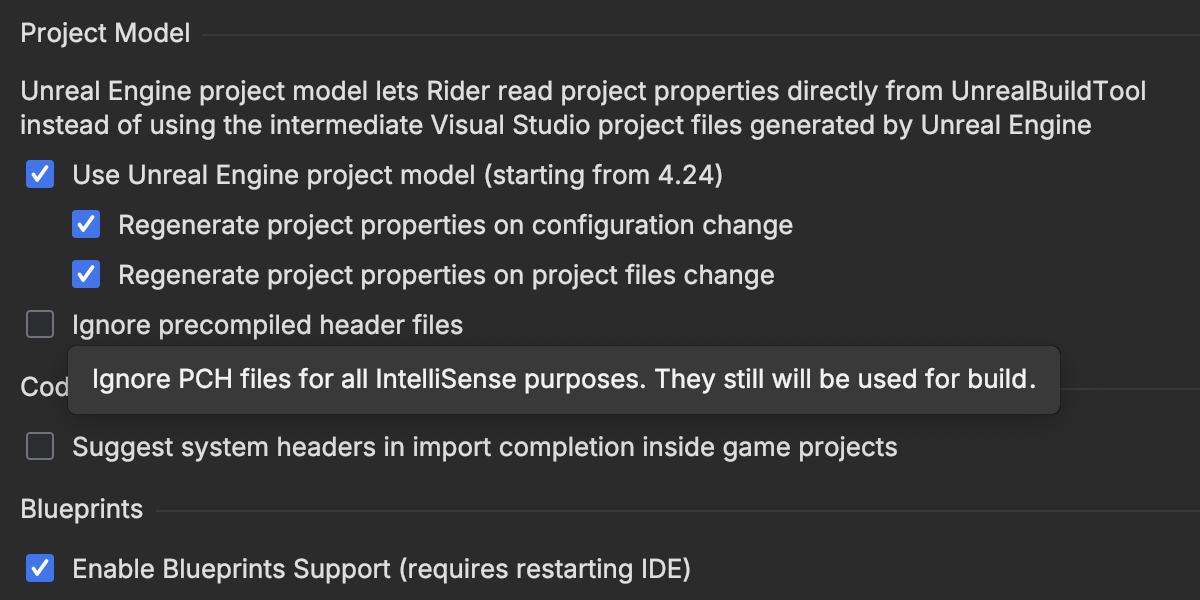
Option to ignore PCH files in analysis
A significant new feature allows Rider to only recognize symbols from explicitly included files and ignore anything imported by pre-compiled header (PCH) files. This allows local builds to use PCH files for improved compilation speeds while ensuring correctness for CI build servers.
Minor updates
This release also includes several smaller fixes and updates for issues including
some file names not being parsed as links in build output, the inability to
locate UE 5.3, and the incorrect display of FString and
TCHAR types in the debugger on Linux.
We’ve also fixed some issues with the popular Enhanced UE Documentation plugin, including formatting and an issue that prevented the standard documentation tooltip from being displayed.
Web development
Improvements for TypeScript
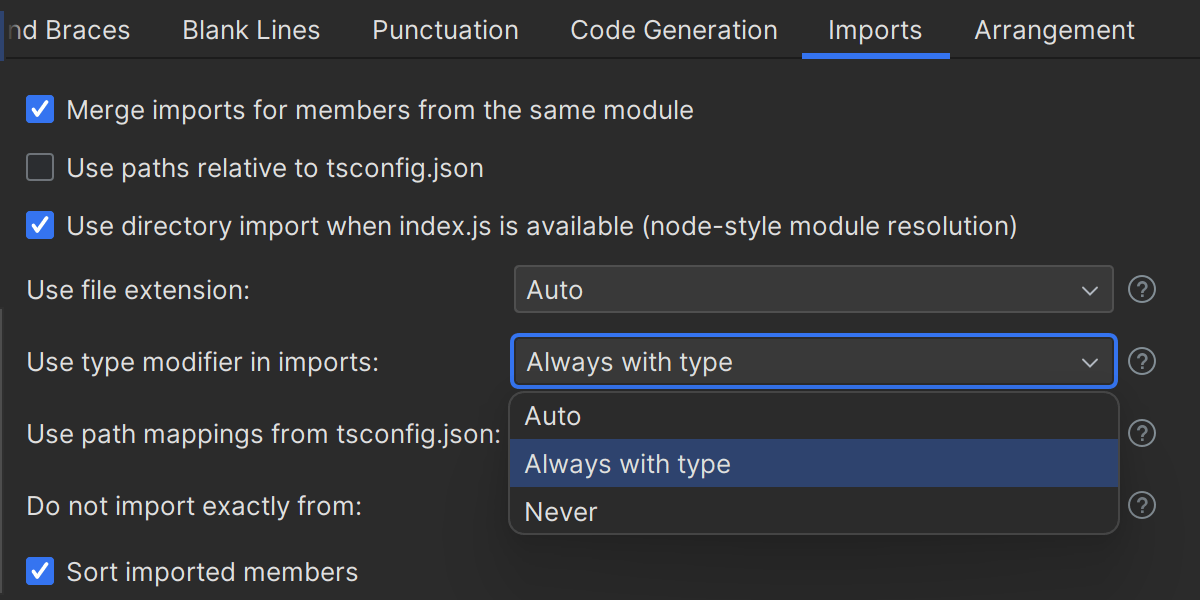
Rider 2023.3 solves some of the frustrating inconsistencies encountered when
adding import type statements and makes working with
verbatimModuleSyntax easier. We’ve added the option to
configure the usage of the TypeScript import type statement or type
specifier when importing a type. We’ve also added support for the exports
field of package.json for TypeScript files.
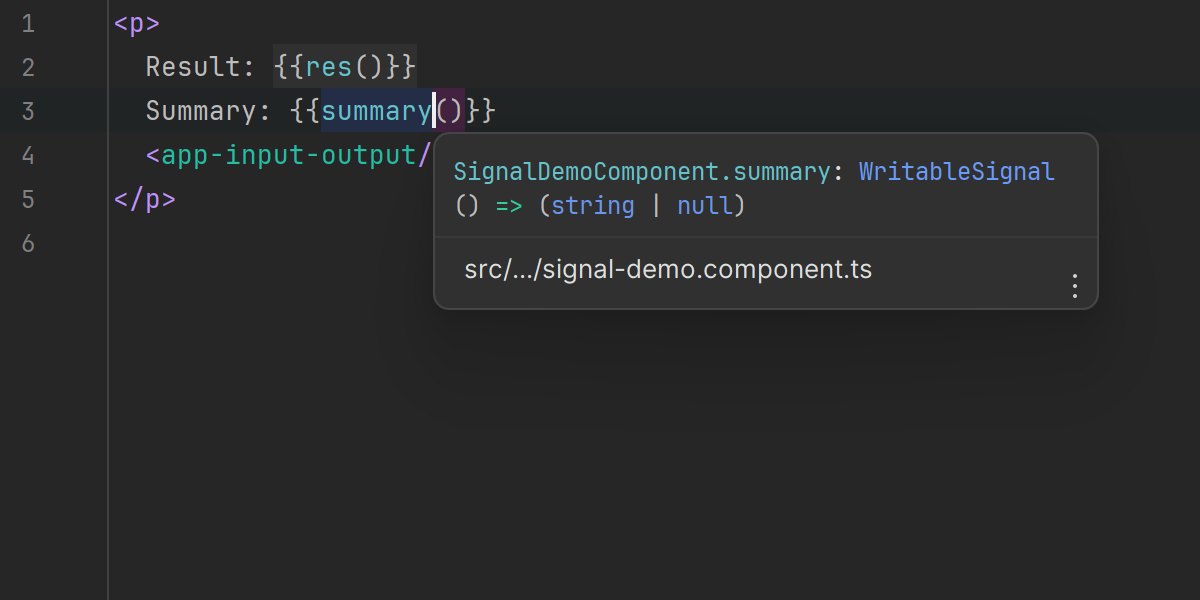
Improved Angular support
We’ve improved support for strictTemplate type checking in Angular
templates. We’ve also supported the new control-flow syntax from v17 and signals,
including live templates like signal, computed, and
effect. There are also new quick-fixes available with
Alt+Enter. For example, you can create @Input
and @Output properties from a component template.
HTTP Client
Support for @ variables
Rider 2023.3 supports the @ symbol for defining variables found in other IDEs.
For more information on the improvements in web development, please refer to this page.
F# support
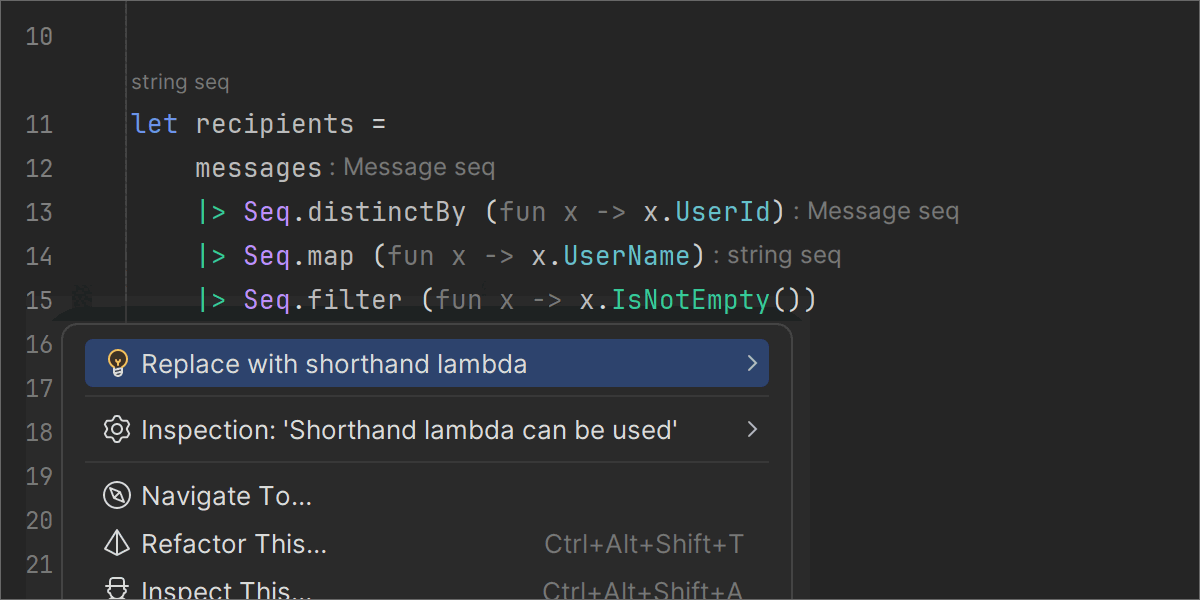
F# 8 support
We’ve added support for the language features that come with F# 8. There are some new analyzers and quick-fixes that suggest using newer syntax, like nested record updates or shorthand lambda expressions.
Rewritten F# project model
We’ve rewritten how the project model is synchronized between the ReSharper engine and F# compiler service to fix various issues like false-positive errors due to missing references or possible analysis freezes. It also improves analysis performance for many cases when F# projects reference C# ones.
Miscellaneous
Thanks to your issue reports, we’ve also made smaller improvements in existing analyzers and quick-fixes, code completion, and other areas. Read the full notes on the F# plugin page.
Frameworks and technologies
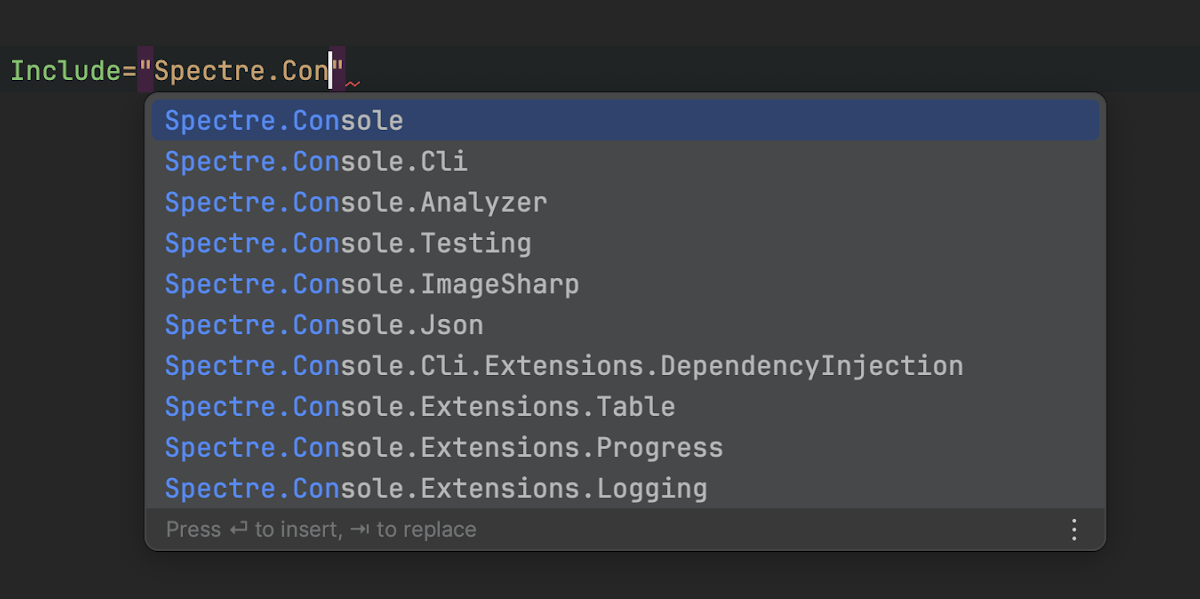
Code completion for Central Package Management
With this release, we’re introducing enhanced support for your CPM files with code
completion features for NuGet package names and versions. These files now see the
same support as in a .csproj file. These changes should help developers
more quickly and accurately manage package references. See
our blog post on Central Package Management
for a clearer understanding of this relatively new feature.
Support for rootless containers
.NET base images now include a non-root user. Rider 2023.3 will generate Dockerfiles with this user by default for projects targeting .NET 8. Debug and Fast mode are also supported.
Bicep support
We’ve introduced initial support for Bicep, an Infrastructure as Code language tailored to Azure. It translates into Azure Resource Manager (ARM) templates and is intended for close integration with Azure services. The IDE now offers code highlighting along with code completion that is facilitated through the language server protocol for Bicep.
Working with databases
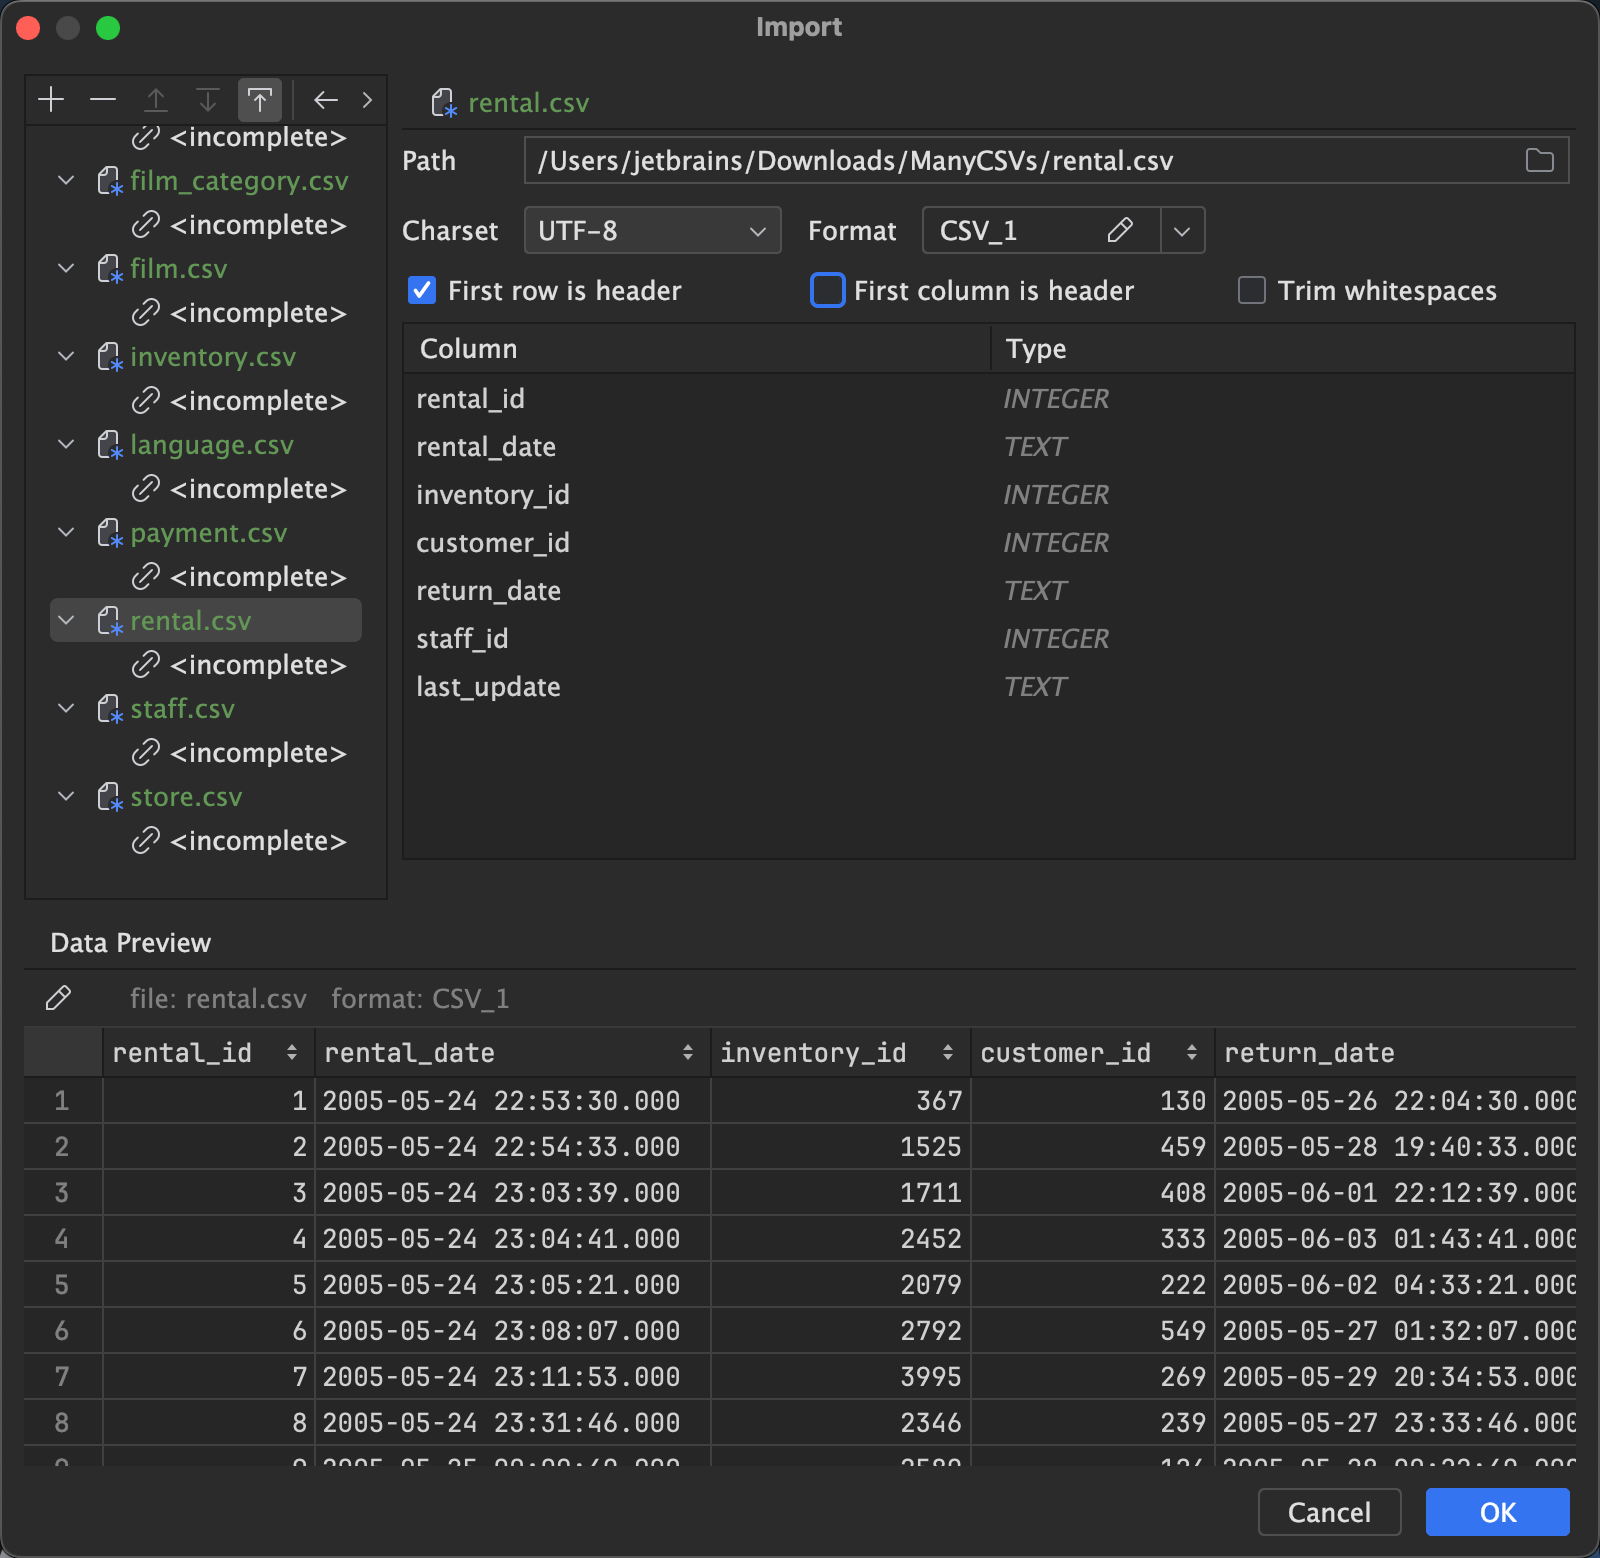
Some of the most notable improvements for working with databases using Rider 2023.3 are:
- A reworked import functionality
- Support for import/export tables via BCP SQL Server
- Support for new objects SQL Server
For more information on the improvements for working with databases, please refer to this page.
Plugins
Dynamic Program Analysis
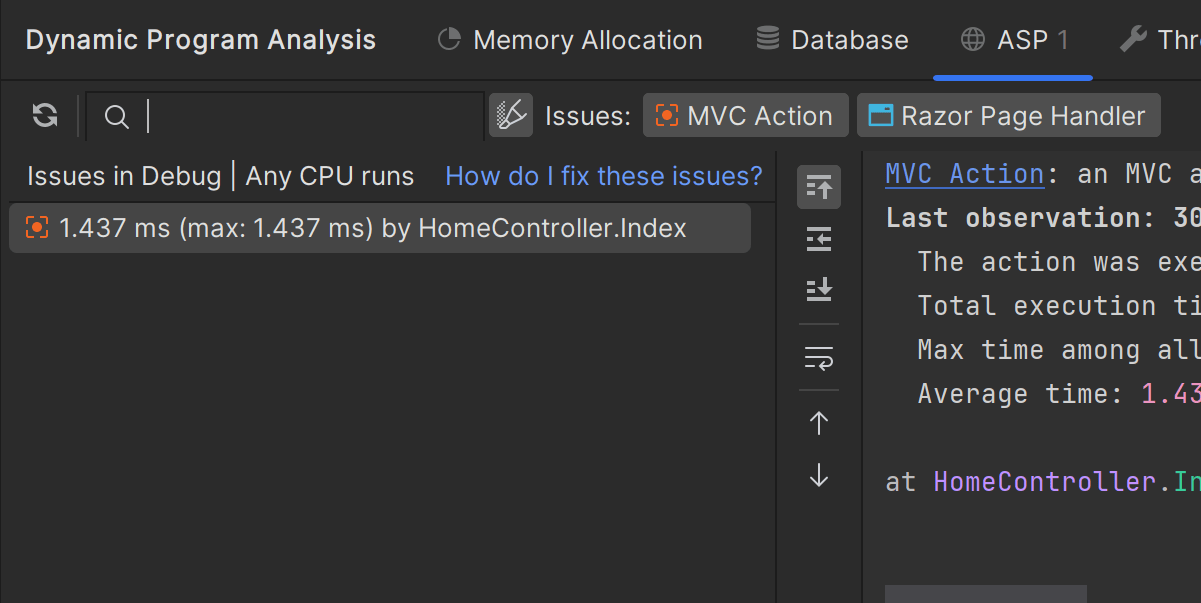
New ASP.NET Core inspections
Dynamic Program Analysis has received three new inspections for applications targeting the ASP.NET Core framework. These inspections alert you to potential backend performance issues that could make your application less responsive.
Learn more from this blog post.
dotTrace dotUltimate
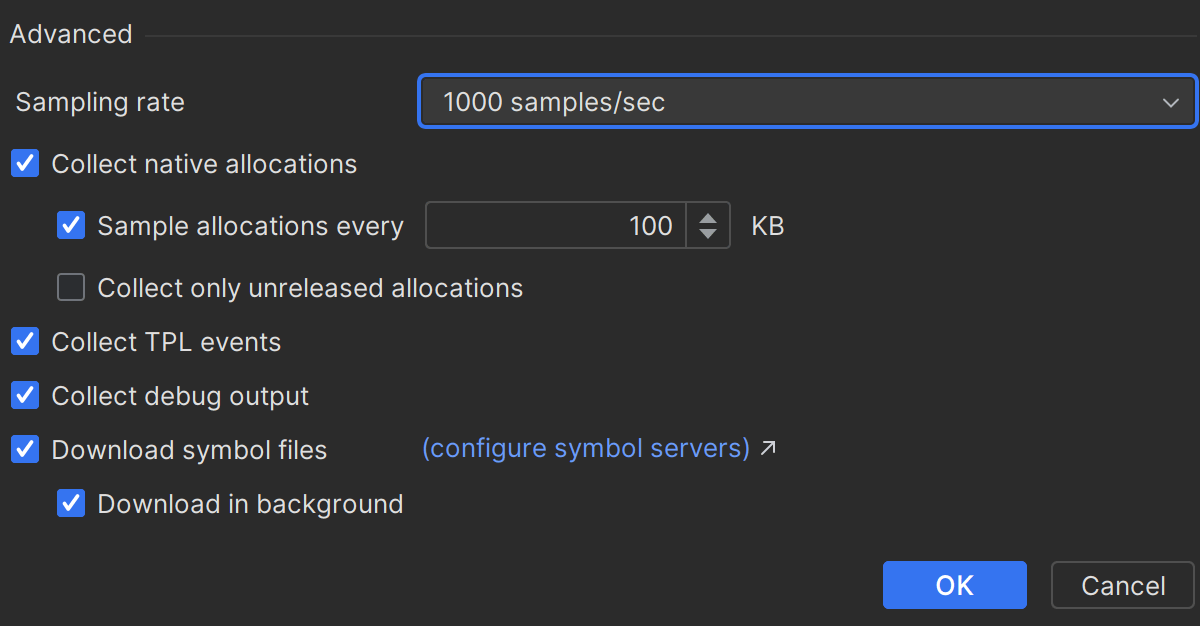
Improved configuration of the Timeline profiling mode
This release introduces advanced options to the Timeline profiling mode when using Rider’s built-in dotTrace profiler. The new options are:
- Sampling rate – lets you find the optimal balance between the performance of the profiled application and data accuracy. Fast sampling mode is also now supported.
- Sample allocations every ... KB for native allocations – helps you improve the performance of snapshot analysis by reducing the amount of collected data, i.e. snapshot size.
- Download in background for native symbol files – downloads symbol files during the profiling session to reduce the time it takes to take a snapshot.
dotMemory dotUltimate
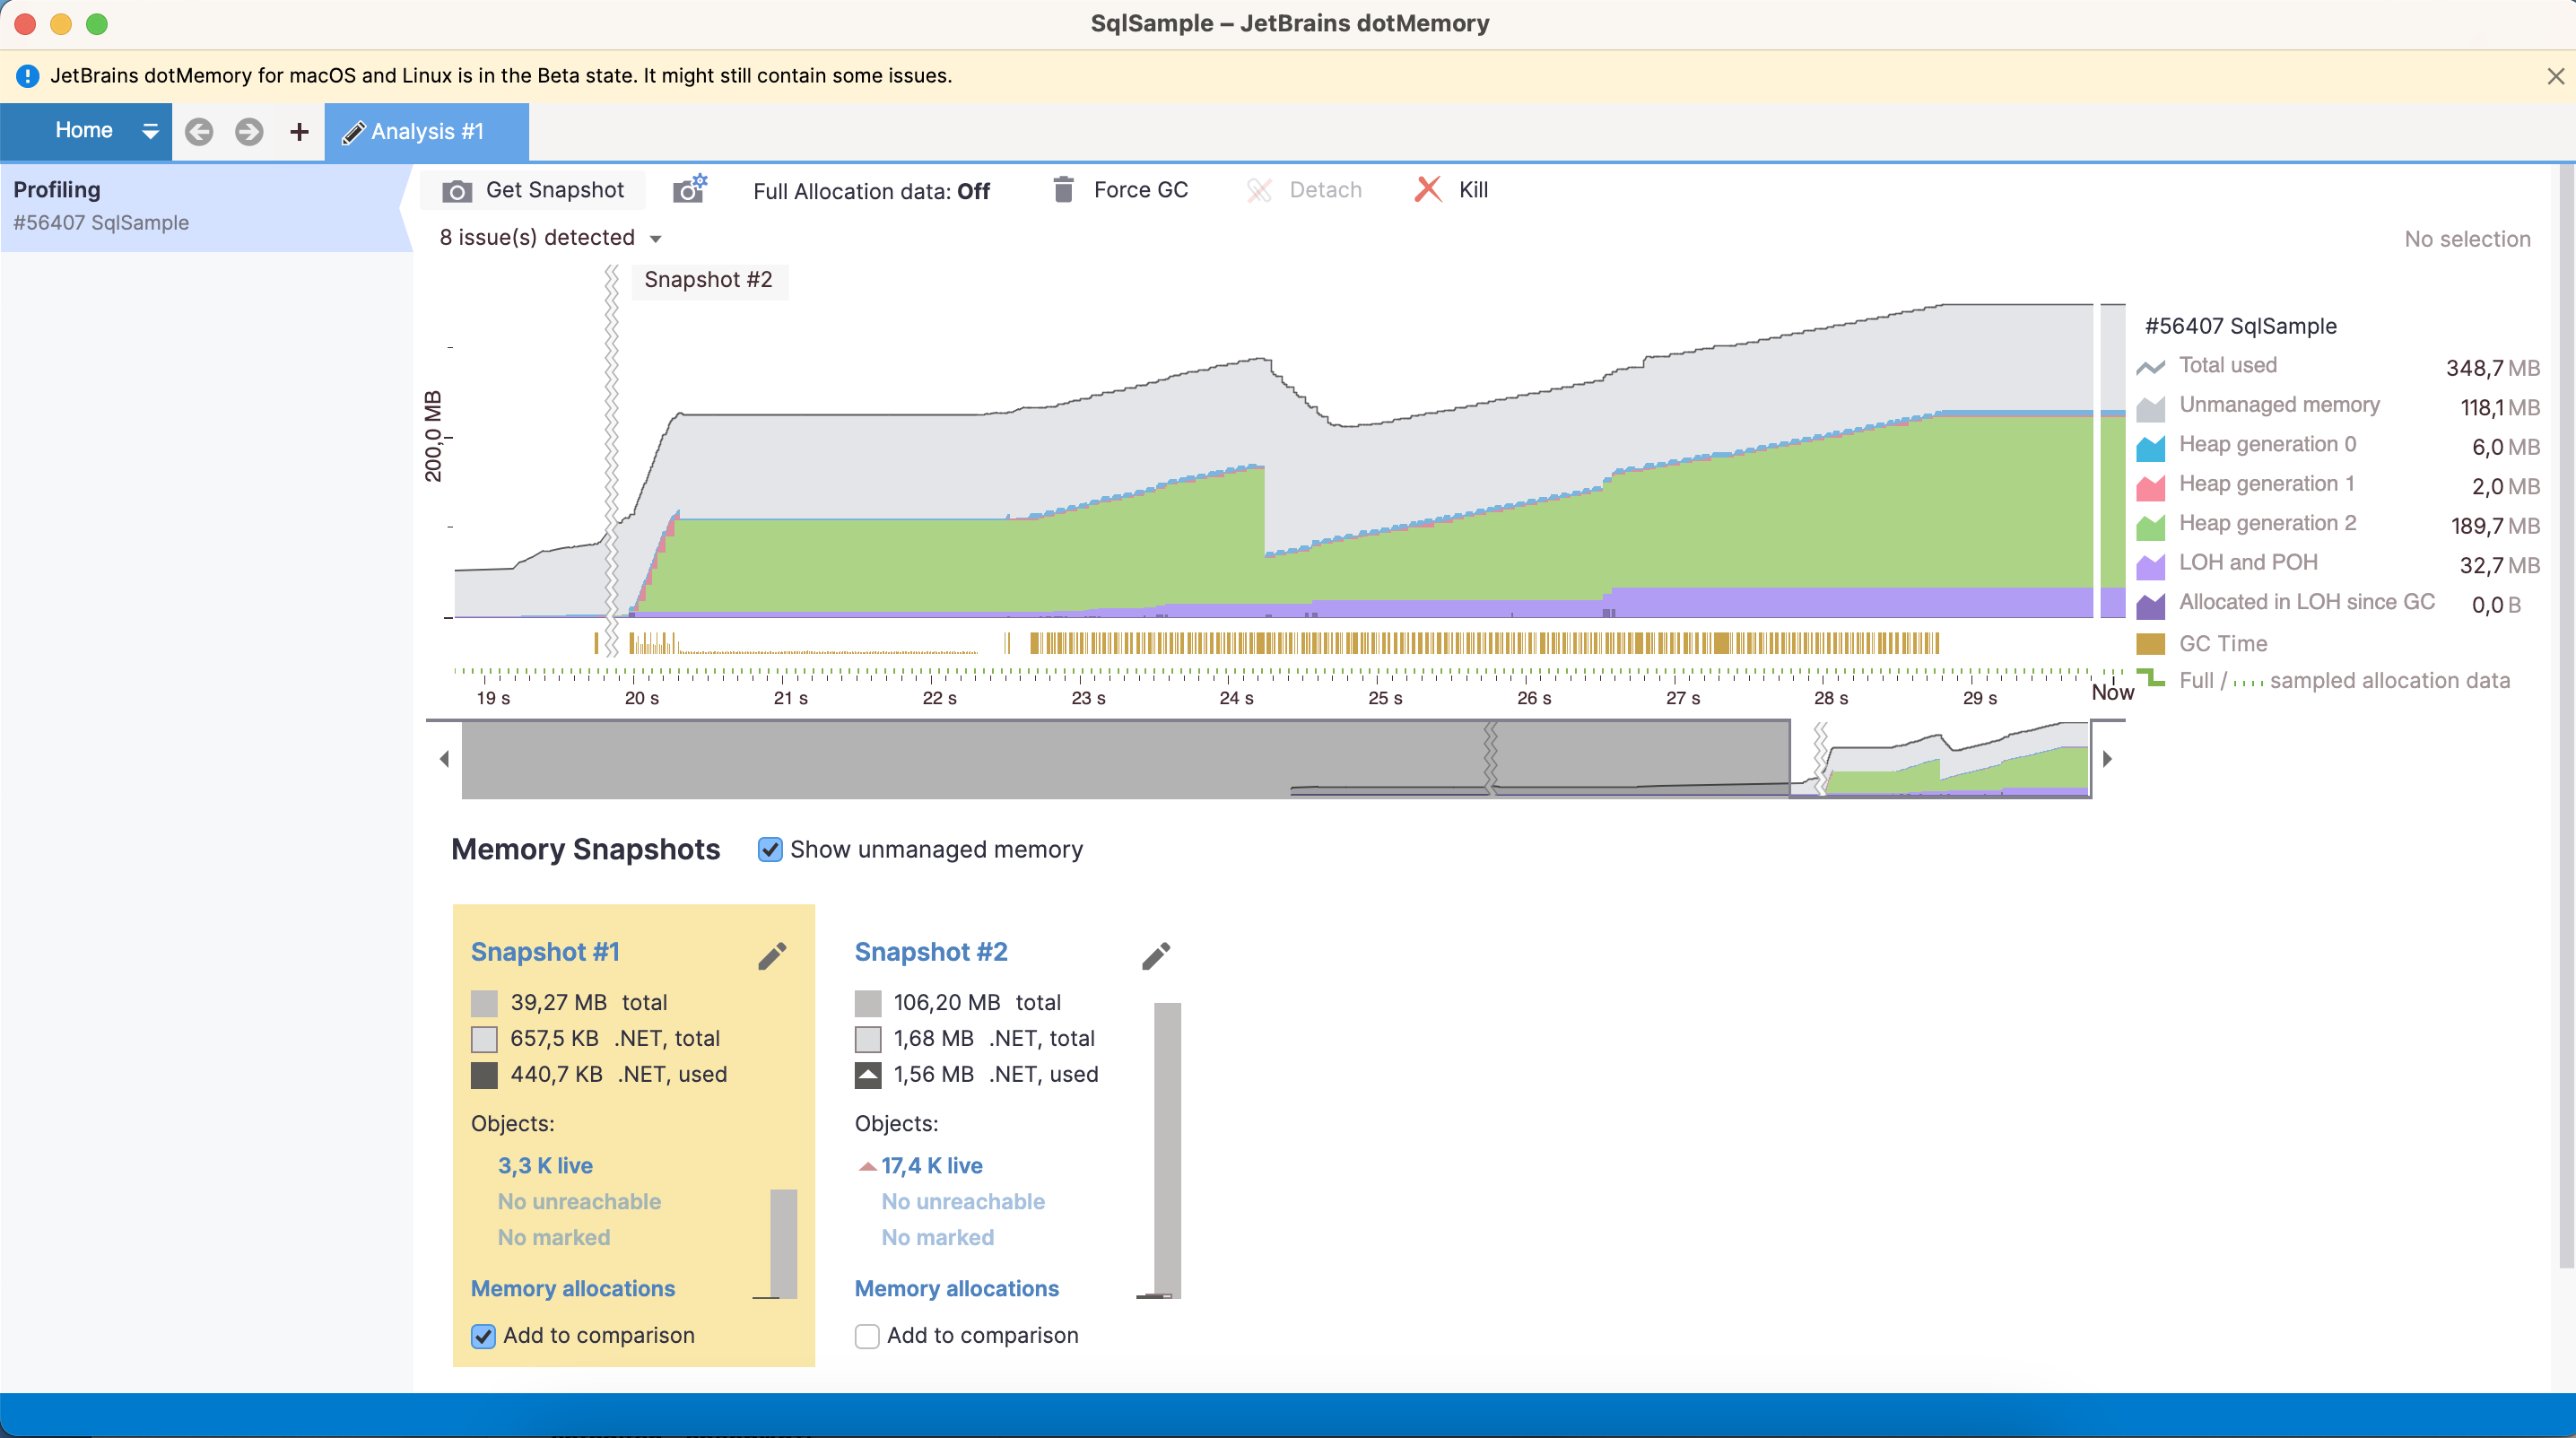
- It is now possible to import and analyze process dumps inside the profiler running on Linux.
- Now, you can run the standalone version of dotMemory on Linux and macOS operating systems.
Entity Framework Core UI
The UI for Entity Framework Core commands are now available inside JetBrains Rider. These are just a few of the commands the bundled plugin can assist you with:
- Creating migrations.
- Updating databases with selected migrations, including autocompletion of migration names.
- Creating DbContext scaffolding from existing databases.
- Creating SQL scripts from the migration range.
Miscellaneous
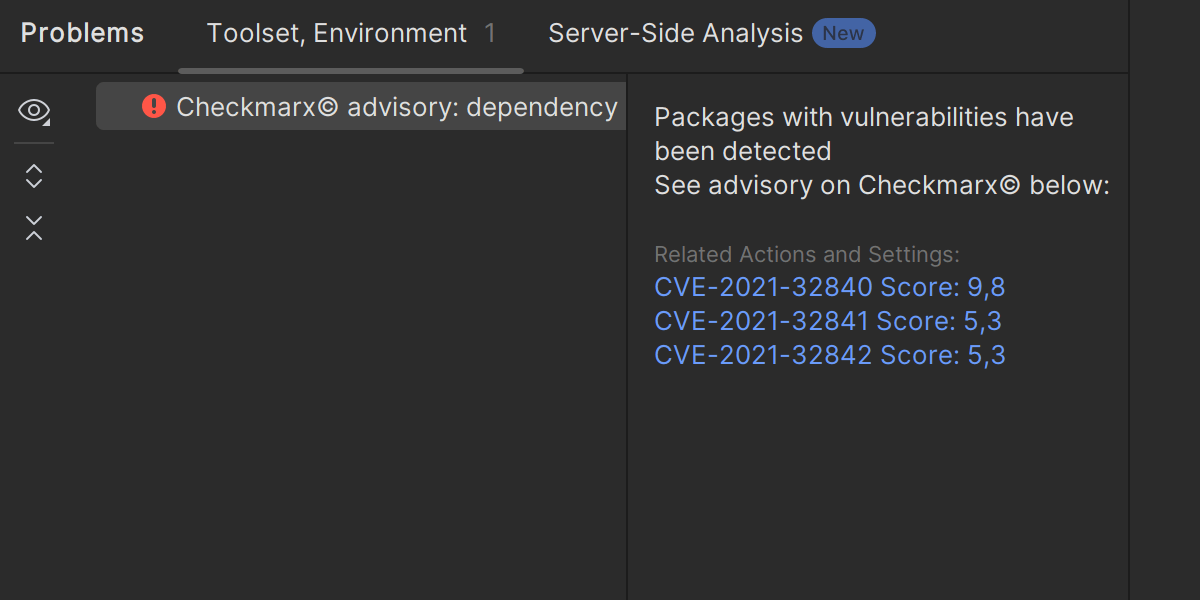
New inspections for identifying vulnerable API usages Security
Rider 2023.3 brings a new security inspection feature designed to make published vulnerabilities more apparent and easier to understand.
The new inspections identify vulnerable NuGet packages in your project and highlight instances where vulnerable methods from these libraries are used in your code. If a vulnerability is detected, the system highlights the problematic code and offers quick actions to remedy it. These actions include recommending an update to a newer package version and offering in-depth information about the detected vulnerabilities.