Code analysis
ReSharper provides continuous code quality analysis in C#, VB.NET, XAML, XML, ASP.NET, ASP.NET MVC, ASP.NET Core, HTML, ResX and Protobuf. Errors and problems are detected instantly, before you even compile.
Continuous code quality analysis
ReSharper applies over 2200 code inspections to your code at design time so you can instantly see whether your current file or even your whole solution contains any errors or problems.
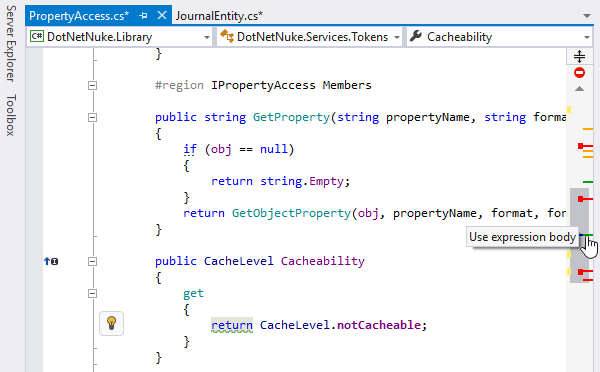
ReSharper highlights detected errors and problems right in the Visual Studio editor, and additionally visualizes them using the Marker Bar on the right.
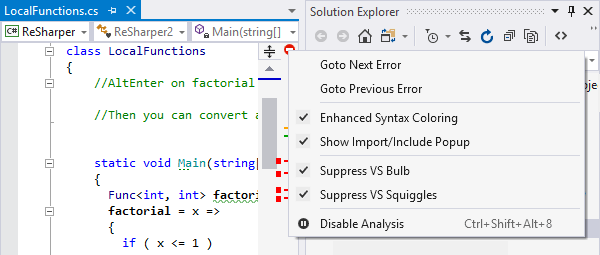
The Status Indicator at the top of the Marker Bar changes its color and icon if the file contains errors or problems. With a right-click on the icon, you can quickly toggle ReSharper code analysis, identifier highlightings and Visual Studio code analysis, as well as navigate between issues of the highest severity level.
Errors
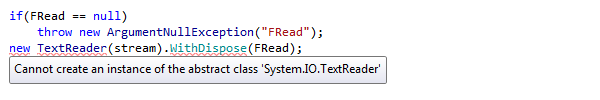
ReSharper instantly detects and highlights errors as you code, right in the editor.
Errors are highlighted with either red font or curly underline. If you roll the mouse pointer over an error, its description is displayed in a tooltip.
ReSharper is capable of detecting errors not only in plain C# or VB.NET code, but in ASP.NET code-behind files, references in markup files, and ASP.NET MVC calls.
For XAML, ReSharper checks XML syntax and expertly validates XAML semantics, including references between XAML entities.
In build scripts (NAnt and MSBuild), ReSharper analyses and highlights unknown properties, targets, tasks, and attributes.
Code inspections in HTML and XML are also available.
Warnings
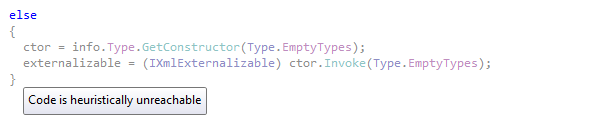
In addition to compiler errors and warnings, ReSharper displays its own warnings that don't prevent your code from compiling but may nevertheless represent serious coding inefficiencies. For example, ReSharper informs you about redundant casts, incorrect format strings, declared but never used local variables, etc. Constructs that have associated warnings are emphasized with either grayed text or a blue curly underline.
Suggestions
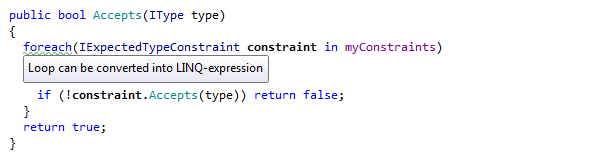
A deeper level of code analysis is available with code suggestions. Suggestions provide insights into code structure, drawing your attention to things that aren't necessarily bad or wrong, but probably useful to know. Suggestions are highlighted by green curly underline.
For instance, you may be interested to know that a certain parameter can be declared with base type, meaning that your method only uses members of the parameter's base type. ReSharper can also suggest to create an auto-property from a property with backing field, convert a static method invocation to extension method call, or use 'var' keyword when possible.
Hints
The final and least intrusive level of code highlighting severity is hint. Unlike errors, warnings and suggestions, hints are not taken into account when you navigate to the next or previous highlight, not shown in the Marker Bar and therefore do not influence the color of the Status Indicator.
A hint simply brings your attention to a particular code detail and recommends a way of improvement. Code items that have associated hints are highlighted with a dashed green underline.
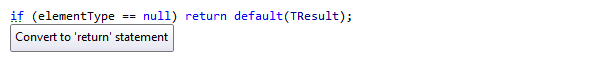
Quick-fixes for code issues
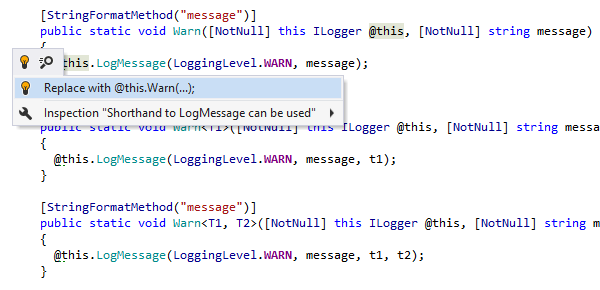
ReSharper comes with 1200+ quick-fixes that help you instantly repair most of detected code issues in all supported languages. Applying a quick-fix is as simple as pressing Alt+Enter at a highlighted code issue and choosing the appropriate way to fix the problem or improve the suboptimal code.
Solution-wide inspections
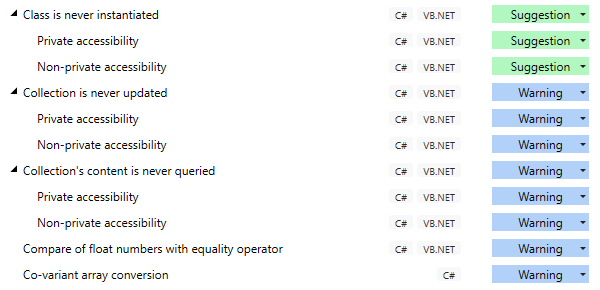
Solution-wide warnings and suggestions help you detect unused non-private members on the fly. These inspections only work when you let ReSharper analyze your whole solution. Look for the issues highlighted in your code and on the Marker Bar. Specifically, you can discover:
- Unused non-private declarations.
- Unused return values of non-private methods.
- Unaccessed non-private fields.
- Unused parameters in non-private members.
- Abstract or virtual events that are never invoked.
- Unassigned fields.
- Members and types that can be made internal instead of public.
In addition, code annotations are available that you can use to mark certain non-private types and members if they are left unused intentionally, to prevent ReSharper from fussing about them.
Disabling and configuring code inspection items
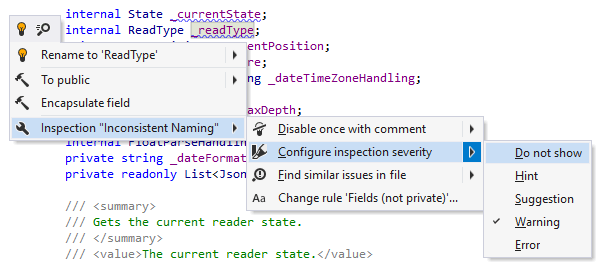
At any time, you can change severity of different analysis items — for example,
make ReSharper display a
particular inspection/notification as error, warning, code suggestion, or hint,
according to your individual
coding style or corporate requirements.
Even more, sometimes you know better that a particular piece of code
is just fine and no warnings are necessary, so you can simply disable a certain warning.
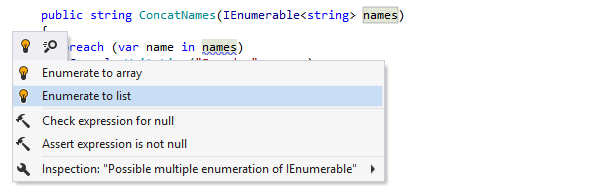
To disable or configure code inspection items, use the page of ReSharper options. You can also configure a particular warning, suggestion, or hint using the Options for inspection menu in the action list that you invoke by pressing Alt+Enter.
Navigating between highlighted code items
Each error, warning, or suggestion is represented by an individual stripe on the Marker Bar. Clicking the stripe navigates you directly to the line of code that contains the error or causes the warning/suggestion.
You can navigate between errors, warnings and suggestions by pressing Alt+PageDown (forward) and Alt+PageUp (backward). You can also navigate between just errors (skipping any warnings and suggestions) by pressing Shift+Alt+PageDown (to next error) and Shift+Alt+PageUp (to previous error). A message describing the current error, warning, or suggestion is displayed in the status bar.
There's also an alternative way of navigating between code issues: you can find all code issues in a certain scope, and explore them in a dedicated tool window.
Your custom code inspections
ReSharper provides Structural Search and Replace to find code that matches a certain pattern, and optionally replace it with code matching another pattern. Even more exciting is that ReSharper can continuously monitor your solution for your search patterns, highlight code that matches them, and provide quick-fixes to replace the code according to your replace patterns.
That essentially means that you can extend ReSharper's own set of code inspections with your custom inspections. For example, if you're migrating to a newer version of a framework, you can create search patterns to find usages of its older API and replace patterns to introduce an updated API.

Monitoring errors with solution-wide analysis
Not only is ReSharper capable of analyzing open files in design time, but it can extend its analysis skills to cover your whole solution.
Suppose that you changed the visibility of a member from public to internal, assuming that it was only used inside the current assembly. At this stage, ReSharper finds no errors in the current file. Then, you switch on Solution-Wide Analysis and ReSharper discovers that something went wrong. You jump to the next error in solution and you find out that someone used this member from outside of the current project.
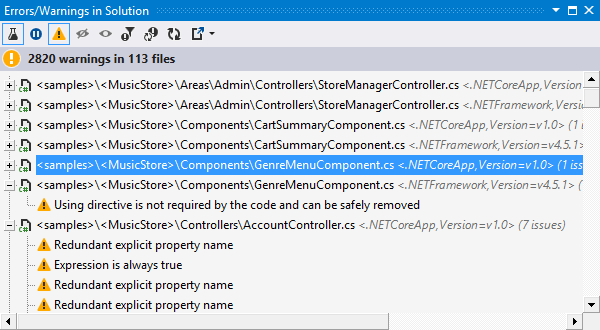
All you have to do is explicitly switch Solution-Wide Analysis on, and then, after it analyzes the code of your solution, view the list of errors in a dedicated window.
Even without opening that window, you can still easily navigate through errors in your solution with Go to Next Error/Warning in Solution (Shift+Alt+PageDown) and Go to Previous Error/Warning in Solution (Shift+Alt+F12) commands.
Monitoring warnings with solution-wide analysis
As soon as the last error in the solution is fixed, the red status bar indicator turns
green.
However, solution-wide analysis can help you further improve code quality in your
solution -
click Include Warnings
![]() in
the error
view and ReSharper will
start
monitoring warnings
(both compiler warnings and those detected with ReSharper's inspections with
Warning severity level) in the entire solution.
in
the error
view and ReSharper will
start
monitoring warnings
(both compiler warnings and those detected with ReSharper's inspections with
Warning severity level) in the entire solution.
If errors appear in your solution again, warnings will be automatically hidden so that you could concentrate on fixing errors. Warnings will be shown again when all errors are fixed.
Call Tracking
In the past, attempting to track call sequences in code could end up with lots of Find Results windows and lost context. To address this problem, ReSharper can visualize the entire call sequence in a single tool window. This is called Call Tracking, and it enables you to view and navigate through call chains in your code.
Thanks to support for events, interfaces, and closures, ReSharper's Call Tracking is a substantial improvement over Visual Studio's own Call Hierarchy.
To visualize a call sequence, choose or , or use the Inspect This shortcut feature.
Find Code Issues
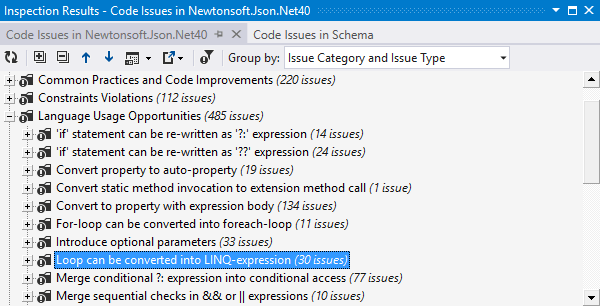
ReSharper lets you find all code quality issues, redundancies, language usage opportunities, and code improvement suggestions from a single tool window called Inspection Results.
To find code issues in a certain scope, choose or . Alternatively, select a node in the Solution Explorer, right-click it, and choose Find Code Issues.
The Inspection Results window lets you filter detected issues, regroup the result by issue type, severity, category and other properties, and export the results to a file.
Value Tracking
Value Tracking gives you important information about data flow in your program. At any location in your source code, you can point to a variable, parameter, field or property and ask ReSharper to inspect it. You will then see how its value flows through your program, back to its sources or straight to consumers.
Value Tracking helps you determine how a certain incorrect value might have passed to a given point in your program, and where it might be passed next. This helps you investigate possible NullReferenceExceptions, inappropriate behavior and reasons why you get incorrect values.
To visualize data flow that a certain value takes part in, choose or , or use the Inspect This shortcut feature.
Code annotations
Sometimes, even a code analysis engine as powerful as ReSharper's lacks knowledge that
is necessary to detect certain problems.
For example, if a method is designed to never return null
and its clients are designed accordingly, no code analysis will find a possible issue
if someone has changed the method to return null.
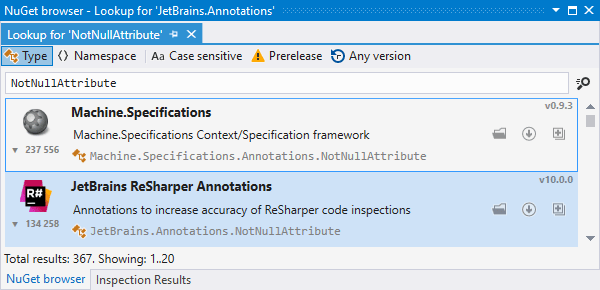
In this and a lot of other cases, the JetBrains.Annotations
framework helps spot problems that can't otherwise be inferred.
Attributes declared in this framework can make ReSharper analyze code the way you need
it.
To use ReSharper code annotation attributes in your source code, install the
corresponding
NuGet
package.
You can do it by just adding the using JetBrains.Annotations; directive,
and ReSharper will help
you automatically
fetch the package.
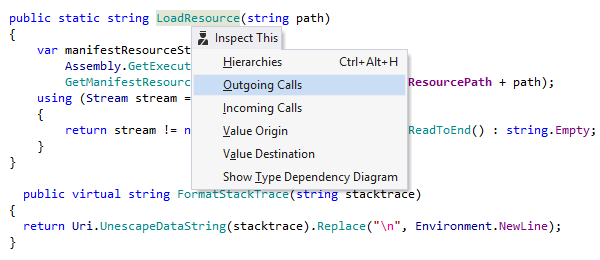
Inspect This
Inspect This — Ctrl+Shift+Alt+A — is a single shortcut to several ReSharper features that combine code analysis and navigation, including Call Tracking, Value Tracking, Type Hierarchy, and Type Dependency Diagram.
Note on shortcuts
All keyboard shortcuts provided in this page are available in ReSharper's default "Visual Studio" keymap. For details on ReSharper's two keymaps, see ReSharper Documentation.