Release notes
This section lists functionality added to DataGrip in the current release. To view release notes for other DataGrip versions, click the version switcher on the help site and select the version that you need.
AI
Agentic development with JetBrains Air
DataGrip now comes with JetBrains Air by default. The chat now has database-specific features that help you run SQL, explore data, and reference database objects directly in your conversations with AI agents.
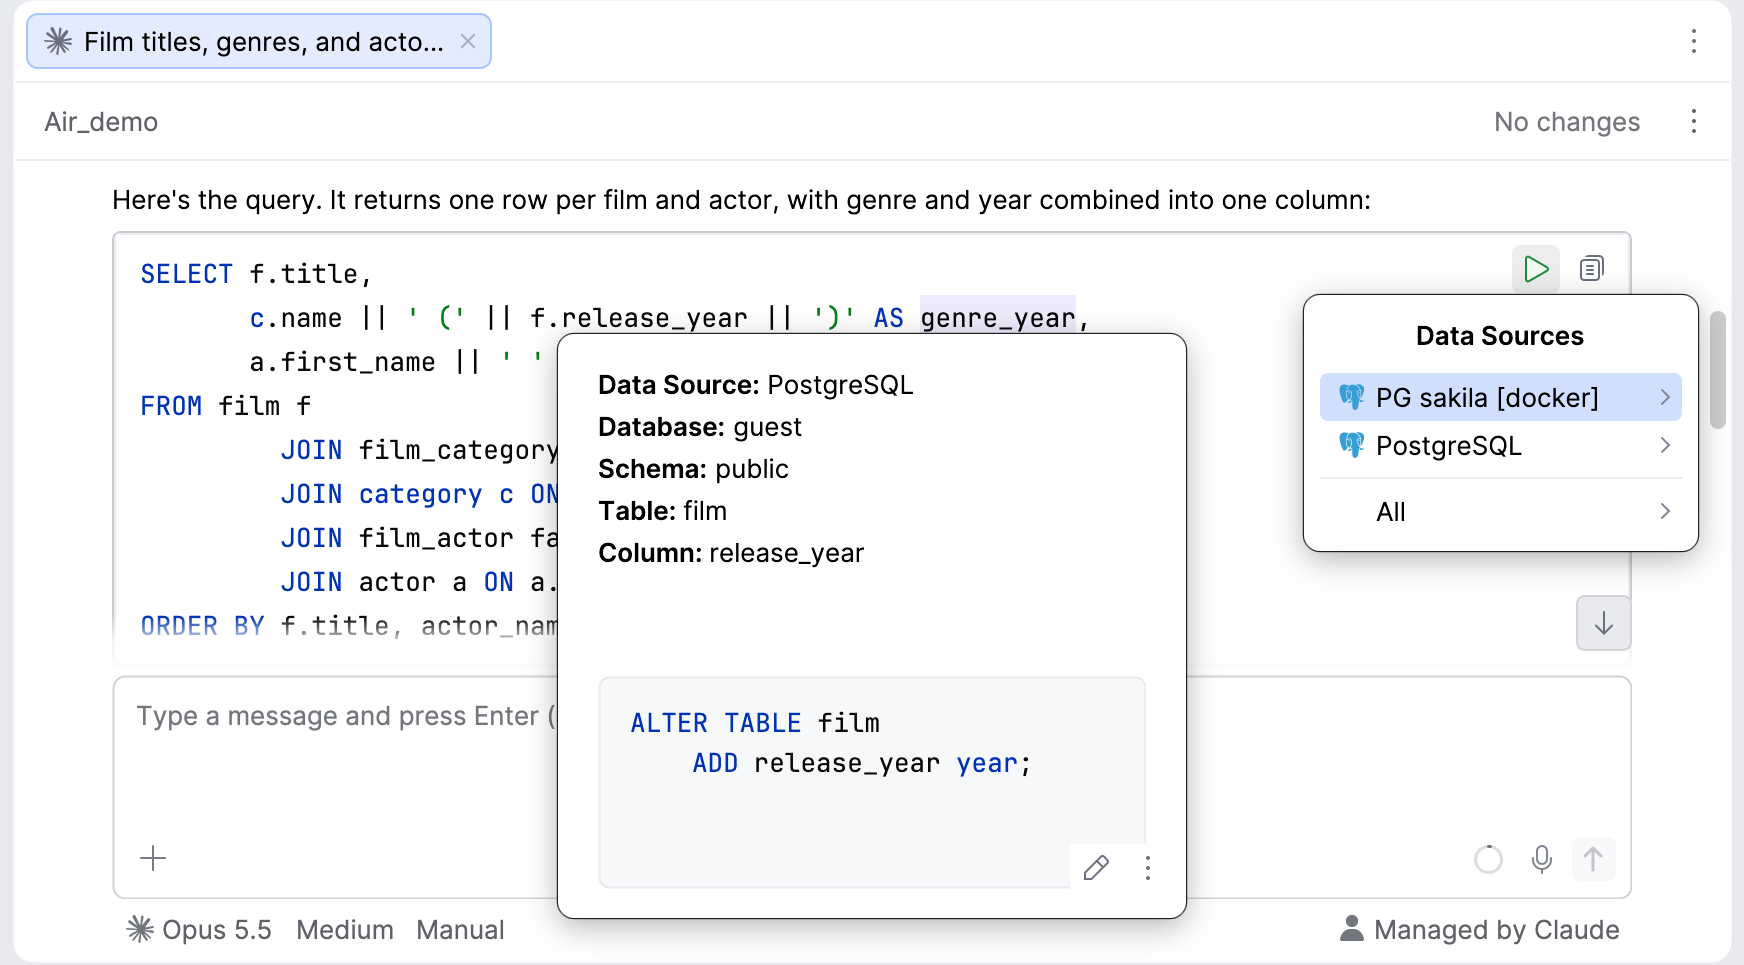
SQL snippets use the syntax highlighting and formatting settings configured in your IDE. You can copy the code or run it directly from the chat against a selected data source. After running it, you can navigate to object definitions and preview them in the Quick Definition popup.
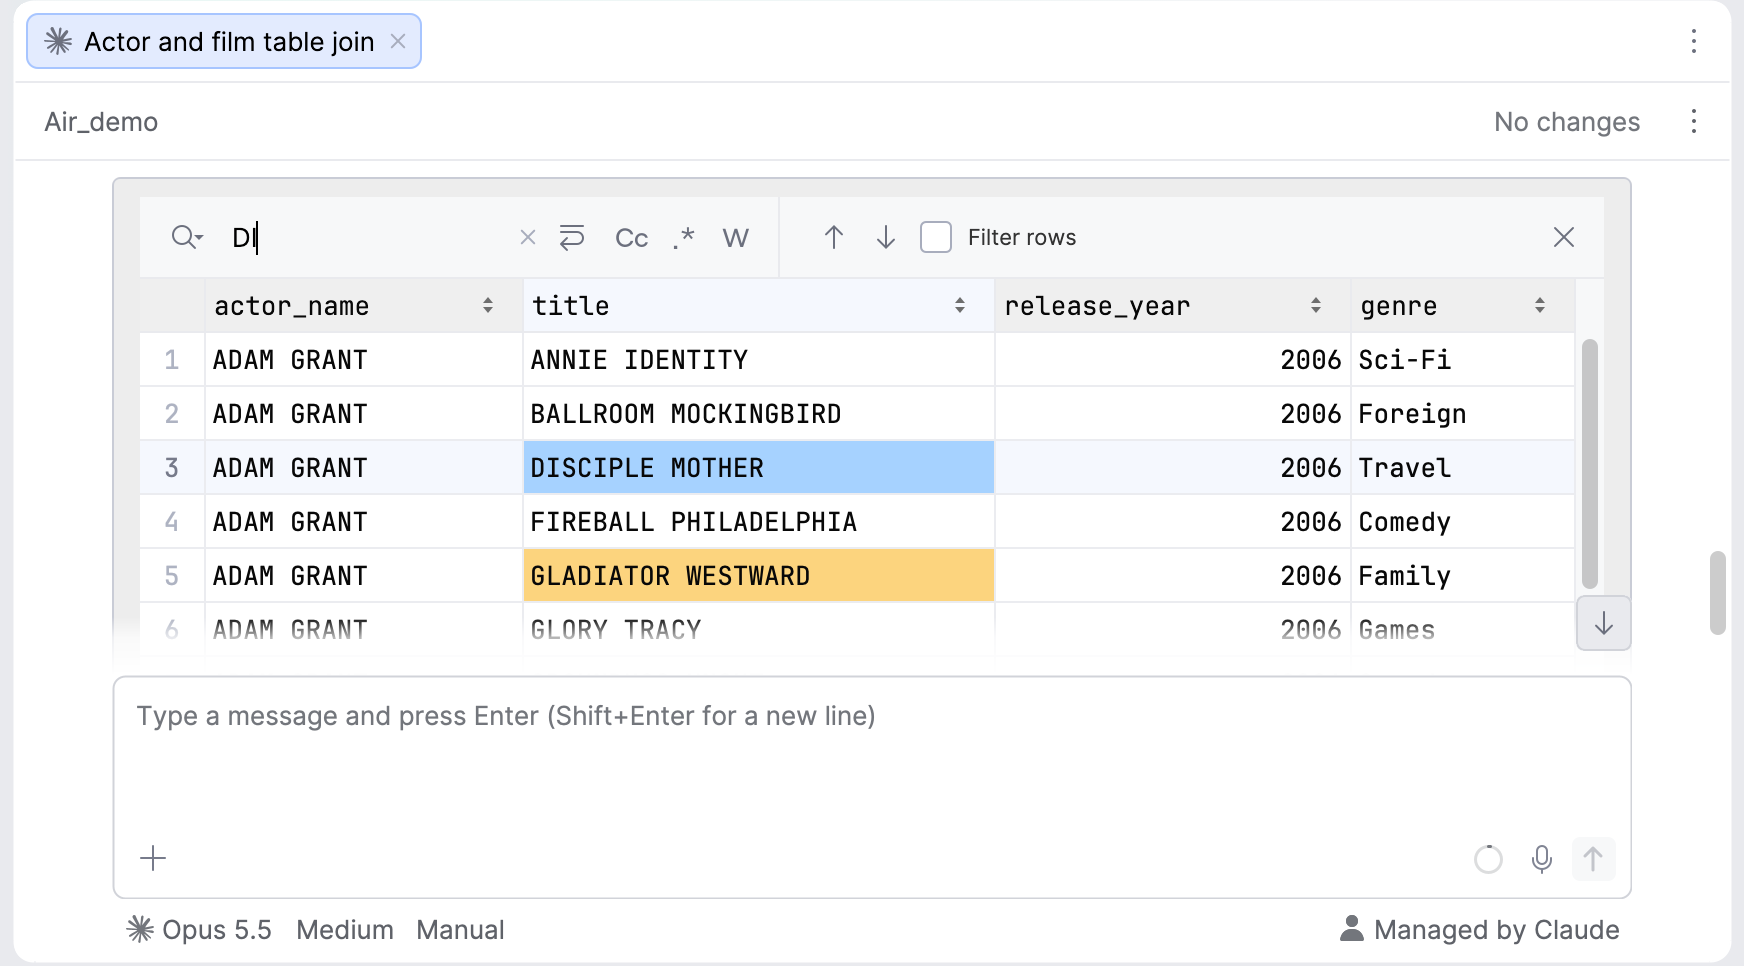
When an agent returns tabular data in CSV format, you can view it in the data editor right in the chat, with sorting and search available.
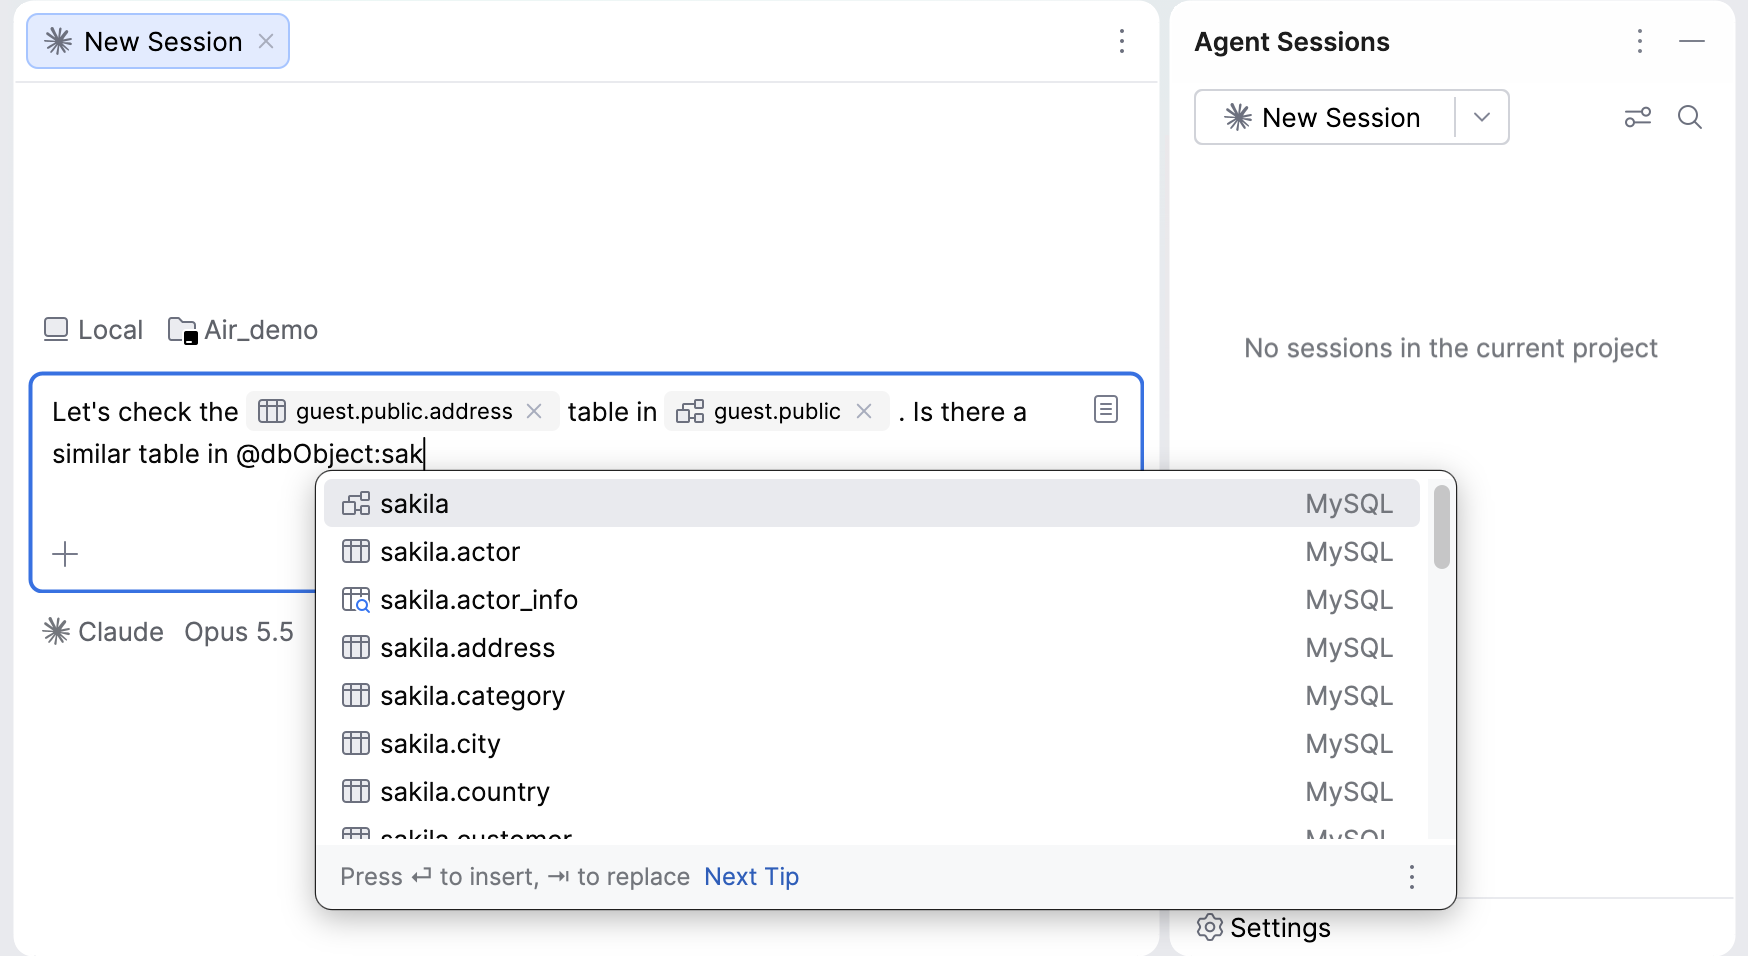
You can also reference database objects in your prompts using @dbObject notation, with completion to help you find the object you need.
Object references appear with their icons in the chat and support the Quick Definition popup.
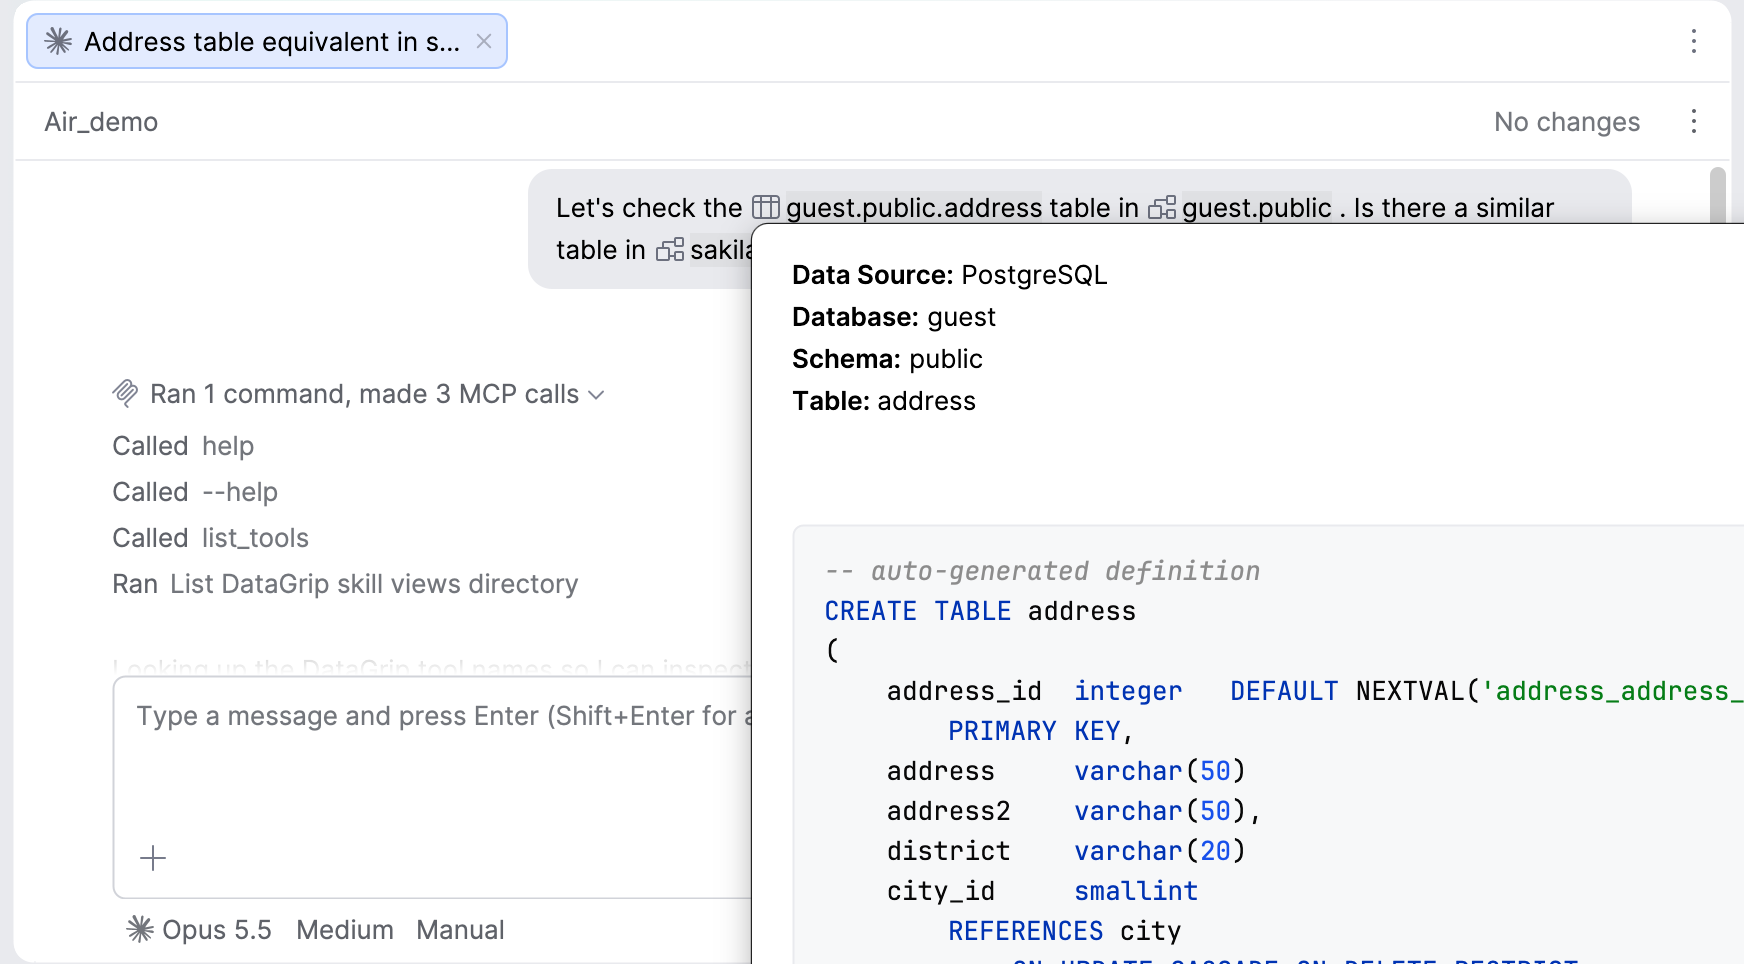
To reduce token usage, DataGrip sends a link to each referenced object. The agent can then retrieve the information it needs through DataGrip’s MCP server.
Connectivity
Cross-database queries
You can now query data across different databases, even when they use different DBMSs, and view the results directly without copying the data beforehand.
To do this, add the Workspace data source and write your queries in its query console with Ctrl+Space code completion and a special syntax. This data source is based on DuckDB and runs in memory by default, so it does not require a database file.
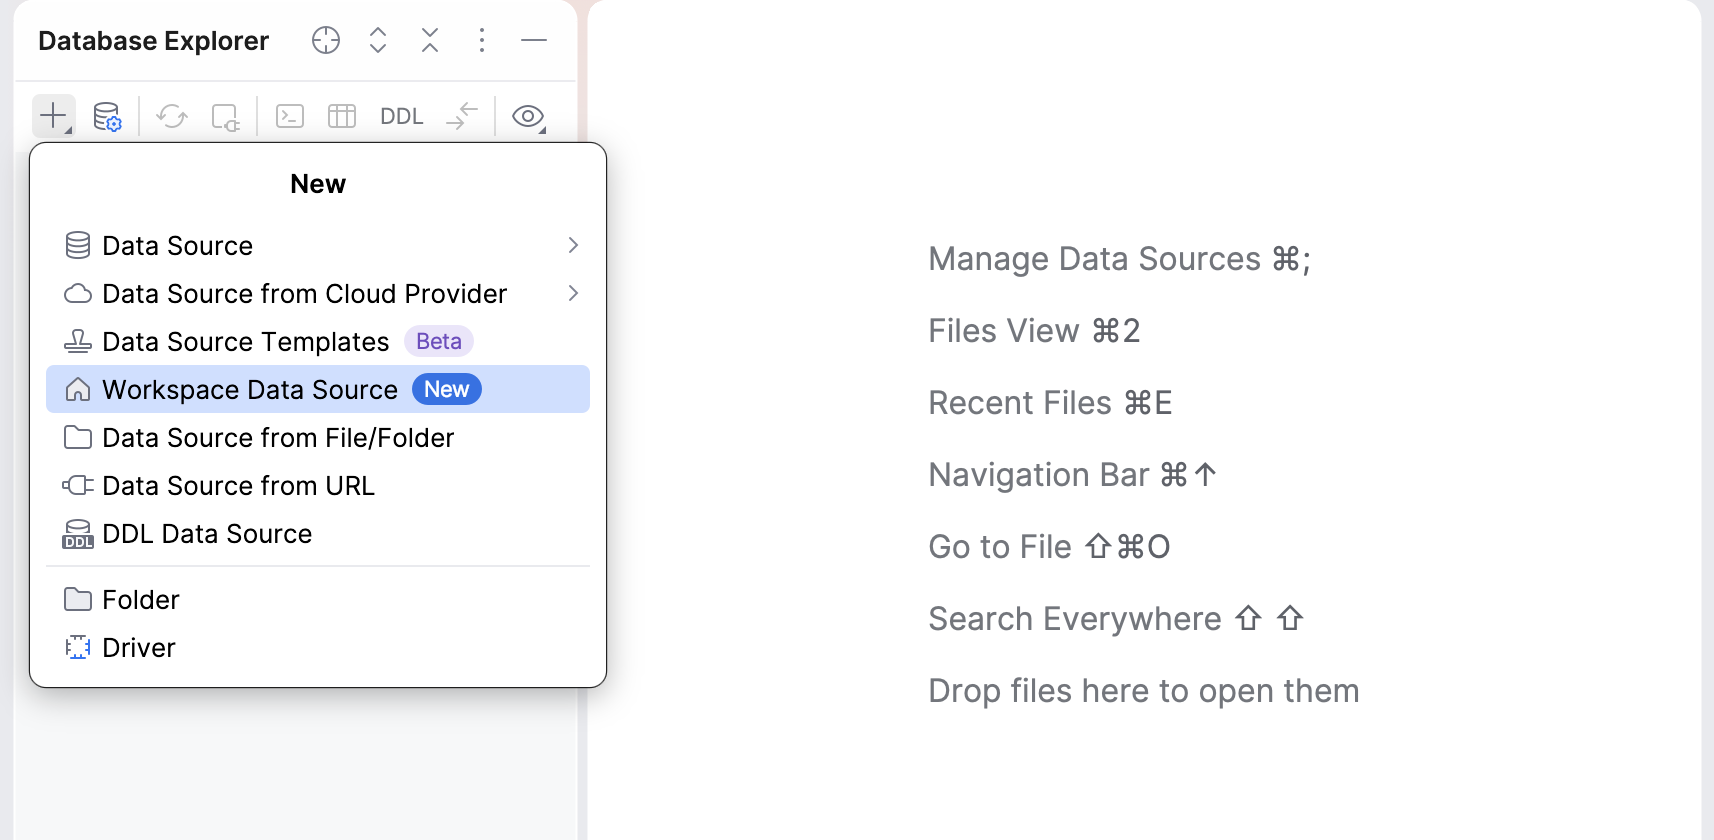
To add this data source, click  Add on the Database Explorer toolbar and select
 Workspace Data Source.
In the default query console that opens automatically, use the following syntax to write your queries:
To reference a table directly, specify its data source and table name. Add the database and schema when needed:
#data_source[.database.schema].tableTo filter a table, add
#filter(...)to the reference:#data_source[.database.schema].table.#filter('condition')You can also use
#query(...)to run a query against a data source:#data_source[.database.schema].#query('query')
In #filter(...) and #query(...), you can use $$...$$ dollar-quoted strings instead of single quotes: #filter($$condition$$) and #query($$query$$).
Type # to select a data source using code completion.
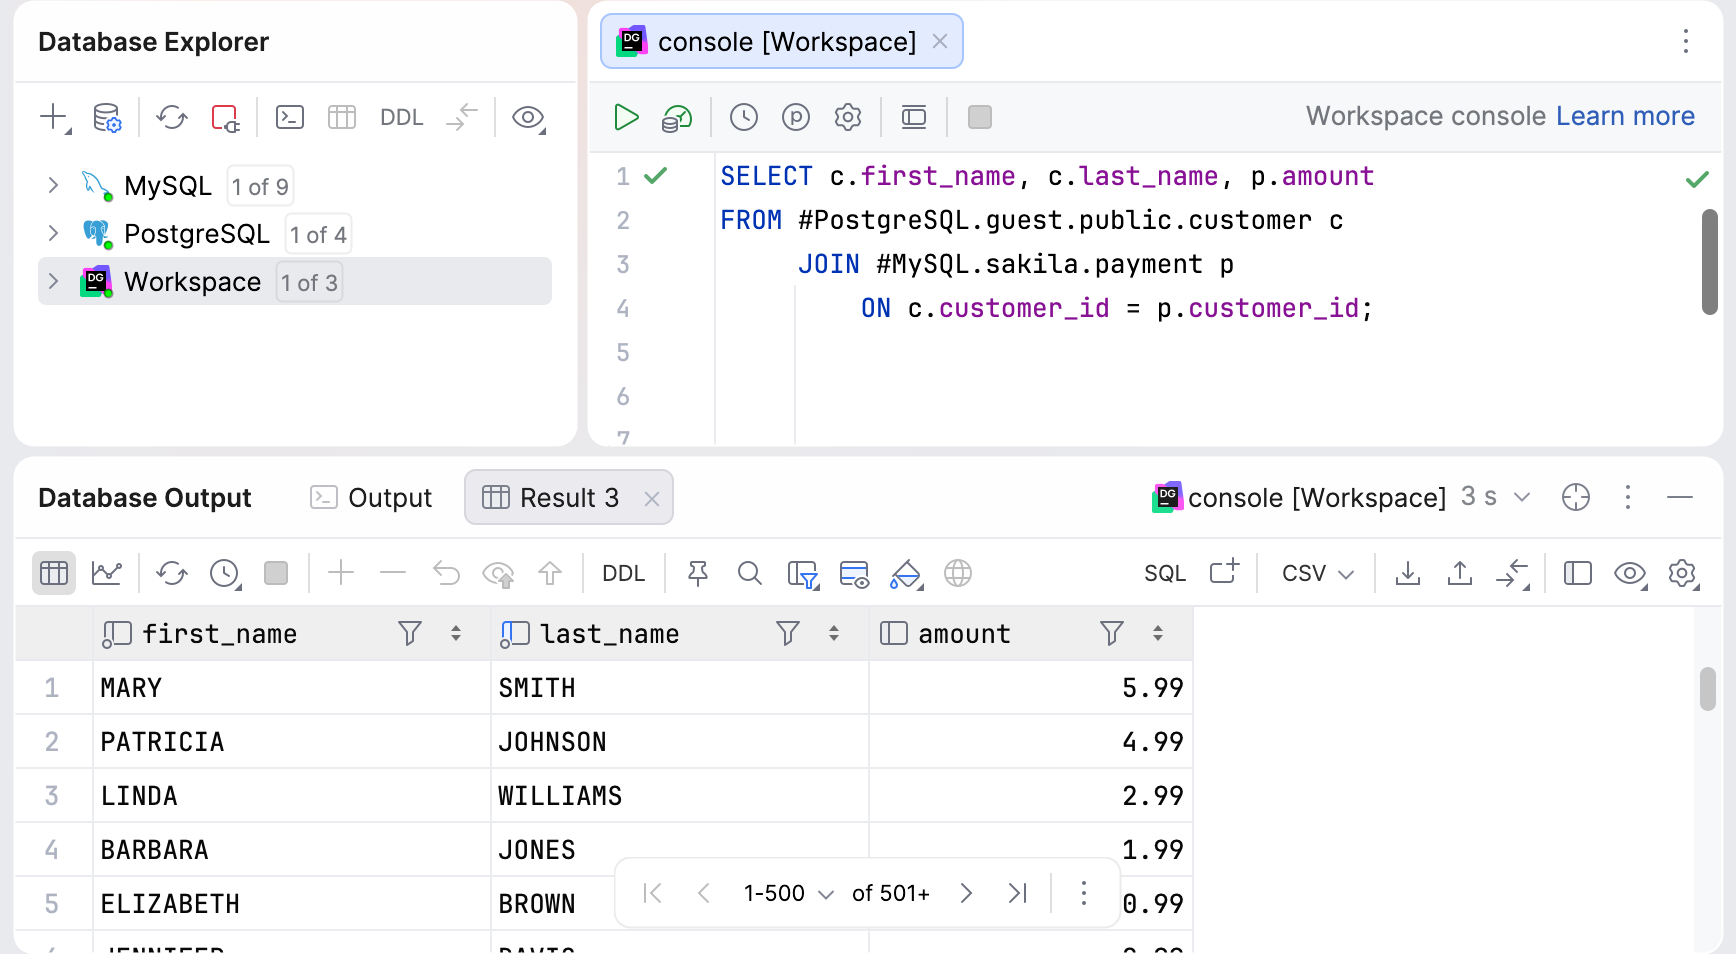
For example, join data from PostgreSQL and MySQL data sources:
DuckDB support
DataGrip now offers full support for DuckDB, including a dedicated SQL dialect, DuckDB-specific syntax and functions, code completion, and database object introspection.
To add a DuckDB data source, click Add on the Database Explorer toolbar and select .
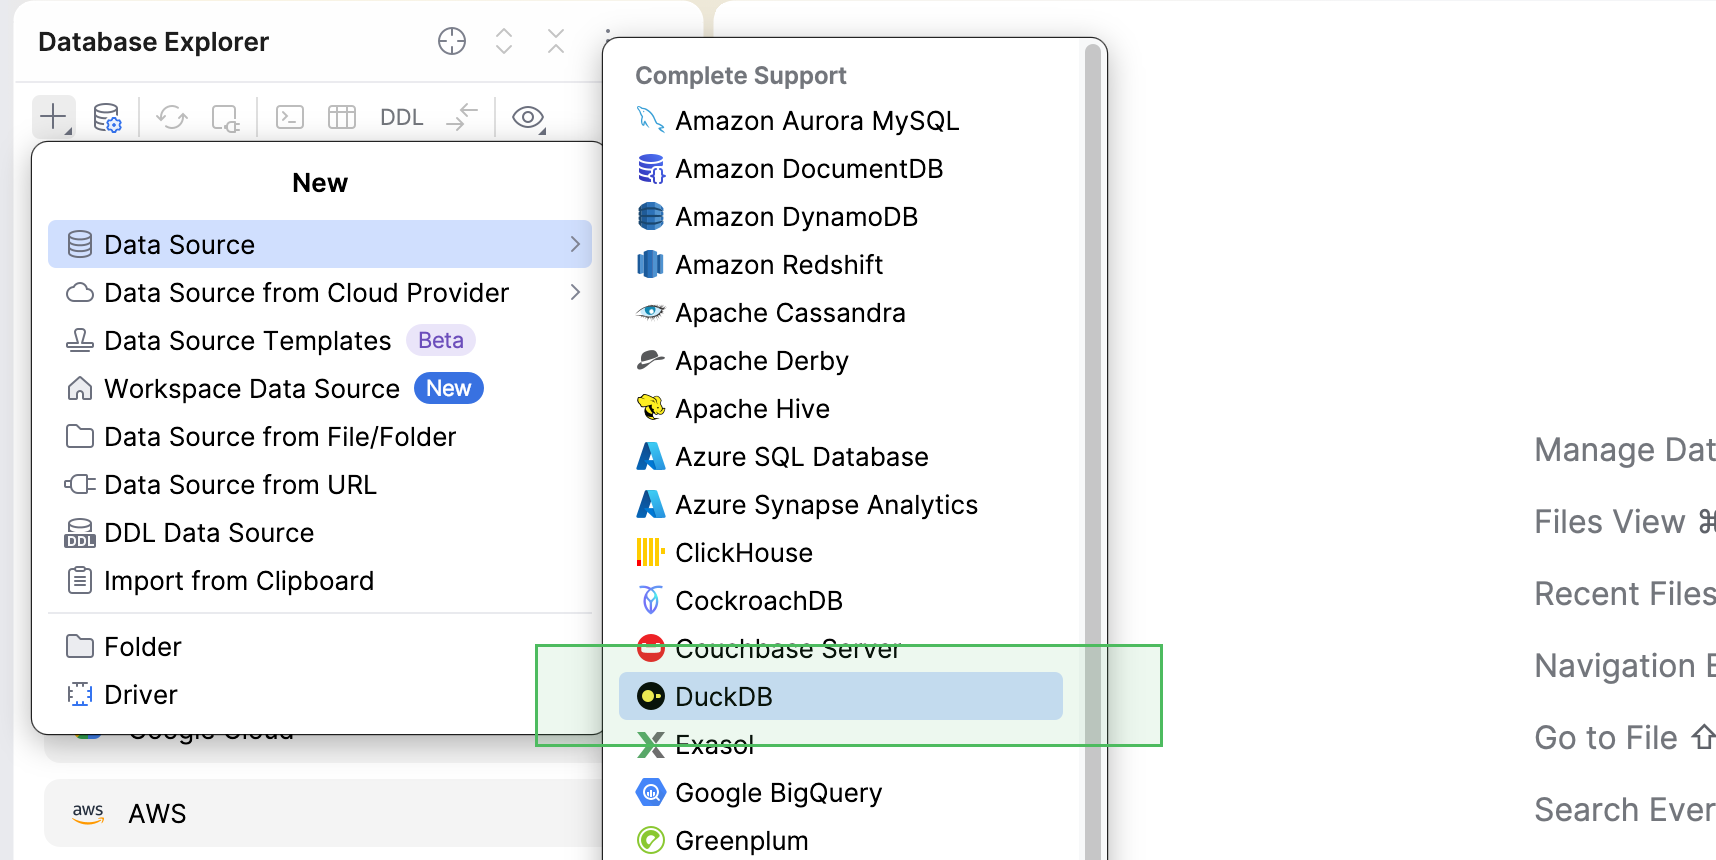
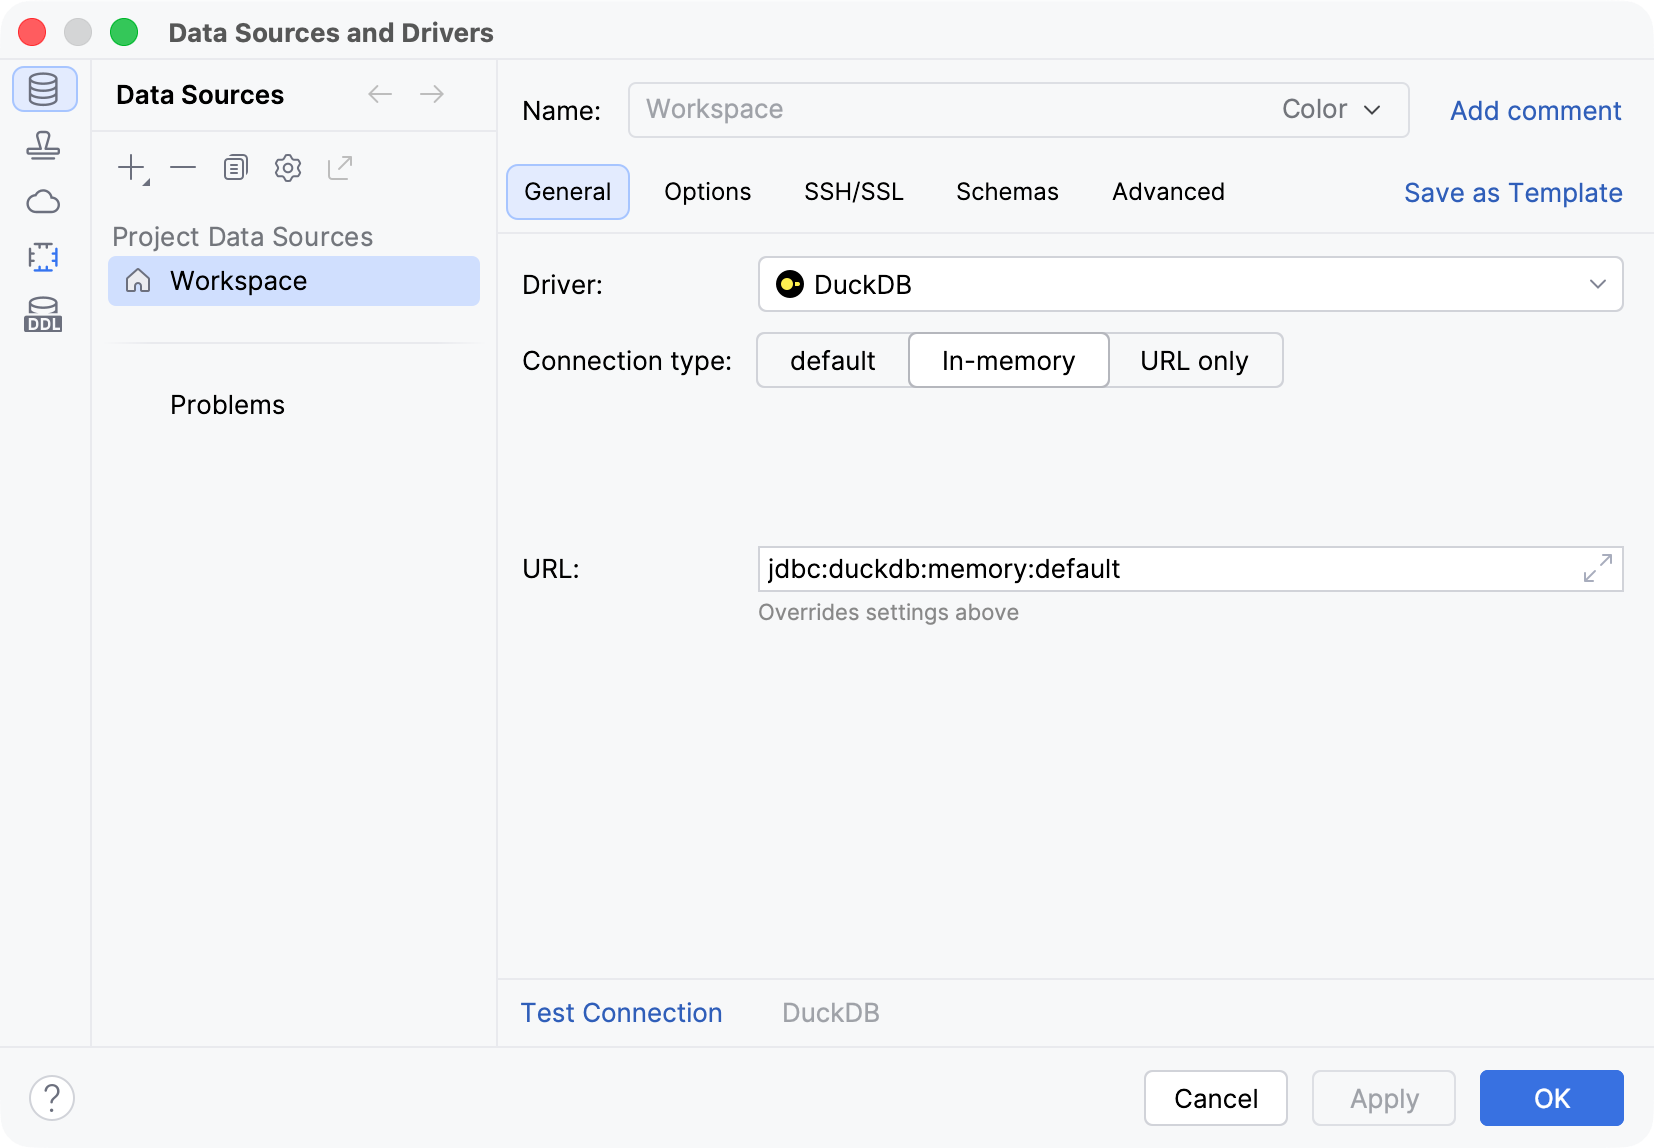
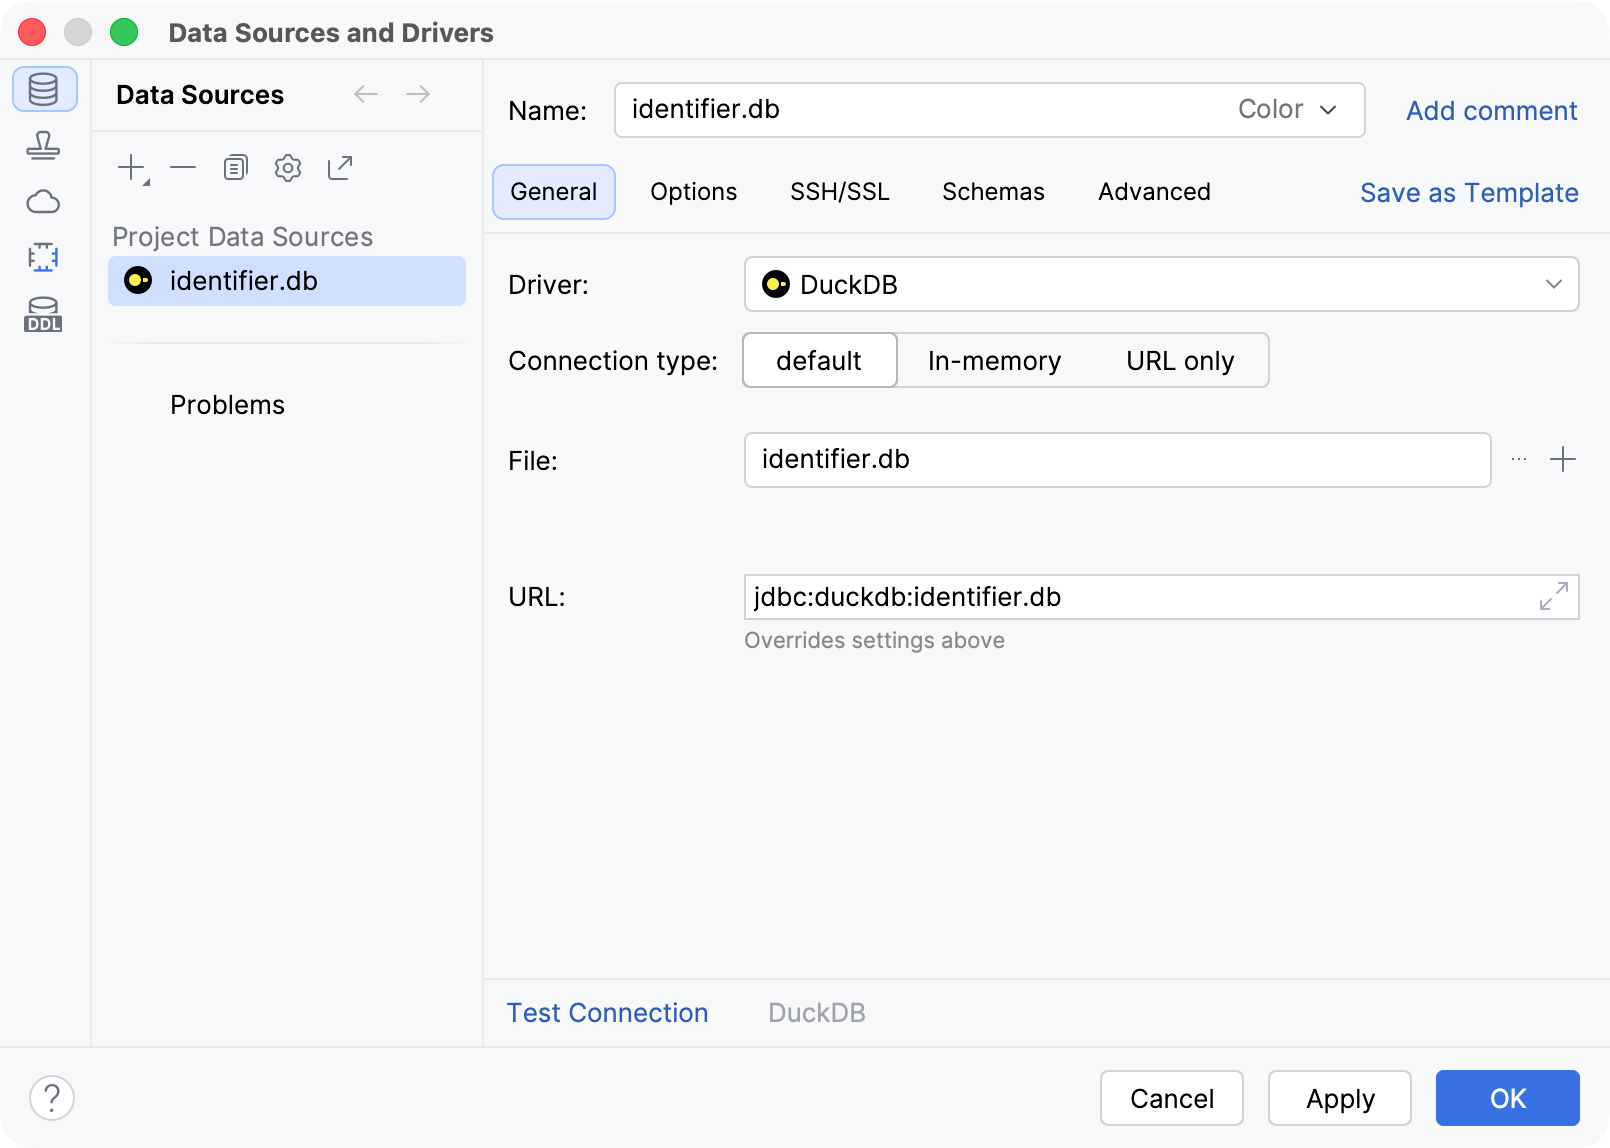
Three connection types are available: default, In-memory, and URL only. The default option connects to a DuckDB database file specified by its path. In-memory creates a database in memory, while URL only uses the JDBC URL you provide as is.
Database connections disabled in untrusted projects
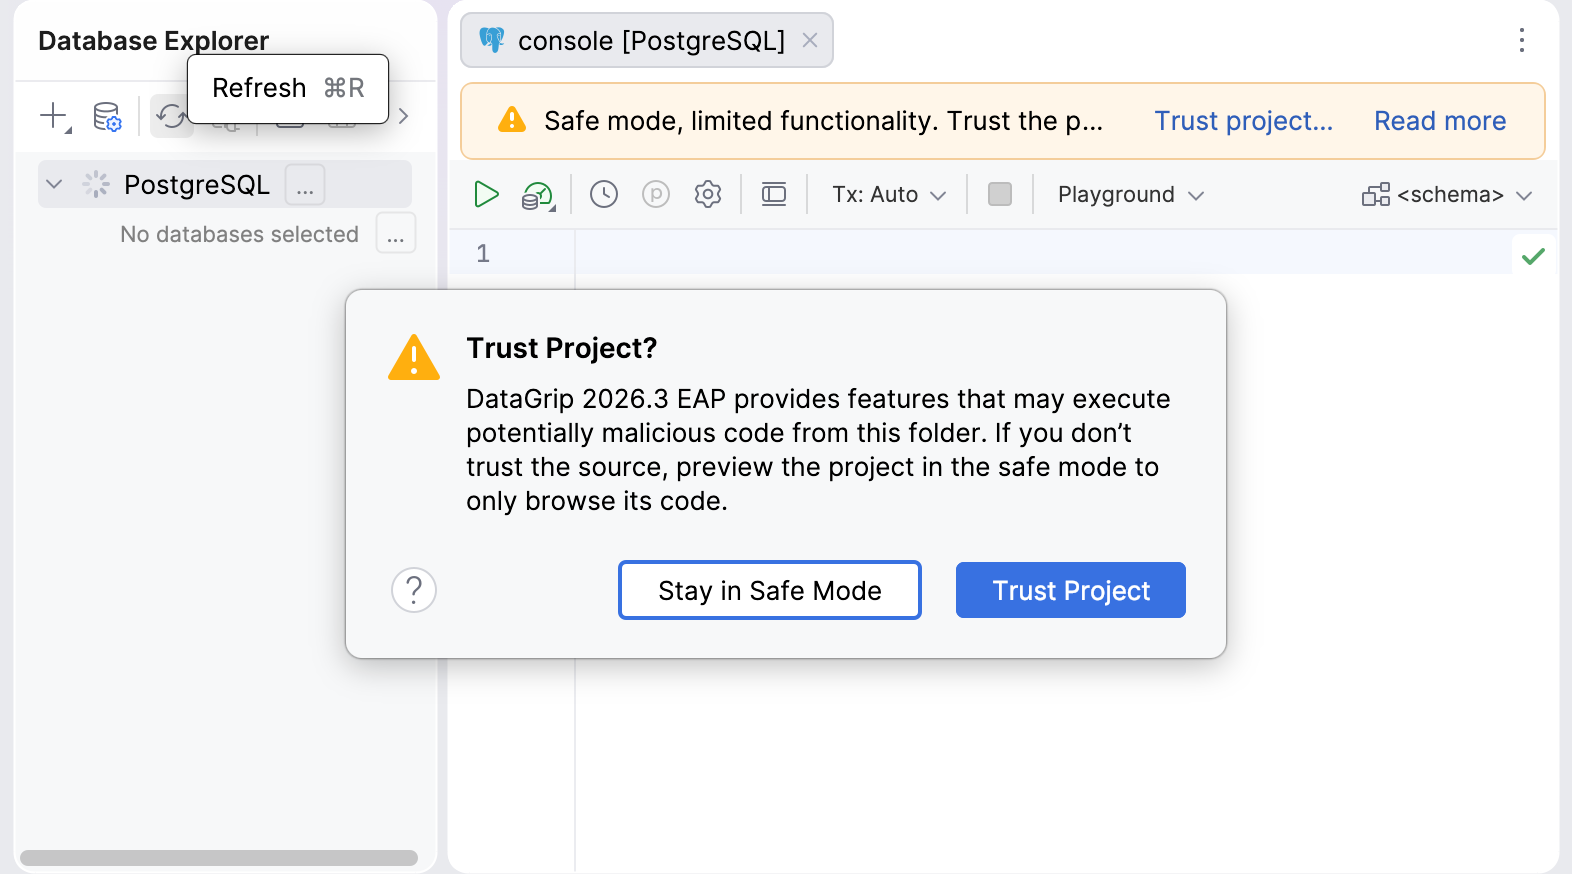
DataGrip now asks you to trust an untrusted project before connecting to a database. This also applies when you click Test Connection in the Data Sources and Drivers.
Connecting to a database can execute potentially malicious code, for example, if the connection URL, startup scripts, or driver files have been tampered with. The dialog explains this risk and lets you trust the project to proceed or stay in safe mode, where database connections are disabled.
UI and UX improvements
New Database Output tool window
We’ve moved query results from Services to the new Database Output tool window. Like Services, it opens automatically at the bottom of the IDE when you run a query, a run configuration, or an SQL file.
To show or hide the tool window, click More tool windows on the toolbar in the window header and select Database Output. Alternatively, press Alt+8.
The header combines the session client selector with the Output, Query Plan, and Result tabs. By default, the contents of the tool window follow the active editor tab, showing the corresponding output, query plans, and query results.
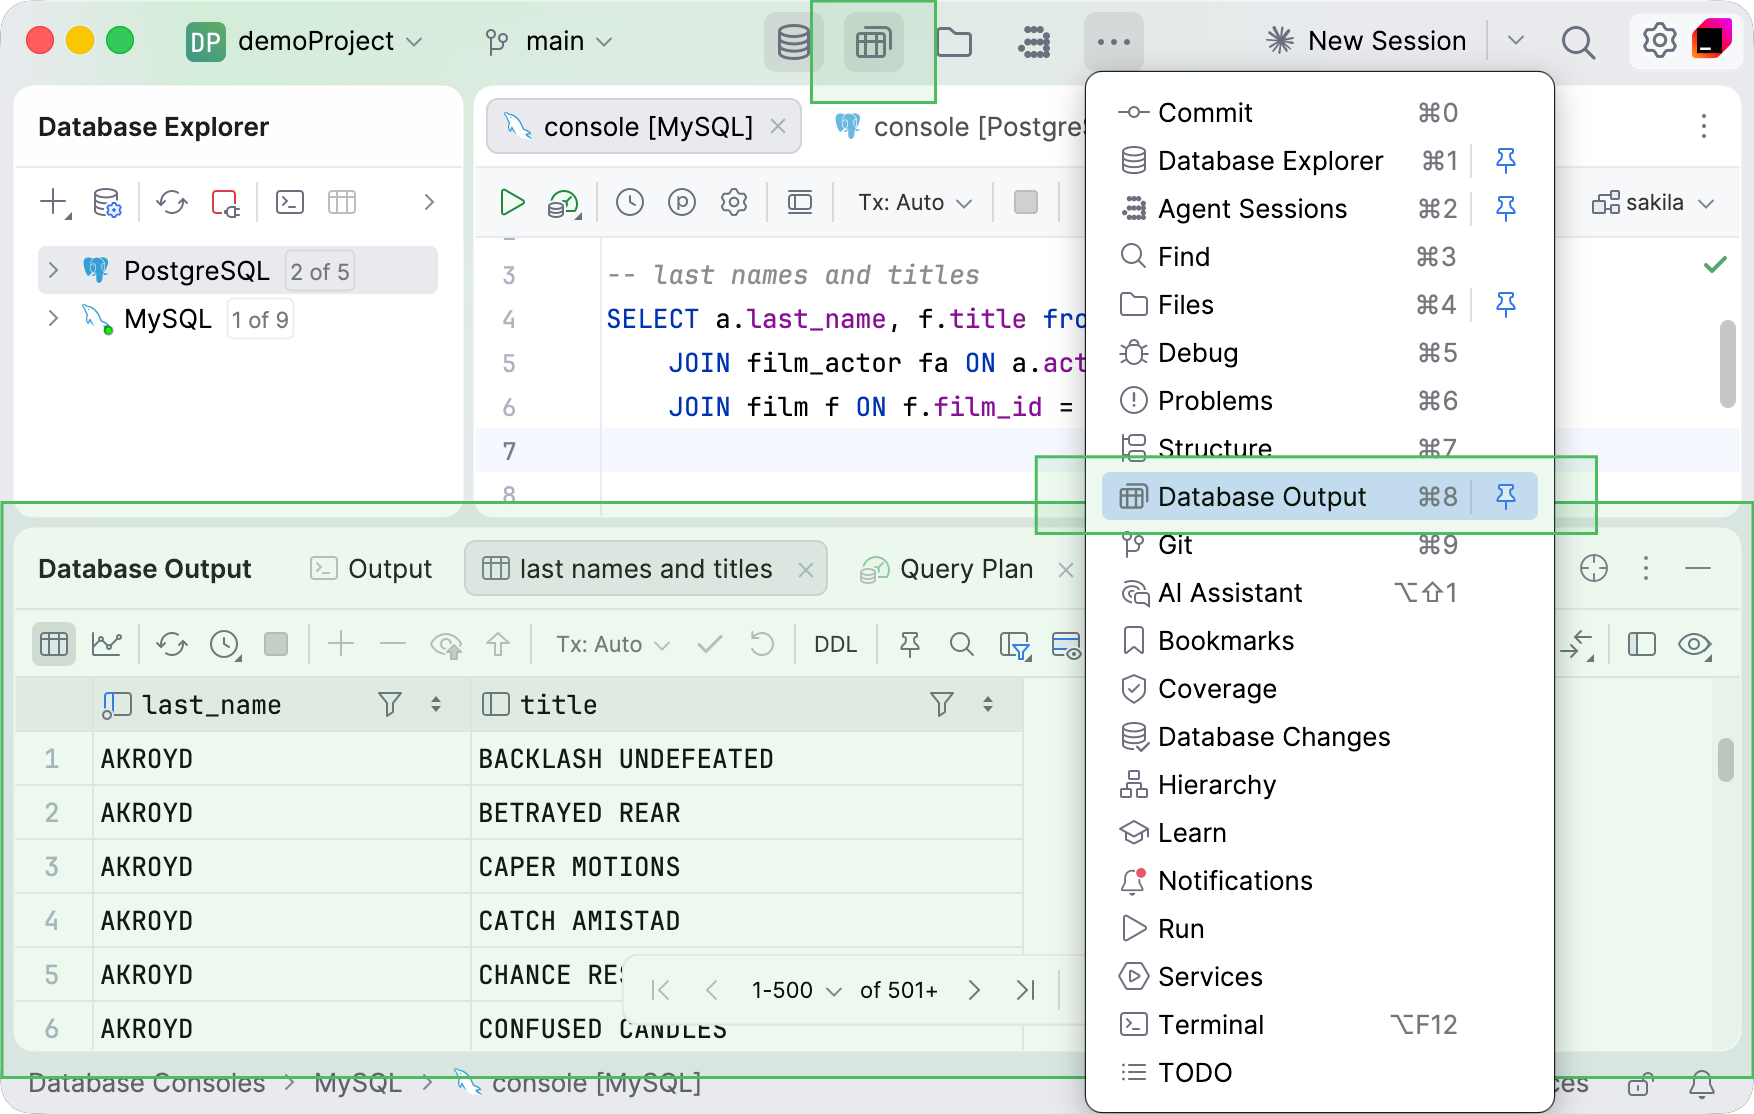
The session client tree is now in a dropdown on the right side of the toolbar. Session management remains available in the Services tool window. To open session details for the selected client, select Manage sessions from the client dropdown.
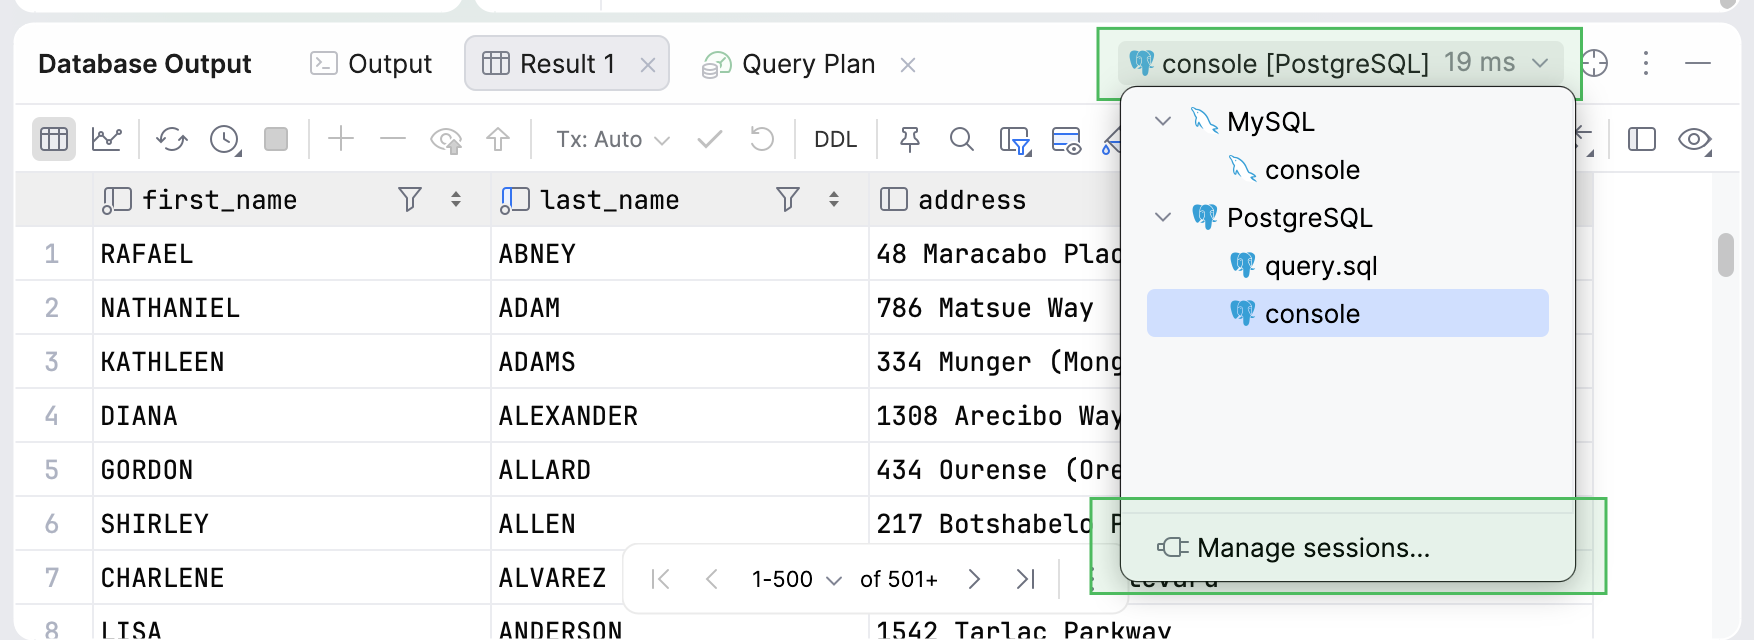
To switch back to the Services tool window, open the main Settings dialog and navigate to . In Show results in, select Services tool window.
Updated tool window bar and shortcuts
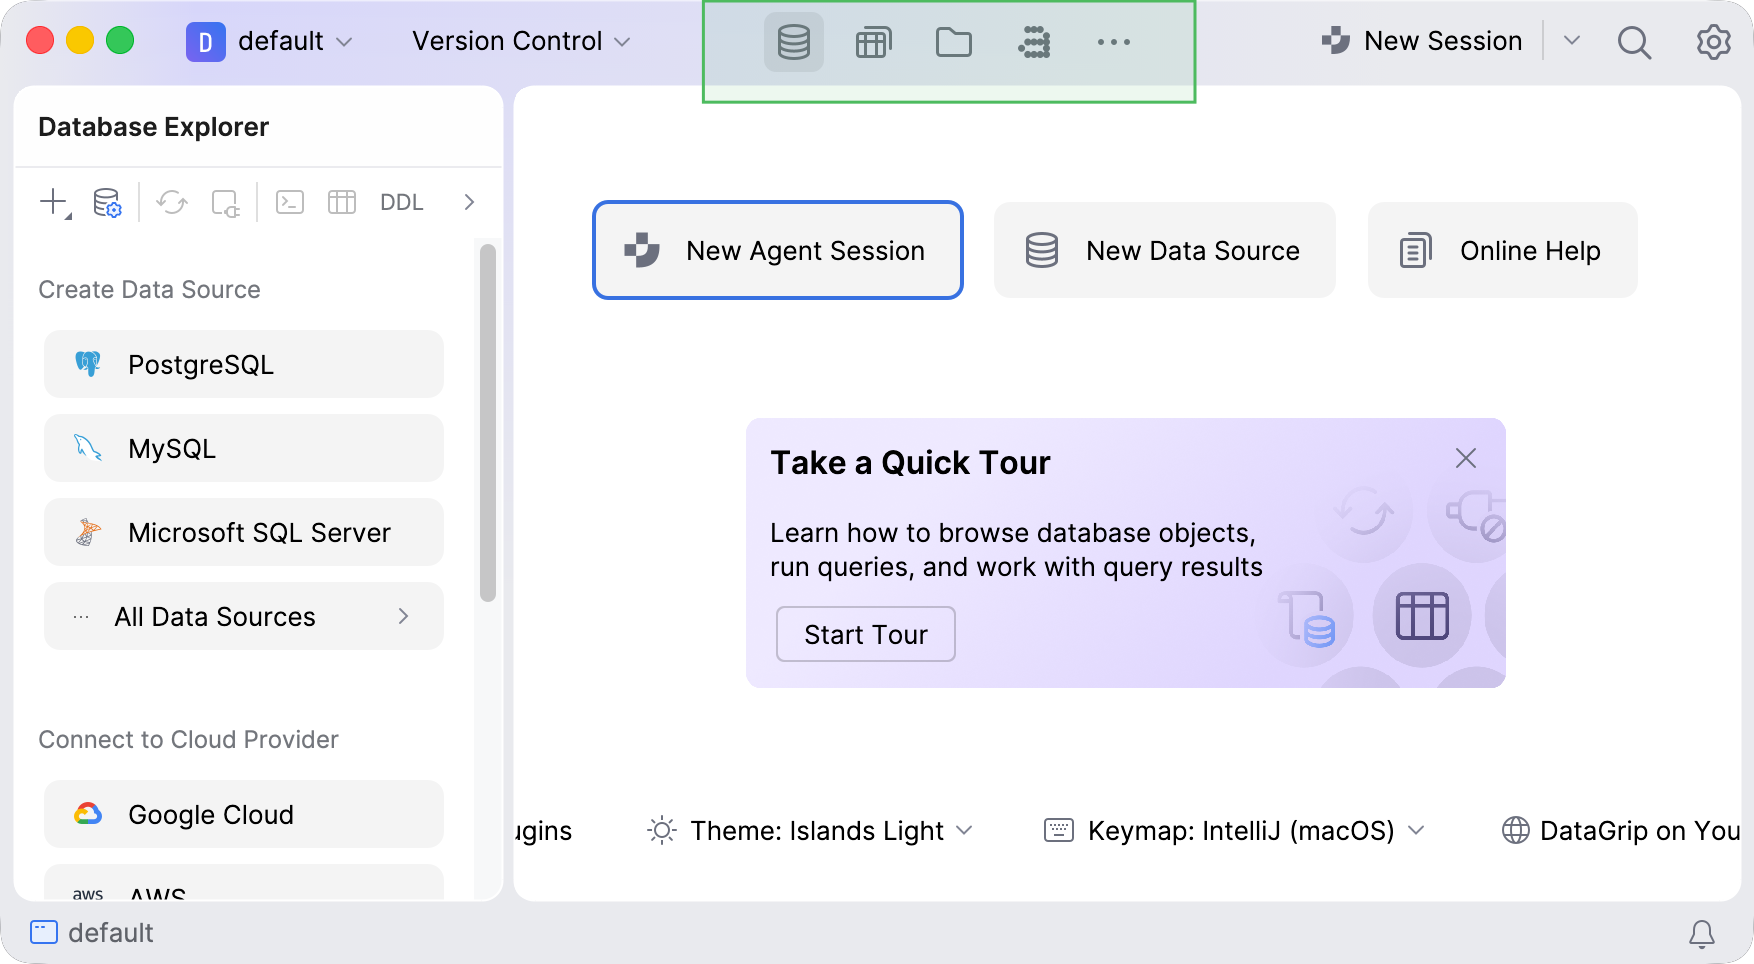
We’ve updated the tool window bar in the window header to include icons for Database Explorer, Database Output, Files tool window, and Agent Sessions.
The default tool window shortcuts have changed:
Agent Sessions now uses Alt+2, previously assigned to Files tool window.
Files tool window now uses Alt+4, previously assigned to Run.
Run no longer has a default shortcut.
You can customize these shortcuts at any time in .
Working with data
Ability to open result sets in editor tabs
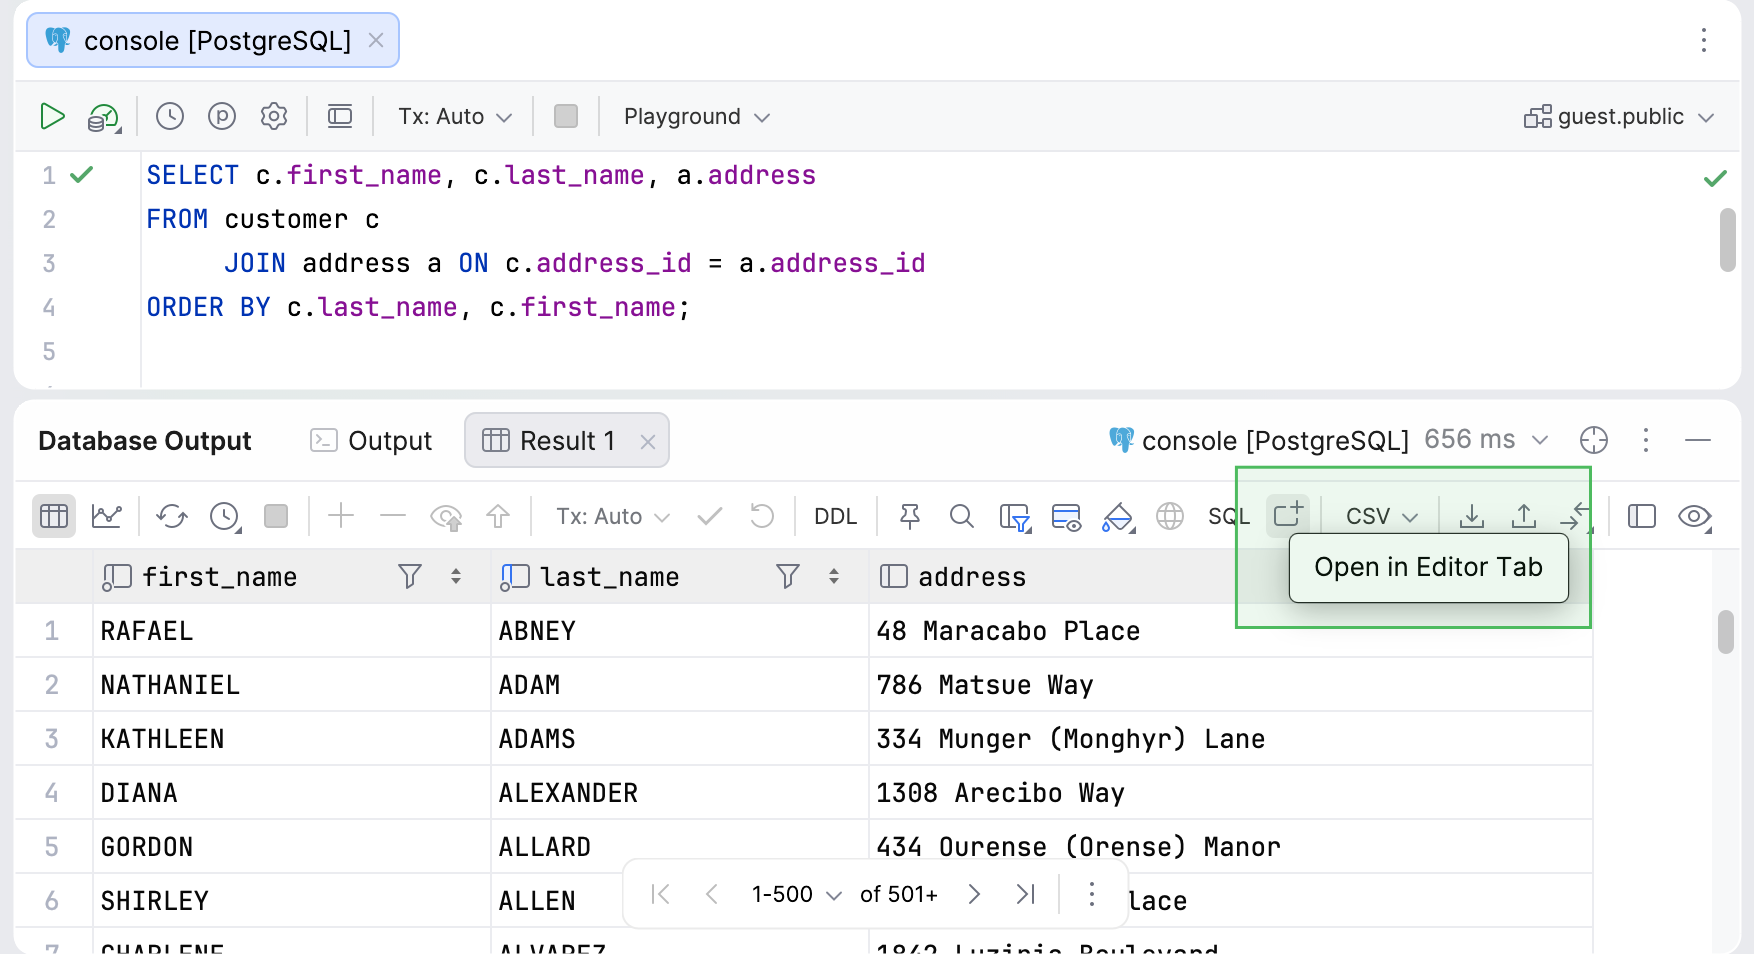
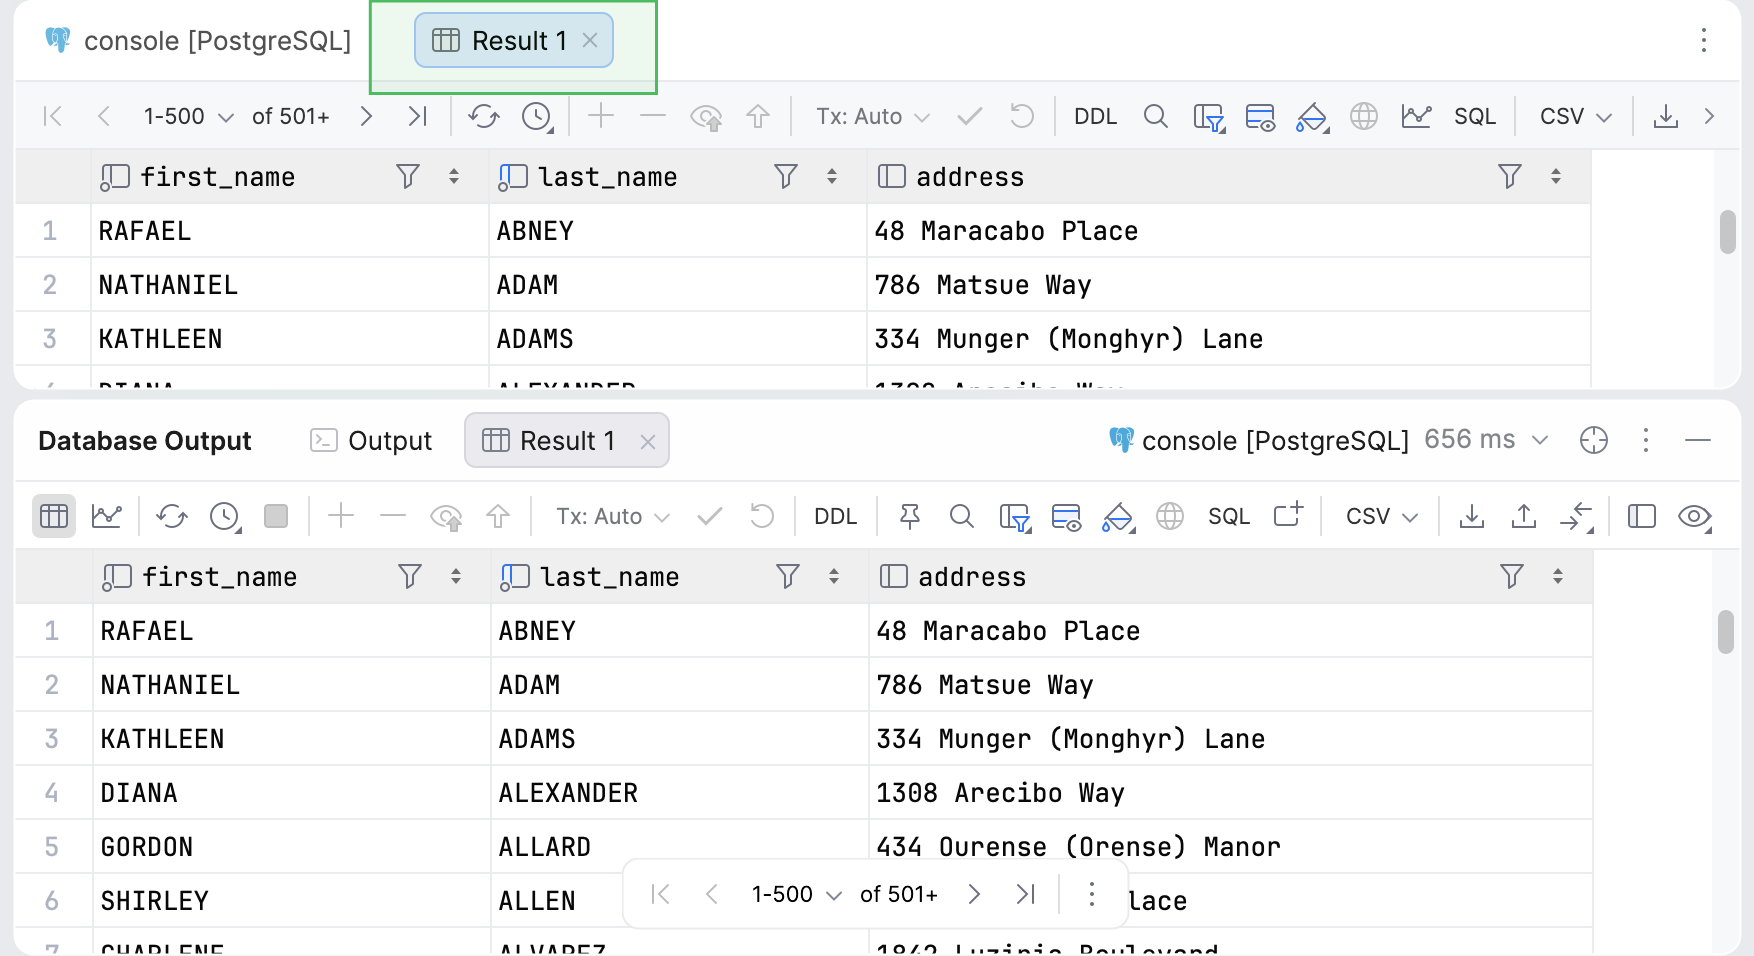
You can now open query results in separate editor tabs to work with them in the main editor area without resizing tool windows or rearranging your layout.
For result sets in the Database Output tool window, use the new Open in Editor Tab action:
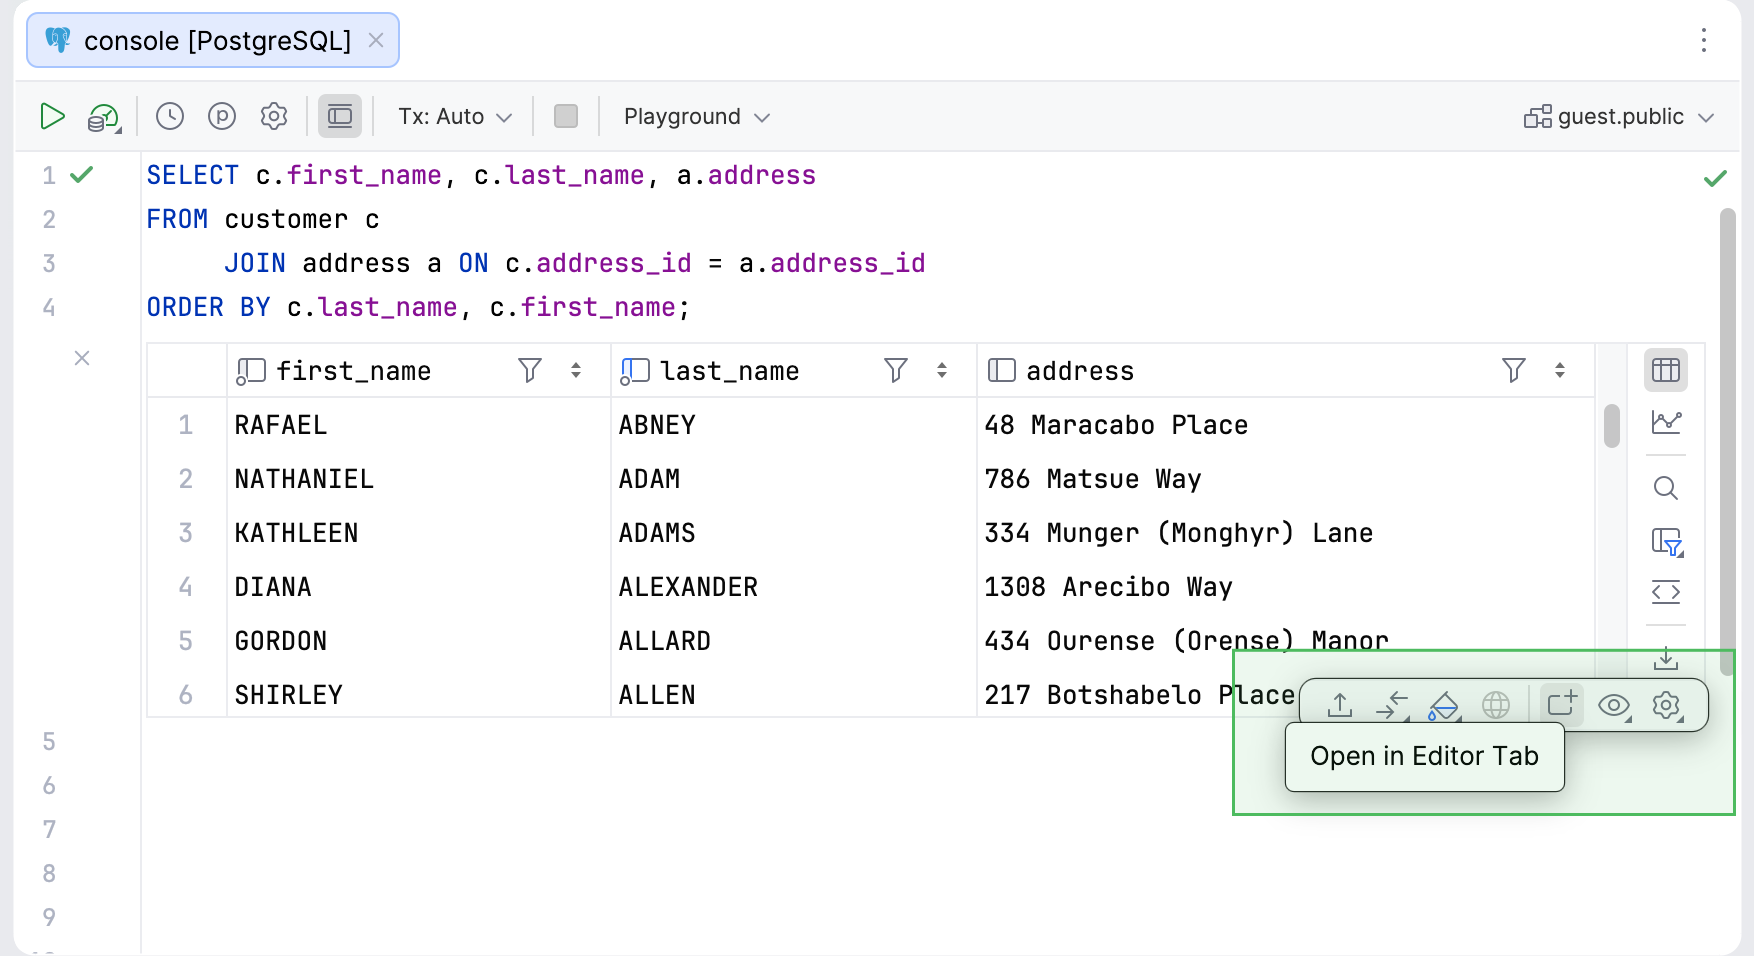
The same action is also available for in-editor results:
In both cases, the result set opens in a separate tab in the main editor area:
New SQL action for result sets
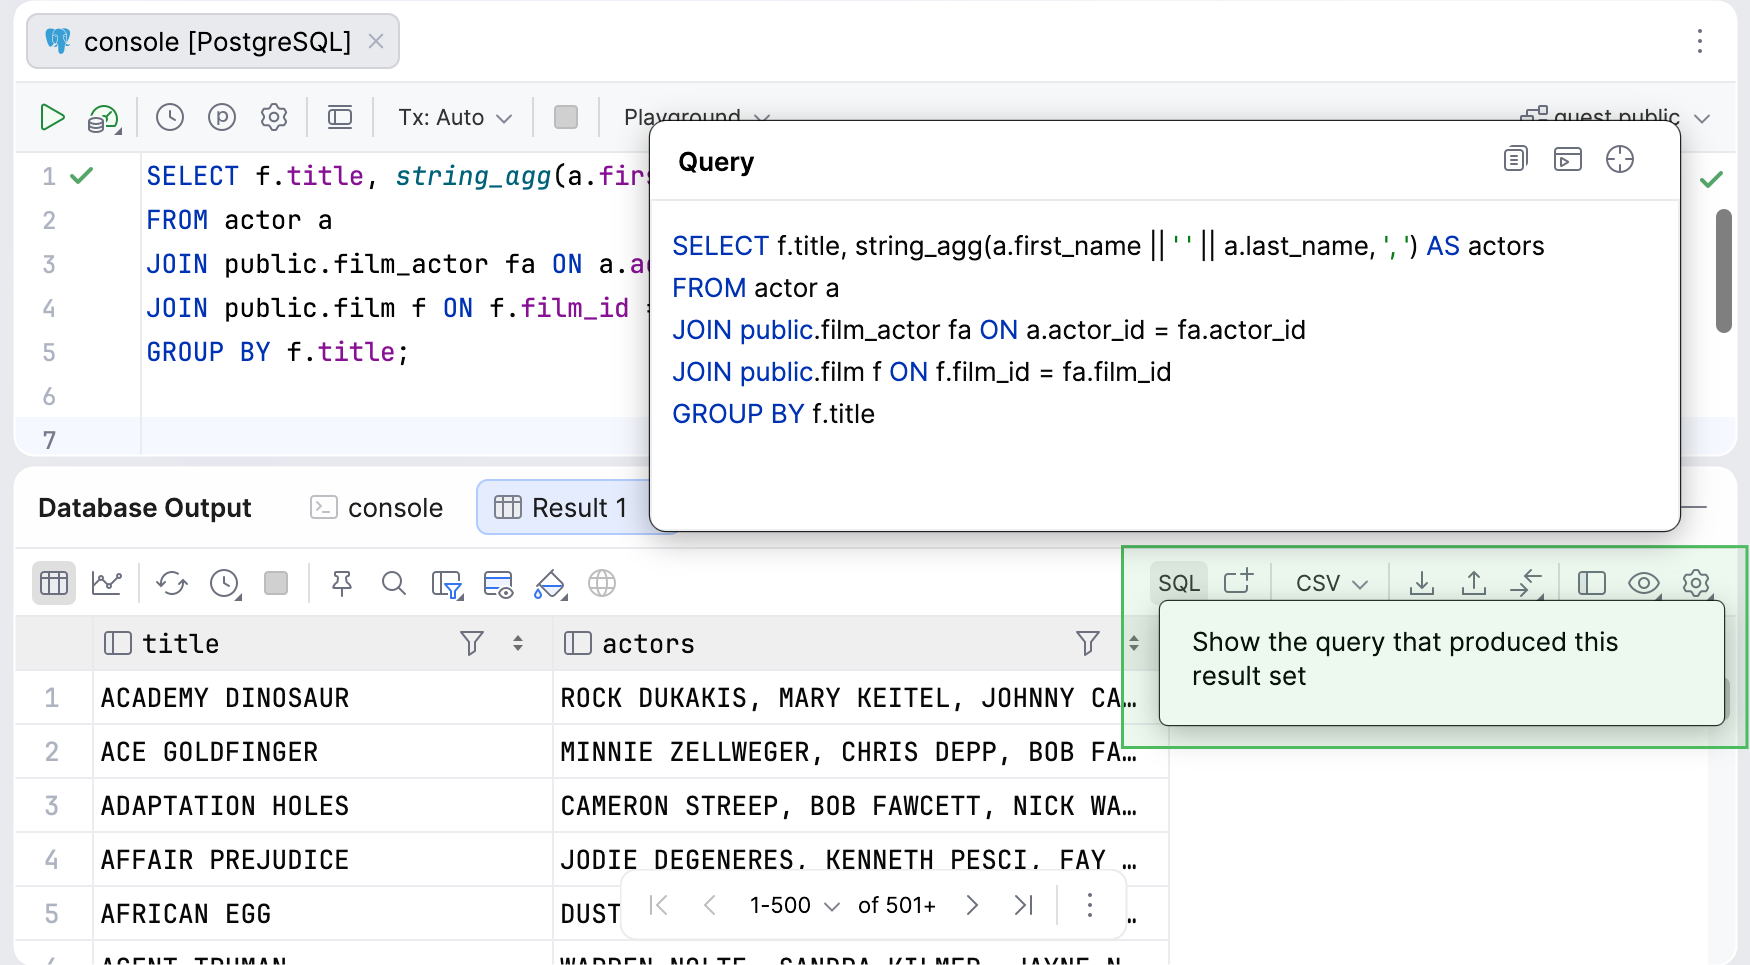
We’ve added an SQL action that opens a popup with the query that produced the result set. From the popup toolbar, you can run the query again, copy it to the clipboard, or navigate to it in the editor.
Ability to pin columns in the data editor
Now you can pin columns to the left side of the data editor. This keeps important data visible when you scroll horizontally through wide tables.
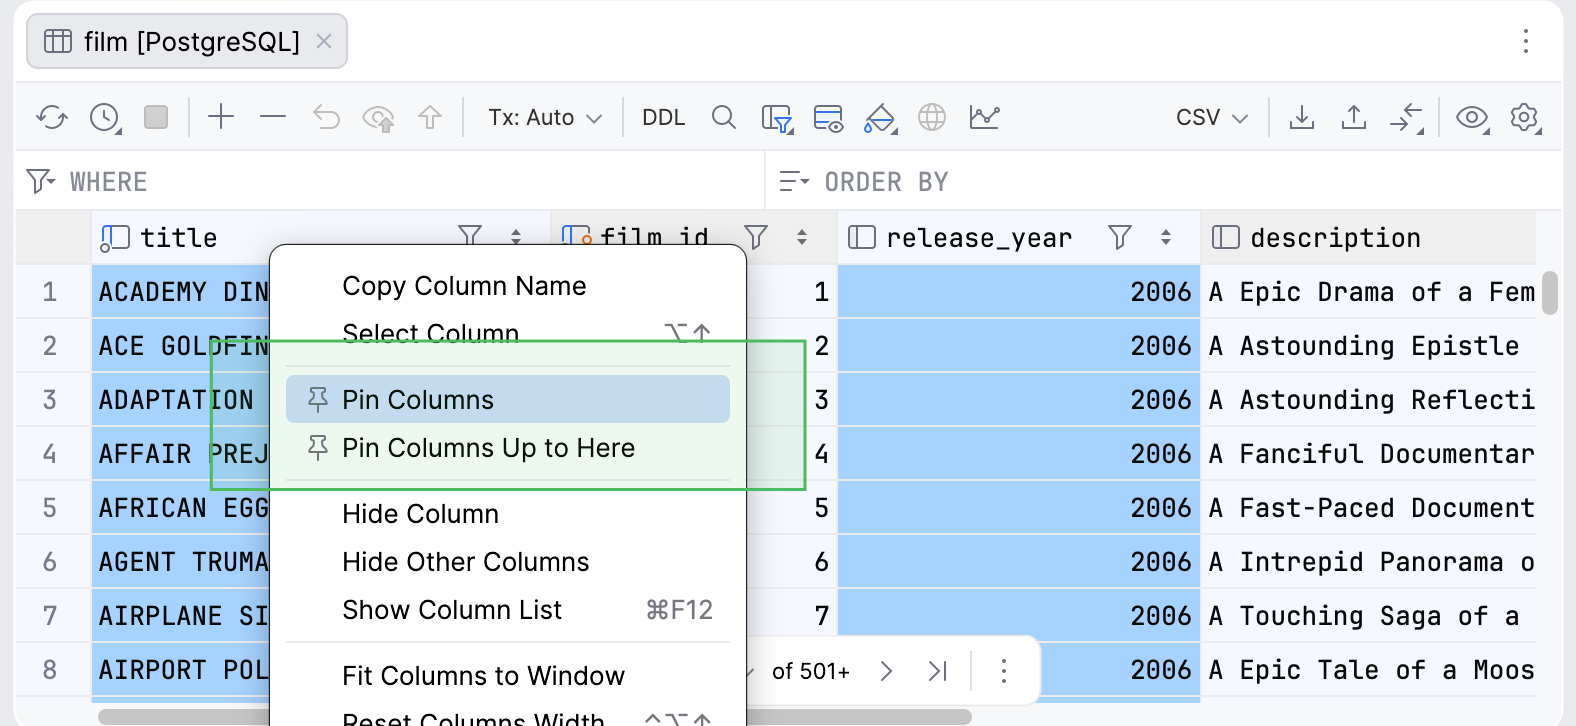
To pin one or more columns, select them, right-click on the header, and select Pin Column or Pin Columns. You can also select Pin Columns Up to Here to pin all columns up to the one you have selected.
A blue divider separates the pinned columns from the remaining ones, which you can scroll through horizontally.
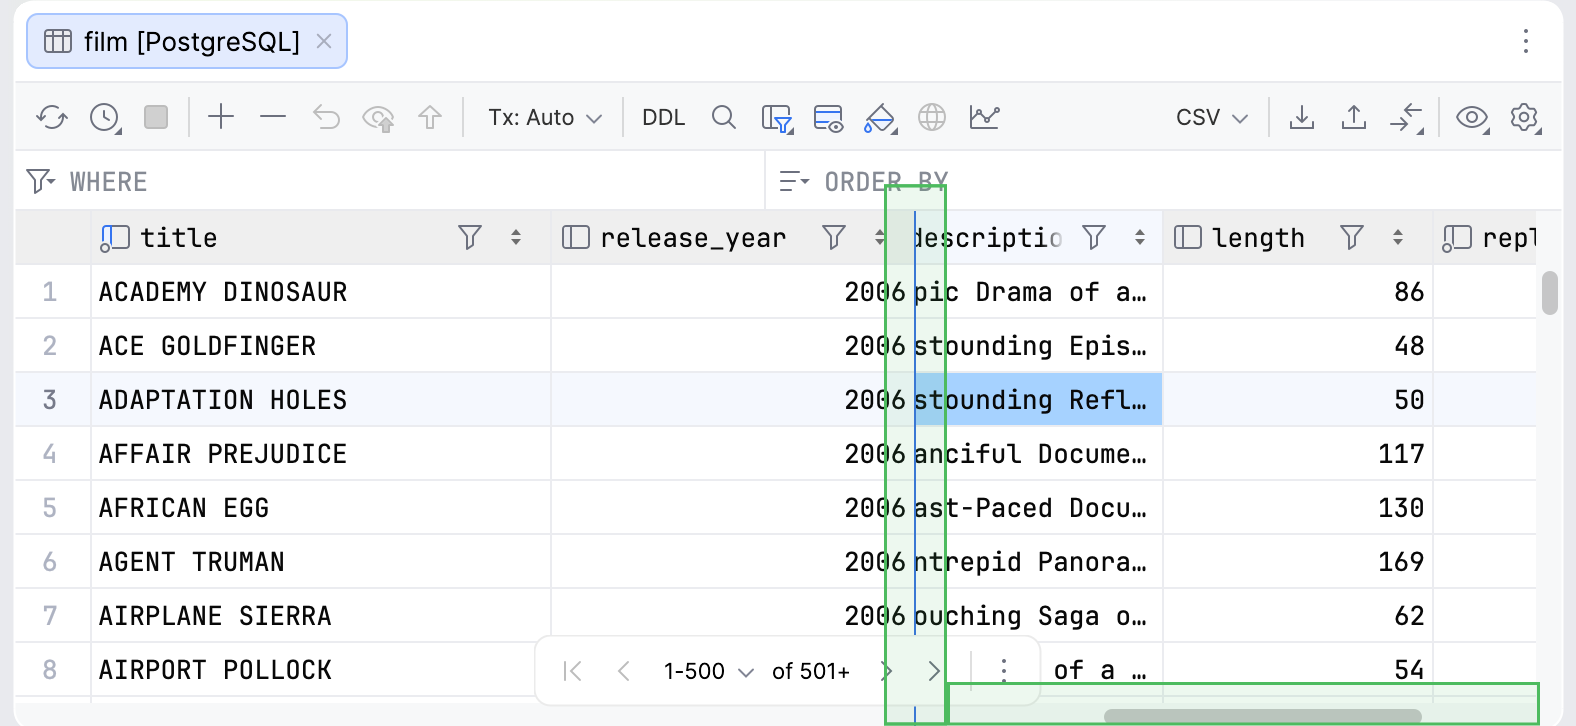
To unpin columns, right-click a header and select Unpin Column, Unpin Columns, or Unpin All Columns.
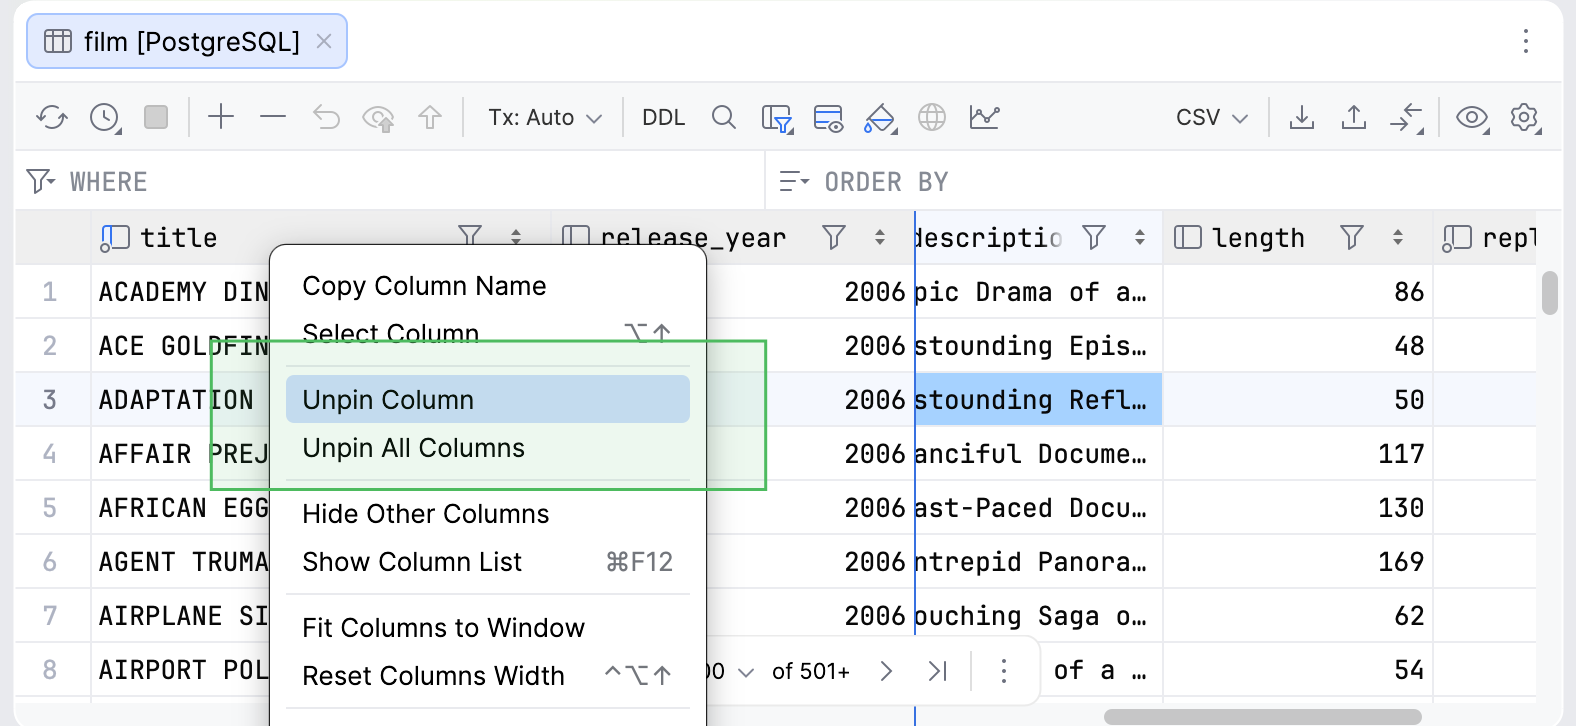
Pinning actions are unavailable if the pinned section would take up too much horizontal space, leaving insufficient room to scroll the remaining columns.
Automatic column sizing in the data editor
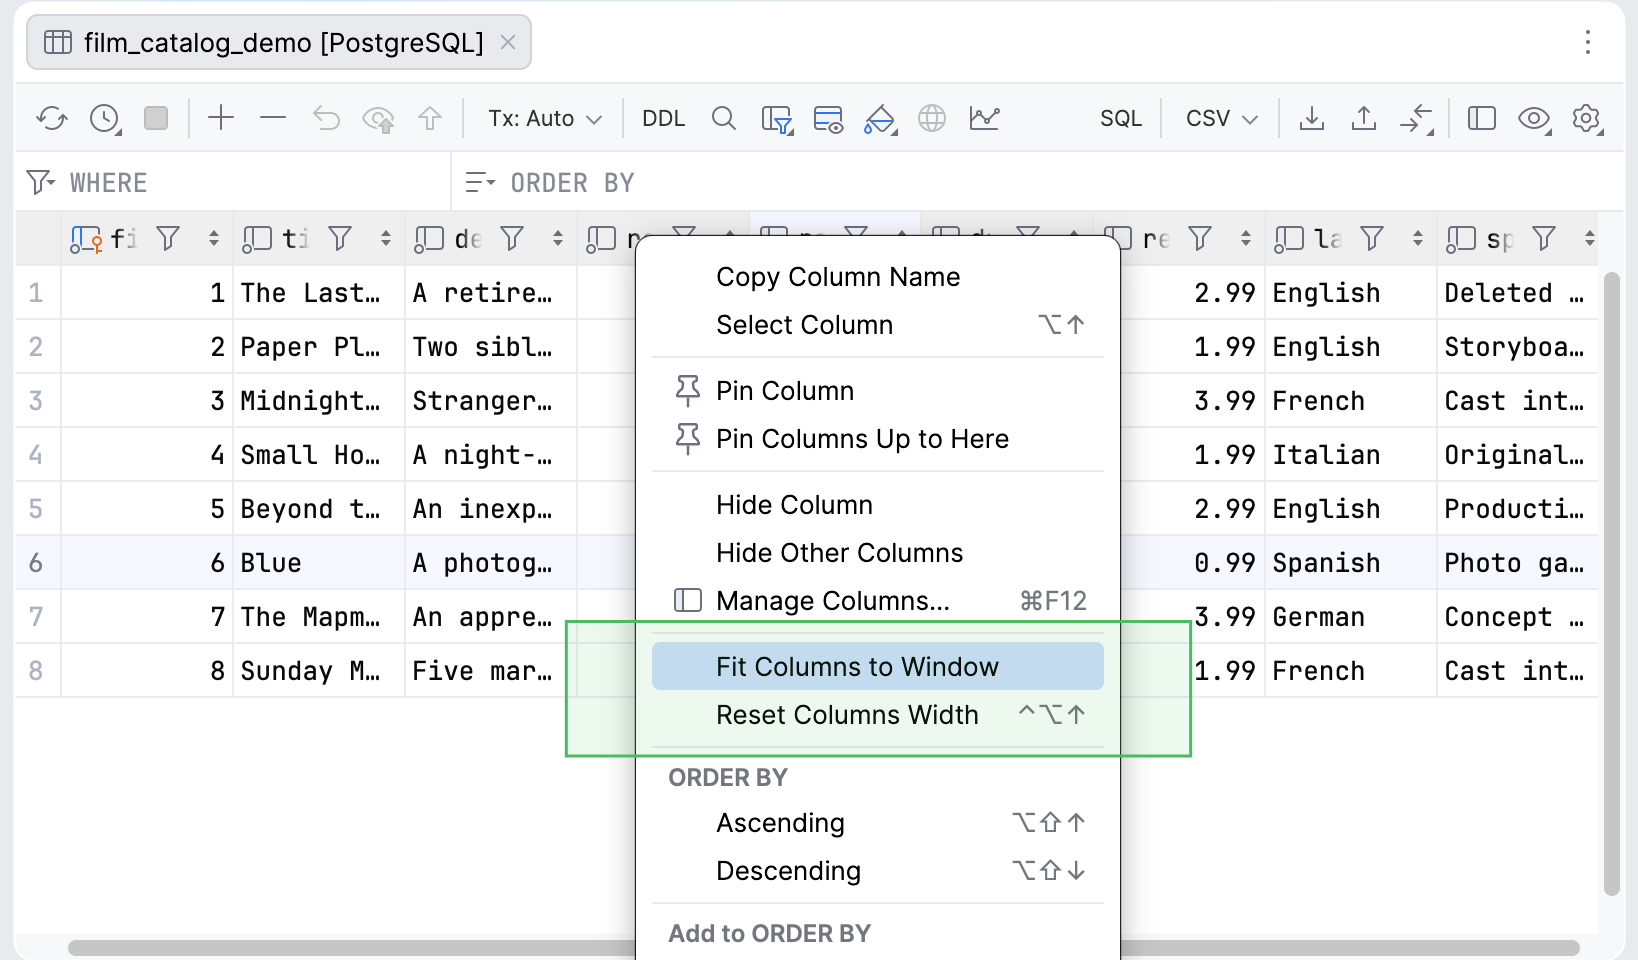
You can now automatically resize columns to fit the available width of the data editor.
To do this, right-click a column header and select Fit Columns to Window. To restore the default widths, select Reset Columns Width from the same context menu
New Manage Columns popup
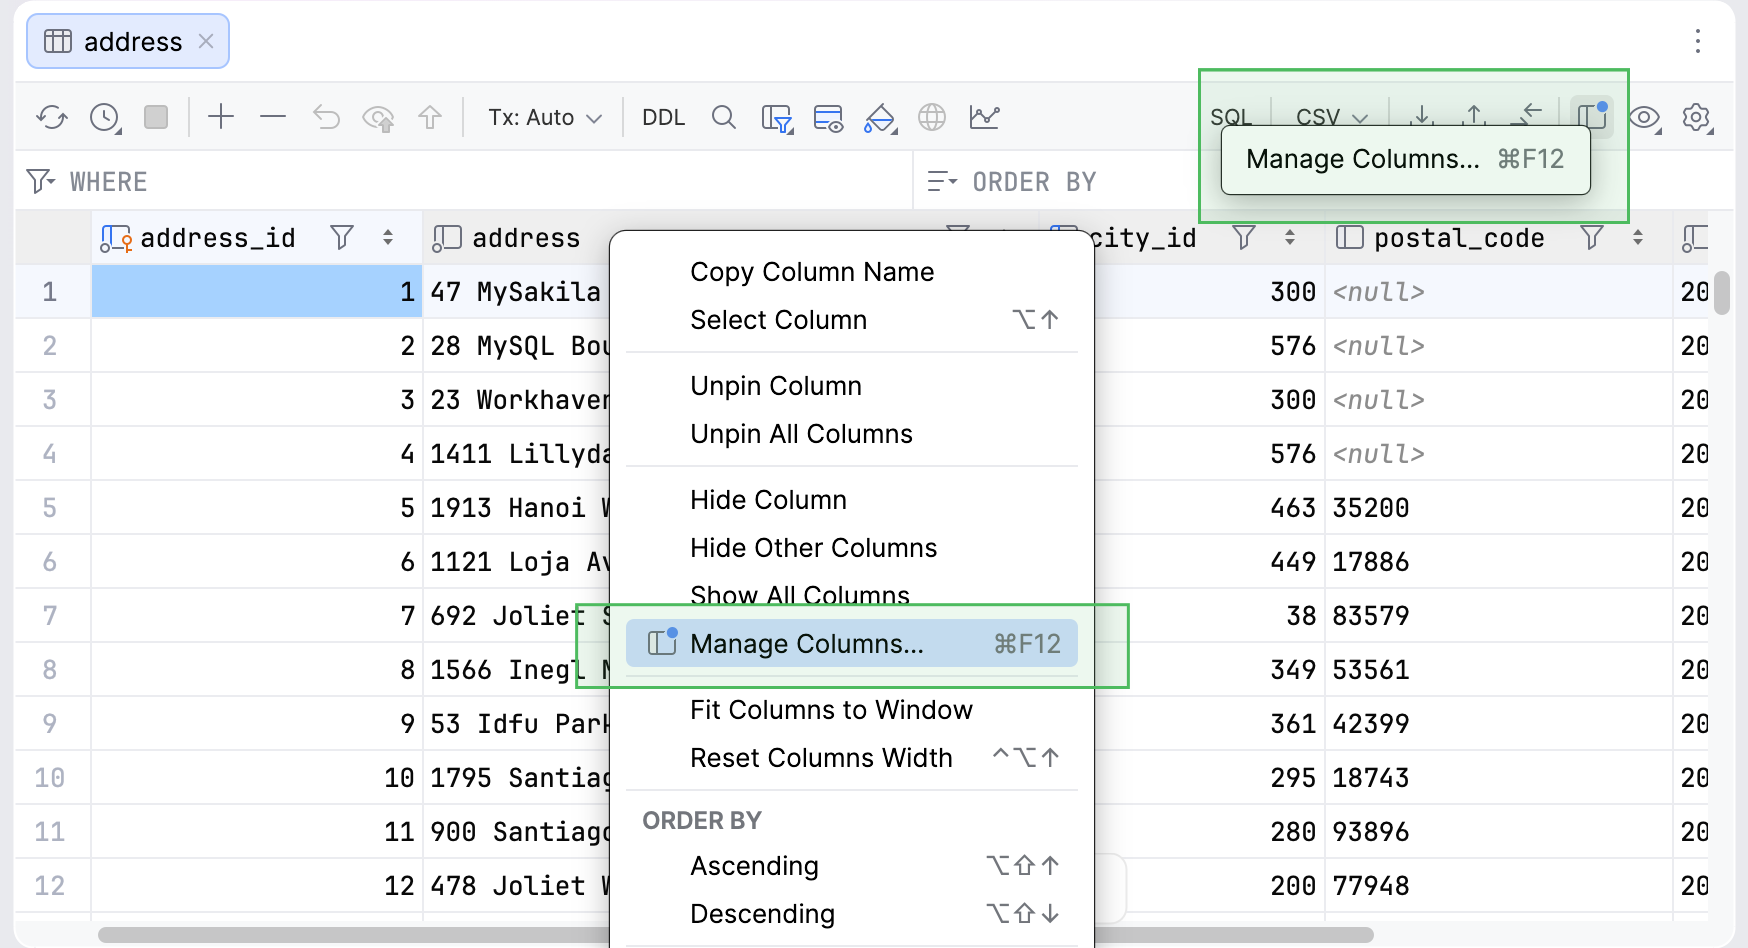
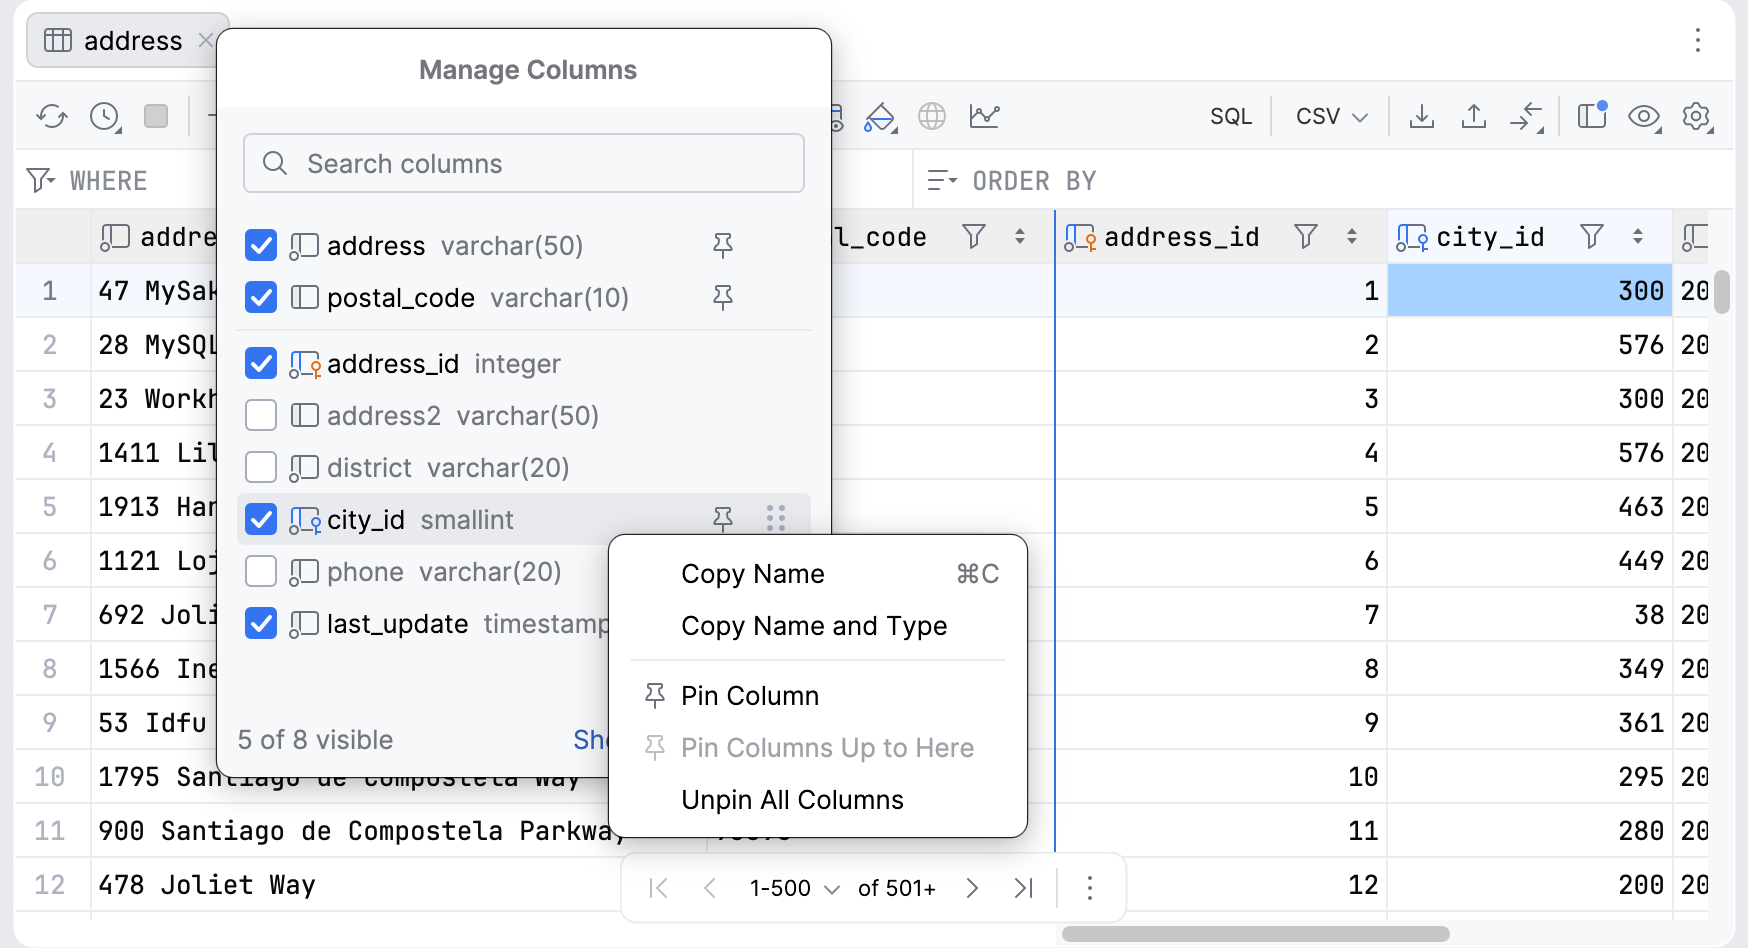
We’ve redesigned the column list to make it easier to work with wide tables and query results. The new Manage Columns popup replaces the old Show Column List popup and lets you find columns, select the ones to display, and adjust their order in one place.
To open it, click Manage Columns on the data editor toolbar or press Ctrl+F12. Alternatively, right-click a column header and select Manage Columns. An indicator on the toolbar icon shows when some columns are hidden.
In the popup, you can:
Search for columns by name and show or hide all matching columns at once.
Show or hide individual columns using the checkboxes, or press Space to toggle the visibility of selected columns.
Drag column names to change their order in the grid. Alternatively, select a column and press Alt+Up or Alt+Down.
Right-click columns to pin or unpin them, copy their names and data types, or restore the original column order.
Press Enter or double-click a column to close the popup and navigate to it in the grid. If the column is hidden, DataGrip makes it visible.
Each column’s data type appears next to its name, and pinned columns are grouped at the top of the list. Changes to column order and pinning are immediately reflected in the grid.
Query consoles
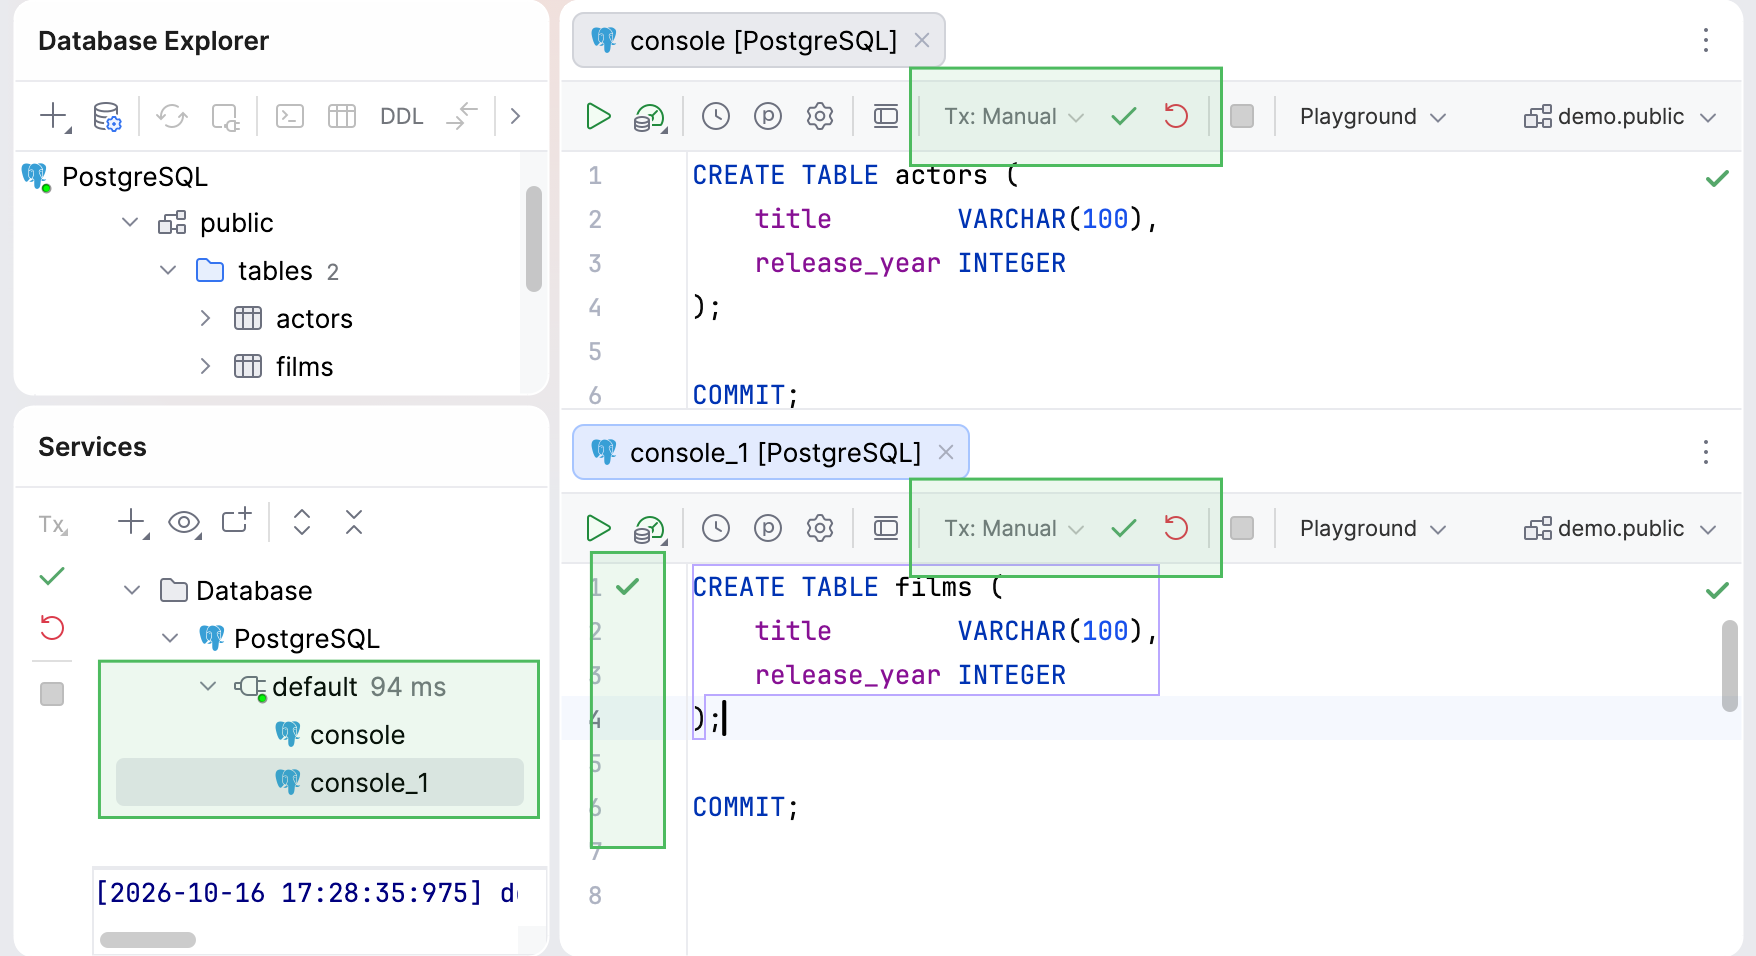
Improved transaction control in query consoles
We’ve improved how DataGrip tracks and displays the transaction state in Manual mode on the editor toolbar.
Transaction control statements
When you execute
COMMITorROLLBACKin the query console, theCOMMITandROLLBACKbuttons now become disabled, same as they do when you commit or roll back a transaction using the toolbar. This works in PostgreSQL, Greenplum, MySQL, MariaDB, and Oracle. This update also coversEND,ABORT, andAND CHAINvariants where supported by the DBMS. In Oracle, DataGrip also tracks implicit commits caused by DDL statements.Fixes for
COMMIT,ROLLBACK, and savepoint statementsWe've fixed several issues with
COMMIT,ROLLBACK, and savepoint statements that you run yourself in the query console. In PostgreSQL, statements that followCOMMITorROLLBACKno longer fail, and your own savepoints now work as expected.SAVEPOINTandRELEASE SAVEPOINTalso no longer trigger introspection.Consistent state across consoles
Query console that share a session now display the same transaction state. You can commit or roll back the transaction from any of them.
Correct initial button state
The Commit and Rollback buttons no longer incorrectly appear active after you start the IDE or open a new console.
Updated defaults for automatic savepoints
After a failed statement, PostgreSQL rejects all further statements in the transaction. In order to let you continue, DataGrip can create an unnamed savepoint before each statement and roll back to it if the statement fails. Databases outside the PostgreSQL family do not need this, so the behavior is now disabled by default for them, and the IDE no longer sends unnecessary
SAVEPOINTstatements.To change this behavior, toggle the Automatically roll back a failed statement to an unnamed savepoint option on the Advanced tab of the Data Sources and Drivers dialog.
Known limitations:
In MySQL and MariaDB, DataGrip does not yet track implicit commits caused by DDL statements.
In other DBMSs, such as Microsoft SQL Server, executing transaction control statements does not update the Commit and Rollback buttons.
When you use Execute Selection as Single Statement, DataGrip cannot determine how the selection affects the transaction state, so the Commit and Rollback buttons remain active.
Database support
Support for MariaDB sequences and packages
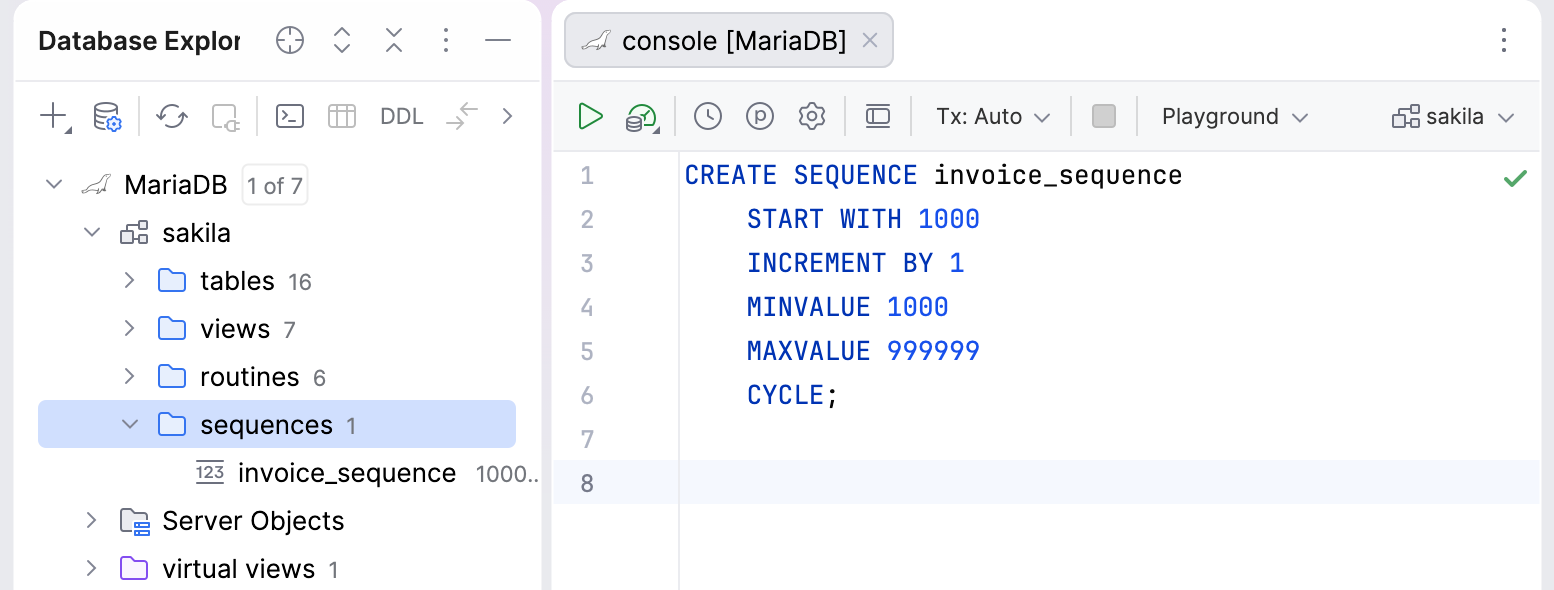
DataGrip now recognizes MariaDB sequences and displays them in a dedicated sequences group under the schema node in the Database Explorer. Previously, they appeared as tables.
We’ve also added initial support for MariaDB packages. DataGrip now introspects packages and their bodies, displays them correctly in the Database Explorer, and loads their source code. You can generate their DDL, drop them, and refresh individual packages.
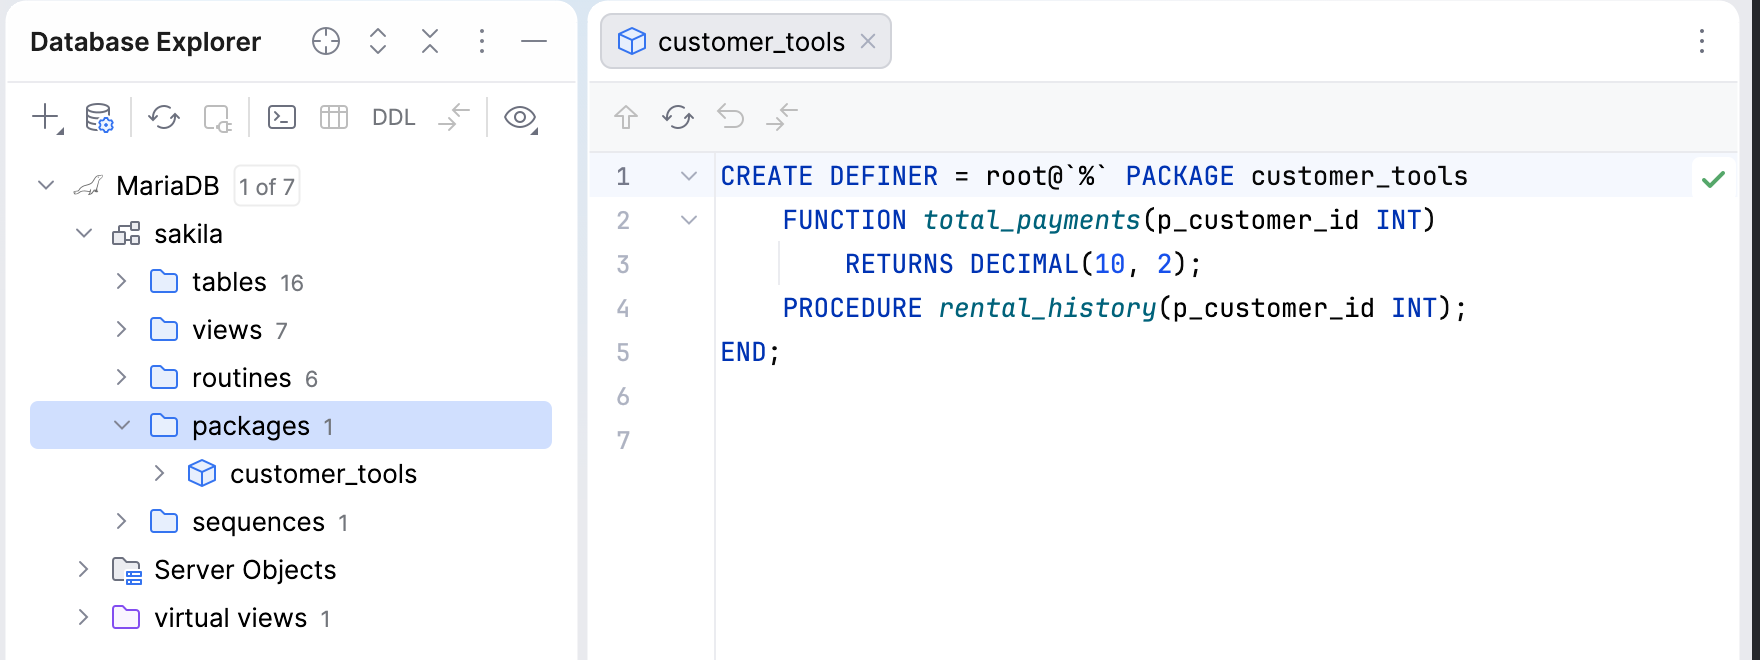
In the code editor, we've improved support for package syntax, including:
IF NOT EXISTSclauses inCREATE PACKAGEandCREATE PACKAGE BODYstatements.RECORD,REF CURSOR, and associative array(TABLE OF … INDEX BY)type declarations.User-defined types for variables, routine parameters, and return types.
Forward routine declarations in package bodies.
CONDITION FOR SQLSTATEdeclarations.
DataGrip also recognizes the package syntax of the default sql_mode (SQL/PSM).
This initial support has a few limitations:
Some package code may still show false syntax errors or unresolved references.
The database explorer does not show package members, such as routines and types.
Navigation between a package and its body is not yet possible.
PostgreSQL 19 support
We’ve added support for PostgreSQL 19. DataGrip now recognizes the following syntax:
INSERT ... ON CONFLICT DO SELECT ... RETURNINGfor returning an existing row when an insert encounters a conflict.WAIT FOR LSNfor waiting until write-ahead log processing reaches a specified log sequence number.The
EXCEPTclause inCREATE PUBLICATIONfor excluding specific tables from a publication.
We’ve also updated DataGrip’s minicatalogs to include new functions in PostgreSQL 19.