Analysis Overview
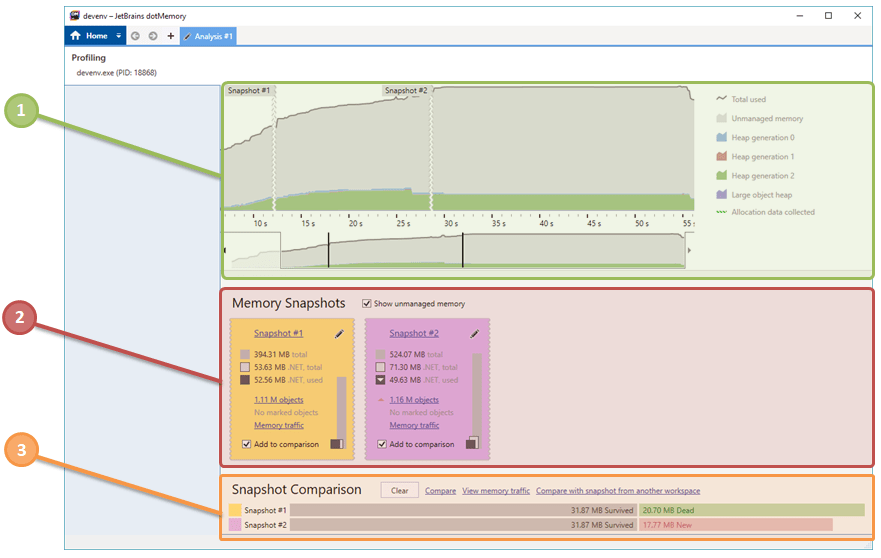
After you finish with collecting profiling data, dotMemory opens a new tab with the Analysis Overview page.
The Analysis Overview page provides you with information about data collected during the session:
Timeline
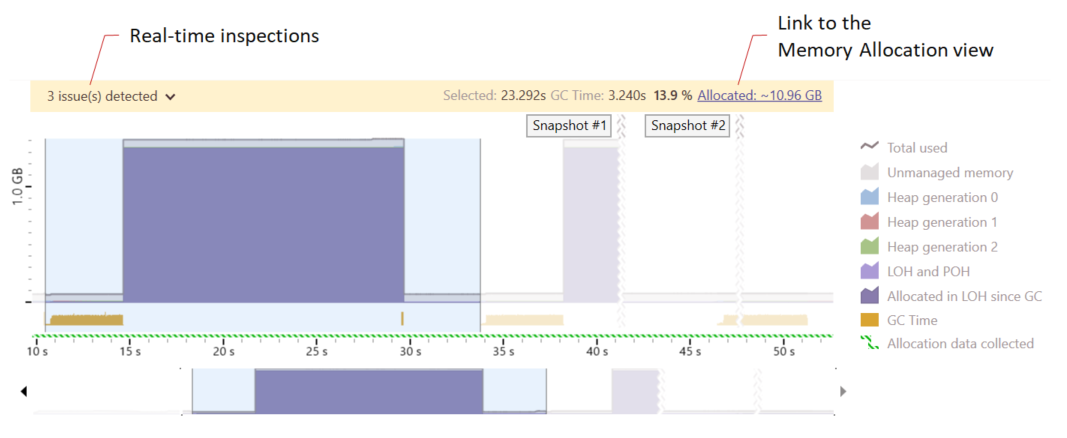
The timeline graph shows how your app consumed memory during the profiling process. The timeline consists of four charts showing instant sizes of Gen0, Gen1, Gen2 heaps, Large Object Heap and Pinned Object Heap. You can also add the chart showing the size of unmanaged memory by selecting the Show unmanaged memory parameter.
The timeline graph could be a good starting point for your analysis:
To see the exact memory heap values at a specific time point, click the timeline graph in this point.
To see how much memory was allocated on a time interval, select the desired interval on the graph. To get the details on what objects were allocated on this interval and what functions allocated these objects, click the Allocated: ... MB link. This will open the Memory allocation view.
If you are not sure where to start, check the results on the real-time inspections. Read further for more details.
Real-time inspections
During profiling, dotMemory analyzes memory allocation data on the fly. It uses the data to automatically detect a number of potential memory allocation issues:
When an issue is detected, dotMemory shows it in the list on top of the timeline graph. To select a particular time interval where the issue was detected, select the issue in the list.
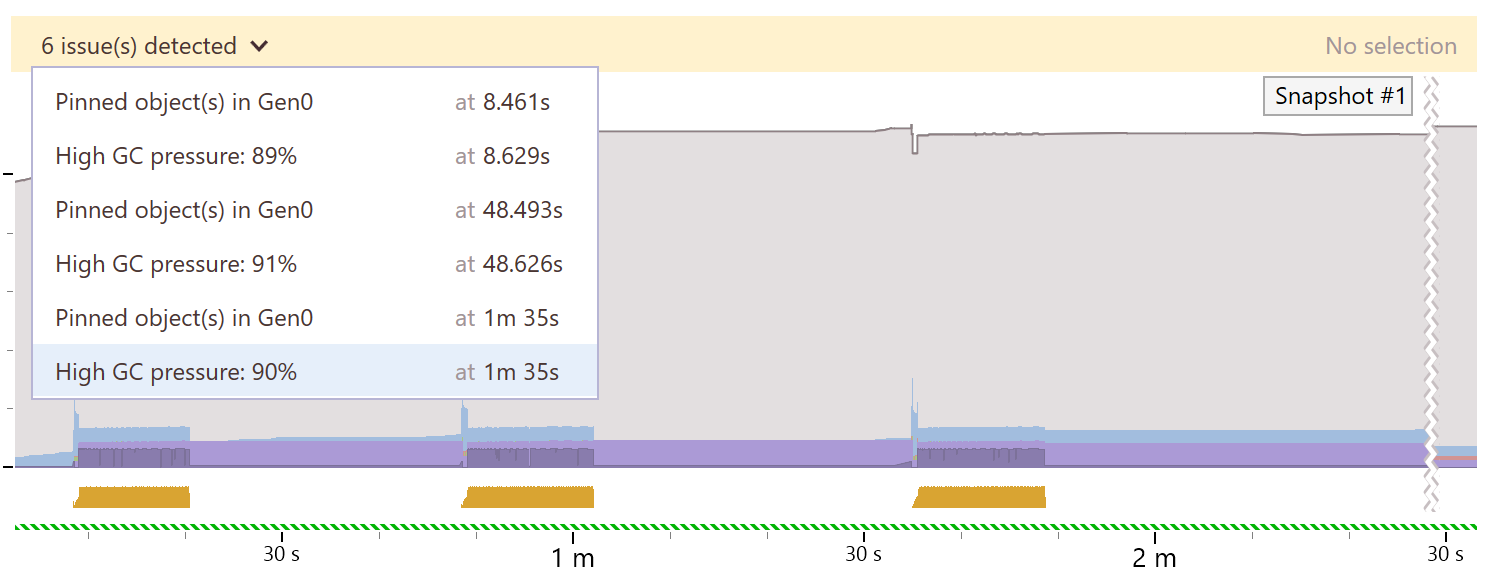
Pinned objects in Gen0
In some cases, for example, when working with unmanaged code (say, an external library) from the managed code, your application may allocate the so-called pinned objects. Such objects are "pinned" in the small object heap – they cannot be moved in the heap as the managed code relies on the exact position of such objects. This leads to a negative consequence – Garbage Collector cannot compact the small object heap. This may result in more often and less efficient GCs reducing the overall application performance.
For example, we have the following objects layout in the Gen0: [A][B][Pinned][C][D]. The objects [A] and [B] cannot be collected until the [Pinned] object is removed from the heap.
dotMemory is able to automatically detect allocation of pinned objects in the Gen0 segment of the managed heap.
The possible origin of the pinned objects:
You can intentionally create pinned objects using the
fixedblock:unsafe { var buffer = new byte[2000]; fixed (byte* ptr = buffer) { ... } }You create a
GCHandleto an object that prevents it from garbage collection:var buffer = new byte[2000]; var gCBuffer = GCHandle.Alloc(buffer, GCHandleType.Pinned);
Possible solutions:
If possible, consider using stackalloc to allocate the buffer on the stack instead of the heap:
var buffer = stackalloc byte[2000];If the buffer contains pinned objects, it may be more reasonable to allocate it on the Large Object Heap instead of the Small Object Heap. To do so, make the buffer larger than 84 KB.
High GC pressure
High GC pressure is the situation when garbage collection is performed too often and takes a significant amount of time. Namely, when the time spent on garbage collection takes more than 30% of the overall execution time during some sample certain time interval.
The typical causes:
The program creates a lot of short-living objects, for example closures in a loop.
The program is close to Out of Memory.
The possible solution is to revise your code to prevent frequent allocations. You can find more examples of such issues in this series of blog posts:
Fast LOH growth rate
The Large Object Heap (LOH) is a special segment of the managed heap that stores large objects (>84 KB). dotMemory tracks the growth of LOH in real-time. If LOH grows too fast, it may become heavily fragmented and end up in throwing the OutOfMemory exception.
The typical cause:
Dynamically-sized collections such as Dictionary, List, HashSet, and StringBuilder have the following specifics: When the collection size exceeds the current bounds, .NET resizes the collection and redefines the entire collection in memory.
The possible solution could be reducing the number of cases when the resize is needed. Try to predict the required size and initialize a collection with this size or larger.
Collected snapshots
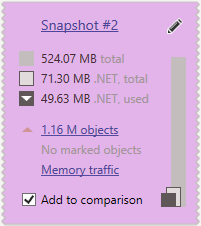
This area contains short reports about all snapshots collected during profiling. Each report allows you to:
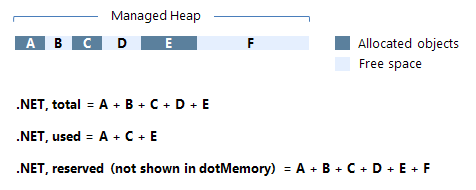
Get details about the total amount of memory* requested by your app. The total value (grey bar) consists of:
Unmanaged memory: memory allocated outside of the managed heap and not managed by Garbage Collector. Generally, this is the memory required by .NET CLR, dynamic libraries, graphics buffer, and so on. This part of memory cannot be analyzed in the profiler.
if you clear the Show unmanaged memory checkbox, the size of unmanaged memory will be subtracted from the total value..NET, total (grey bar with an outline): the amount of memory in the managed heap used by the app including free space between allocated objects. See the image below for more details.
.NET, used (dark grey bar): the amount of memory in the managed heap used by the app excluding free space. This is the only part of memory .NET allows you to work with.
Open a snapshot in the Snapshot view by clicking the snapshot name.
Rename a snapshot using the
 button.
Open all objects in the heap for analysis (using the [objects size] objects link). In this case, the 'All objects' object set will be opened in the Group by Types view.
Open marked objects for analysis (using the Marked objects link). The 'Marked objects' object set will be opened in the Group by Types view. Learn more about marking objects in the section Marking an Instance.
View memory traffic (using the Memory traffic link) generated by the app from the start of the profiling session to the moment of getting a snapshot. Learn more about analyzing traffic in the section Analyzing Traffic.
Snapshot comparison area
To compare two snapshots drag them to the Comparison area or click Add to comparison for each snapshot. Learn more about how to compare snapshots in the section Comparing Snapshots.