Analyze Memory Traffic
Memory traffic information shows you how much memory was allocated and released during a particular time interval.
Traffic analysis is the main instrument for determining ineffective memory usage in your app. Excessive allocations and garbage collections may result in significant memory management overhead. For example, you have an array of objects which should be updated over time. You can update each object in two ways: by creating a new instance with required properties or by updating properties of the existing instance. From the functionality perspective, both options are the same. But from the point of memory management workload, creating a new instance all the time is much less effective.
Use the Memory Traffic view to understand what objects are created/collected most intensively in your app and what functions cause this memory traffic.
How to get memory traffic data
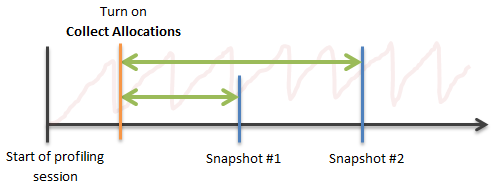
dotMemory collects memory traffic information along with other allocation data. To begin traffic analysis, open the Analysis Overview page. Here you can select the time interval for the analysis:
Traffic between the start of a profiling session and the time of getting a particular snapshot
Traffic between a specific time point and the time of getting a particular snapshot
Start of a profiling session - Snapshot

To get these data, you must select Collect memory allocation and traffic data from start in the profiling options.
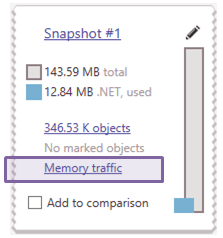
To view traffic data, click the Memory traffic link for the desired snapshot. After this, traffic data will be shown in the Memory Traffic view.

Specific point in time - Snapshot

To get these data, you must clear Collect memory allocation and traffic data from start in the profiling options. During profiling, to indicate the time point from which you want to collect the data, click the Collect Allocations button.
To view traffic data, click the Memory traffic link for the desired snapshot. After this, traffic data will be shown in the Memory Traffic view.
Snapshot - Snapshot

Enable traffic data collection on the interval between snapshots. You can do this either with Start collecting allocation data immediately in the profiling options or using the Collect Allocations button during profiling.
To view traffic data, drag the desired snapshots to the comparison area and click View memory traffic. After this, traffic data will be shown in the Memory Traffic view.

Memory Traffic view
The Memory Traffic view lets you group traffic data in two ways:
Group by Types
Use this grouping to get info about what objects were created/collected most intensively during the selected time interval. The view consists of two lists: the Objects list and Functions list.
The Objects list shows all created objects grouped by types. If you click a certain type, the Functions list will show you the sequences of functions (back traces) that have created corresponding objects.
Back Traces
Use this grouping to understand what functions generate main memory traffic. As well as the Group by Types, Back Traces consists of the Functions list and Objects list. Clicking a certain function in the Functions list will show you all objects created by this function.
The Objects list has the following columns:
| Name | Description |
|---|---|
| Type | Type name. |
| Allocated bytes | The size of all objects of a particular type created during the analysis timeframe. |
| Allocated objects | The number of all objects of a particular type created during the analysis timeframe. |
| Collected bytes | The size of all objects of a particular type collected during the analysis timeframe. |
| Collected objects | The number of all objects of a particular type collected during the analysis timeframe. |
The Functions list has the following columns:
| Name | Description |
|---|---|
| Function | Function name. |
| Allocated bytes | The size of all objects created by a particular function during the analysis timeframe. |
| Allocated objects | The number of all objects created by a particular function during the analysis timeframe. |
| Collected bytes | The size of all objects that were created by a particular function and then collected during the analysis timeframe. |
| Collected objects | The number of all objects that were created by a particular function and then collected during the analysis timeframe. |