Analyze Memory Allocation
The Memory Allocation view shows how the profiled application allocates memory on an arbitrary time interval. The main feature of the view is that it can show you data even when profiling is still in progress: memory snapshots are not required.
Use the Memory Allocation view to analyze allocations on specific time intervals: find out what objects were allocated during this time and what functions allocated these objects.
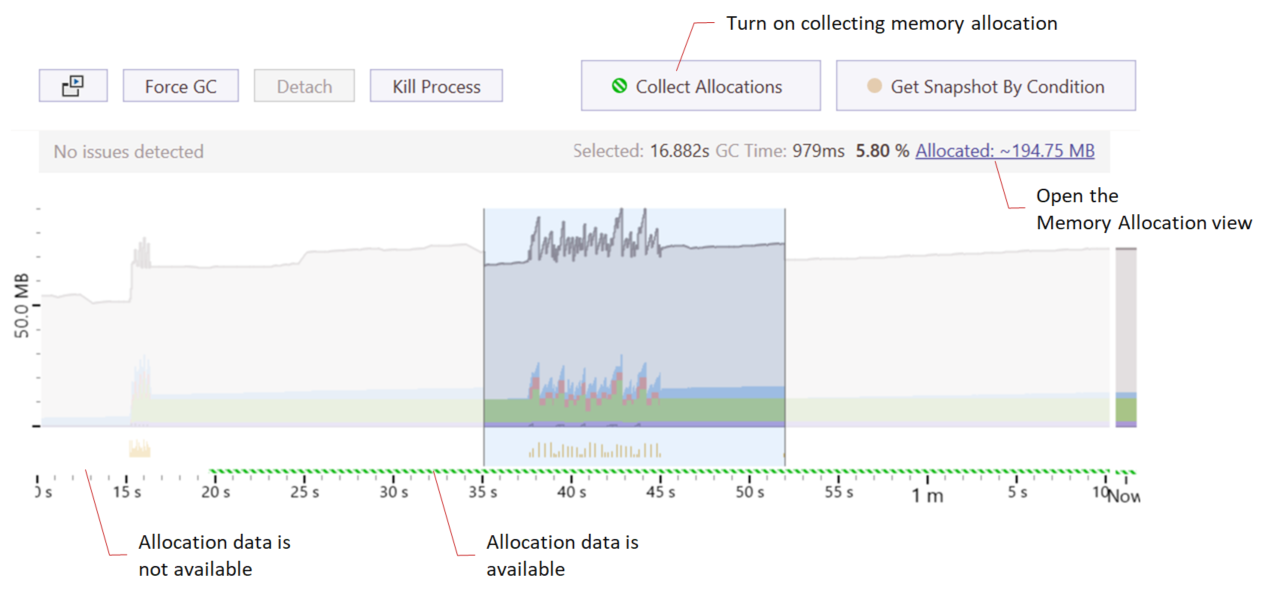
How to open the Memory Allocation view for a specific time interval

Start a profiling session or open an existing workspace (created in dotMemory 2021.1 or later).
On the Timeline graph, select a desired time interval.
Note that the desired time interval must contain the memory allocation data (it is shown with the green shaded line below the timeline graph). To turn on collecting memory allocation data, use the Collect Allocations button during profiling or select Collect memory allocation and traffic data from start when configuring the profiling session.
Click the Allocated: ... MB link to open the Memory Allocation view.
Memory Allocation view

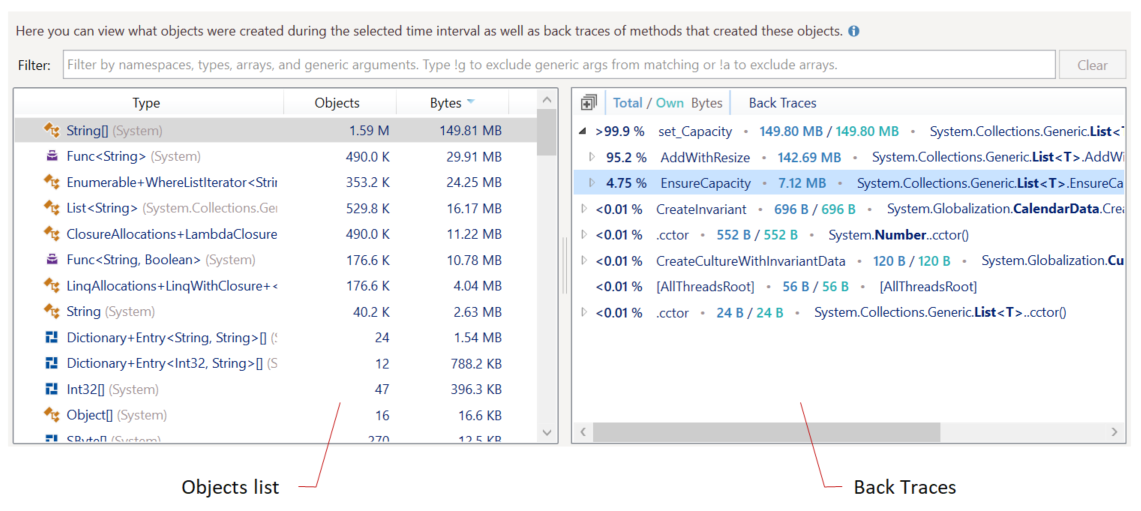
The Memory Allocation view consists of two parts: the objects list and the Back Traces tree.
Objects list
The list shows you the objects allocated on the selected time interval sorted by the object type. Select a particular type to see what functions allocated the objects of this type.
| Name | Description |
|---|---|
| Type | Type name. |
| Objects | The number of objects of the same type. |
| Bytes | The overall shallow size of objects in bytes. |
Back Traces
The Back Traces tree shows you all call trees that allocated the objects currently selected in the objects list. The calls are shown from the bottom up: the last call in the call stack is a top node. In other words, Back Traces is the inverted call tree.
You can sort the tree by the amount of allocated memory (Total / Own Bytes) or by the number of allocated objects (Total / Own Objects ). To switch the sorting, click the Total / Own ... column header.
The Total / Own ... column shows how much memory (objects) were allocated in a particular call tree (Total) or in a particular call (Own ).
For example:

The set_Capacity method allocated 149.80 MB (Own ). The method was called from two call stacks:
through the
AddWithResizemethod: 142.69 MBand through the
EnsureCapacitymethod: 7.11 MB