IntelliJ IDEA overview
IntelliJ IDEA is an Integrated Development Environment (IDE) for professional development in Java and Kotlin. It is designed to maximize developer productivity and has a strong focus on privacy and security. It does the routine and repetitive tasks for you by providing clever code completion, static code analysis, and refactorings. It lets you focus on the bright side of software development, making it not only productive but also an enjoyable experience.
Multi-platform
IntelliJ IDEA is a cross-platform IDE that provides a consistent experience on Windows, macOS, and Linux.
For more information about OS-specific instructions, refer to Install IntelliJ IDEA.
For more information about choosing the right keymap for your operating system and learning the most useful shortcuts, refer to IntelliJ IDEA keyboard shortcuts.
Supported languages
The development of modern applications involves using multiple languages, tools, frameworks, and technologies. IntelliJ IDEA is designed as an IDE for JVM languages, but numerous plugins can extend it to provide a polyglot experience.
JVM languages
Use IntelliJ IDEA to develop applications in the following languages that can be compiled into the JVM bytecode, namely:
Other languages
Plugins add support for some of the most popular languages, namely:
JavaScript (full WebStorm functionality)
C/C++ (full CLion functionality)
TypeScript (full WebStorm functionality)
Stylesheets (CSS, Less, Sass)
You can browse JetBrains Marketplace to find an official plugin that adds support for almost any language, framework or technology used today, or for third-party plugins. For more information about managing plugins, refer to Install plugins.
Do I need a language plugin for IntelliJ IDEA or a separate IDE?
IntelliJ IDEA is a superset of most IntelliJ platform-based IDEs. If the bundled language plugins are enabled, it includes support for all technologies that are available within our more specific IDEs, such as PyCharm, WebStorm, PhpStorm, and so on.
So, for example, if your application's codebase is mainly in Java but it also uses Python scripts, we recommend using IntelliJ IDEA in combination with the bundled Python plugin. If your codebase is mainly in Python, PyCharm is the right IDE for you.
IntelliJ IDEA editions
Previously, IntelliJ IDEA was offered as two separate products: IntelliJ IDEA Community Edition and IntelliJ IDEA Ultimate with extended capabilities.
Starting with IntelliJ IDEA 2025.3, we're combining these two editions into a single, unified product: IntelliJ IDEA. This change allows all users to access essential functionality without needing to decide between editions.
The core functionality of IntelliJ IDEA remains free and now comes with even more features compared to the former Community Edition. Additionally, the new Ultimate subscription gives you access to advanced tooling with a free 30-day trial available for all users when installing IntelliJ IDEA.
Afterward, you can choose to subscribe or continue using IntelliJ IDEA for free.
For more information about the Ultimate subscription, refer to the comparison matrix.
The Early Access program
IntelliJ IDEA is available for free within the Early Access Program (EAP). EAP builds are published before the release of a stable product version, and you can download them to try out the new features before they are publicly available in return for your feedback. EAP builds are configured to collect feature usage statistics and are a valuable source of information for our developers. You can also report an issue if you encounter any problems.
User Interface
IntelliJ IDEA provides an editor-centric environment. It follows your context and brings up the necessary tools automatically to help you minimize the risk of interrupting the developer's flow.
Take a guided tour around IntelliJ IDEA user interface.
Ergonomic design and customizable appearance
One of the best things about IntelliJ IDEA is its tunability. You can configure virtually anything: the IDE appearance, the layout of tool windows and toolbars, code highlighting, and more. There are also numerous ways you can fine-tune the editor and customize its behavior to speed up navigation and get rid of any extras that distract you from code.
Configure the colors and fonts for your source code, console output, debugger information, search results, and more. You can choose from a number of predefined color schemes or customize a scheme to create a unique working environment.
Learn how to configure the editor settings, including appearance, font, code formatting, and more.
Customize menus and toolbars to spare the annoyance of looking for an action among a dozen buttons you never use.
Shortcuts for everything
In IntelliJ IDEA, you have shortcuts for nearly every action, including selection and switching between the editor and various tool windows.
Use the most useful shortcuts to invoke frequent actions without switching your focus from the editor and tune your keymap to assign custom shortcuts for your favorite commands.
Watch this video to learn about some of the most useful shortcuts:
Navigation and search
IntelliJ IDEA provides quick navigation not only inside source code files but also throughout the entire project.
One of the most useful shortcuts that is worth remembering is double Shift that brings up the Search Everywhere dialog: start typing, and IntelliJ IDEA will look for your search string among all files, classes, and symbols that belong to your project, and even among the IDE actions.
Here are some of the most useful navigation shortcuts:
Action | Shortcut |
|---|---|
Search everywhere | Double Shift |
Go to file | Ctrl+Shift+N |
Go to class | Ctrl+N |
Go to symbol | Ctrl+Alt+Shift+N |
Go to declaration | Ctrl+B |
For more information about navigating through the source code, refer to Source code navigation. Learn the most useful shortcuts that help you quickly switch between the editor and various tool windows, switch focus, jump to the Navigation bar, and so on.
Recent files and locations
Normally, you work with a small subset of files at a time and need to switch between them quickly. The Recent Files action is a real time-saver here. Press Ctrl+E to see a list of last accessed files. Note that you can also use this action to open any tool window:

Apart from jumping to a recent file, you can also get quick access to Recent Locations - that is code snippets you last viewed or edited. Press Ctrl+Shift+E and you'll be able to jump to a particular line you modified lately:

File structure
Press Ctrl+F12 to open the file structure popup that gives you an overview of all elements used in the current file and lets you jump to any of them:

Alternatively, use the Structure tool window Alt+7.
Find action
If you do not remember the shortcut or the menu path for an action you want to use, press Ctrl+Shift+A and start typing the action name:

Coding assistance
Code completion
IntelliJ IDEA helps you speed up the coding process by providing context-aware code completion.
Full Line completion suggests entire lines of code using ML models that are downloaded to your computer. Learn more from Full Line code completion.
Basic completion helps you complete the names of classes, methods, fields, and keywords within the visibility scope:

Type-Matching completion suggests the most relevant symbols applicable in the current context when IntelliJ IDEA can determine the appropriate type:

For more information about the different types of code completion available in IntelliJ IDEA with examples and productivity tips, refer to Code completion.
Refactorings
IntelliJ IDEA offers a comprehensive set of automated code refactorings that lead to significant productivity gains. For example, when you rename a class, the IDE will update all references to this class throughout your project.
You do not even need to bother to select anything before you apply a refactoring. IntelliJ IDEA is smart enough to figure out the statement you are going to refactor. It only asks for confirmation if several choices are possible. Press Ctrl+Alt+Shift+T to open a list of refactorings available in the current context:

For a full list of available refactorings with usage scenarios and the before and after examples, refer to the Refactoring code section.
Learn some of the most useful refactoring shortcuts:
Action | Shortcut |
|---|---|
Refactor this | Ctrl+Alt+Shift+T |
Rename | Shift+F6 |
Extract variable | Ctrl+Alt+V |
Extract field | Ctrl+Alt+F |
Extract a constant | Ctrl+Alt+C |
Extract a method | Ctrl+Alt+M |
Extract a parameter | Ctrl+Alt+P |
Inline | Ctrl+Alt+N |
Copy | F5 |
Move | F6 |
Static code analysis
IntelliJ IDEA provides a set of inspections that are built-in static code analysis tools. They help you find potential bugs, locate dead code, detect performance issues, and improve the overall code structure.
Inspections not only tell you where a problem is but also provide quick fixes that help you deal with it right away. Click the red bulb next to the highlighted code or press Alt+Enter to choose a fix:
Apart from quick-fixes, IntelliJ IDEA also provides intention actions that help you apply automatic changes to code that is correct. For example, you can inject a language, add Java annotations, add Javadoc, convert HTML or XML tags, and much more. To view a full list of intention actions, in the Settings dialog (Ctrl+Alt+S) , go to .
Code generation
IntelliJ IDEA provides multiple ways to generate common code constructs and recurring elements, which helps you increase productivity by delegating routine tasks to the IDE. This includes generating code from predefined or custom code templates, generating wrappers, getters and setters, automatic pairing of characters, and more. Press Alt+Insert to open a popup with the available constructs you can generate from your caret position. For more information, refer to Generate code.
Integration with developer tools
Apart from providing smart navigation and coding assistance, IntelliJ IDEA integrates the essential developer tools and lets you debug, analyze, and version the code base of your applications from within the IDE.
Debugger
IntelliJ IDEA provides a built-in JVM debugger. It lets you get and analyze runtime information, which is useful for diagnosing issues and getting a deeper understanding of how a program operates. It enables you to:
Suspend the program execution to examine its behavior using breakpoints. Multiple types of breakpoints, together with conditions and filters, allow you to specify the exact moment when an application needs to be paused.
Play with the program state by modifying variable values, evaluate expressions, and so on.
Examine variable values, call stacks, thread states, and so on.
Control the step-by-step execution of the program.
See Tutorial: Debug your first Java application to learn the basics of debugging and play with the debugger features in the IDE.
Profiler
For CPU and allocation profiling, IntelliJ IDEA provides integration with the following profilers:
Java Flight Recorder – a standard profiling tool shipped as part of the JDK.
Async Profiler – a very accurate profiler that can also collect native call and memory allocation data.
By default, IntelliJ IDEA runs both profilers in parallel to provide the most accurate results. While it is possible to use the supported profilers separately, the combined configuration that you get out of the box is a better choice for most scenarios. This approach leverages the advantages of both profilers and abstracts you from any setup whatsoever unless you have very specific requirements.
Terminal
IntelliJ IDEA includes a built-in terminal for working with a command-line shell from inside the IDE. For example, if you are used to executing Git commands from the command line, you can run them from the Terminal instead of invoking these actions from the menu.
The Terminal runs with your default system shell, but it also supports a number of other shells, such as cmd.exe, bash, sh, and so on.
Build tools
IntelliJ IDEA comes with a fully functional Gradle and Maven integration that allows you to automate your building process, packaging, running tests, deployment, and other activities.
When you open an existing Gradle or Maven project or create a new one, IntelliJ IDEA detects and automatically downloads all the required repositories and plugins, so you virtually do not need to configure anything and can focus solely on the development process. You can edit build.gradle and pom.xml files directly from the editor and configure the IDE to automatically sync all changes to the build configurations.
For more information about working with Gradle and Maven projects in IntelliJ IDEA, refer to Gradle and Maven.
Version Control
IntelliJ IDEA provides integration with the most popular version control tools: Git, Mercurial, Perforce, and Subversion.
You can review the history of your entire project or separate files, compare file versions, manage branches, and even process GitHub pull requests without leaving the IDE.
You can quickly access all VCS actions from the VCS operations popup Alt+`:

For more information about configuring integration with your VCS and performing the VCS-related operations, refer to Version control.
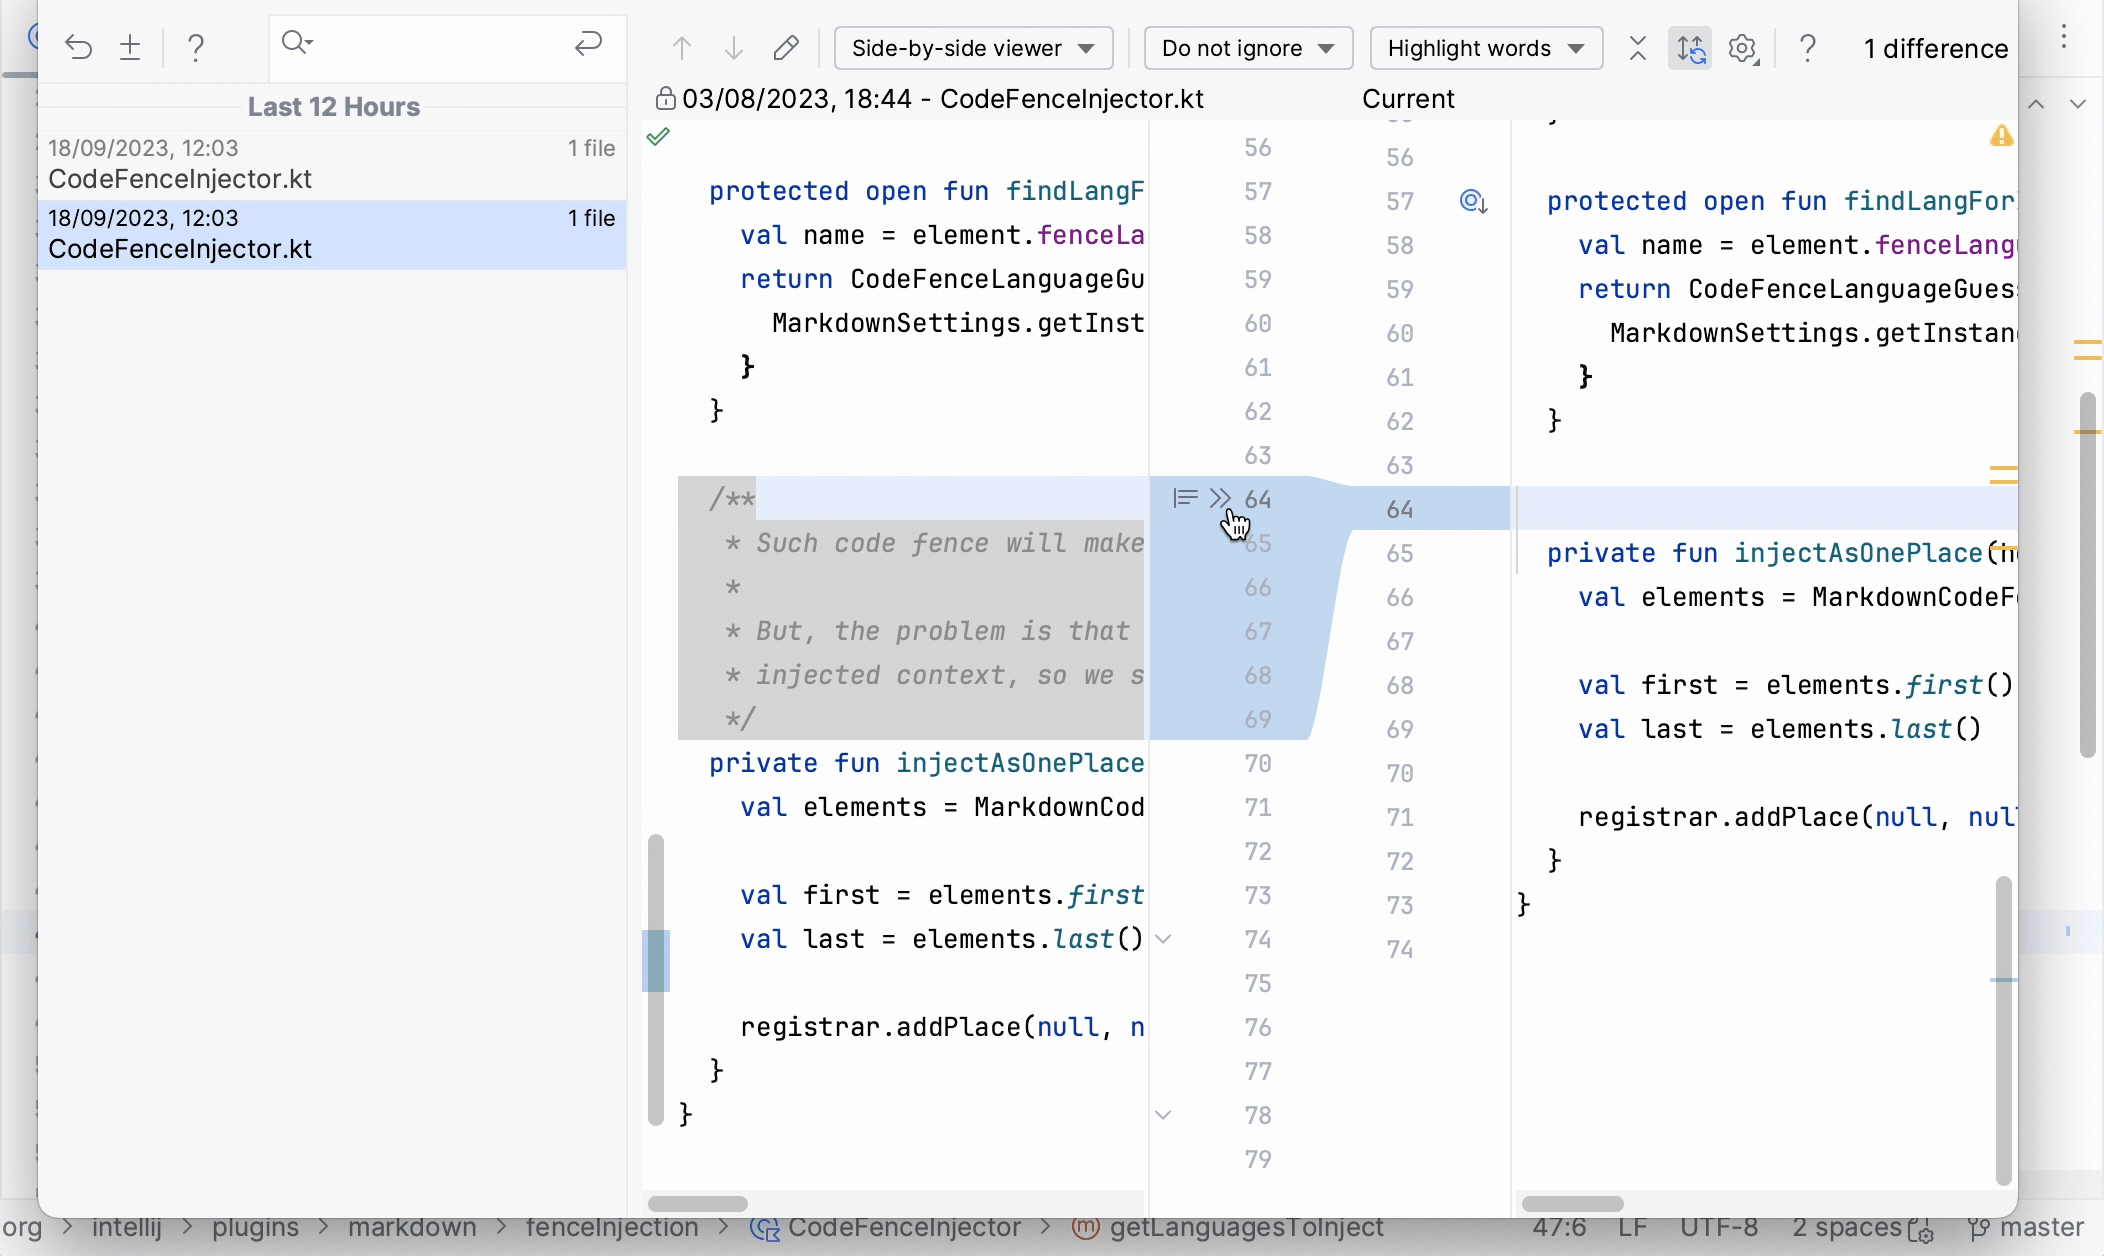
Local History
Even if no version control is enabled for your project yet, you can still keep track of modifications to your project and restore deleted files or separate changes with Local History. It acts as your personal version control system that automatically records your project's revisions triggered by various events as you edit code, run tests, deploy applications, and so on.
What's next
Watch this video tutorial to get started with IntelliJ IDEA
Learn the most useful tips for writing code in IntelliJ IDEA:
Happy developing!