Spring Boot run configuration
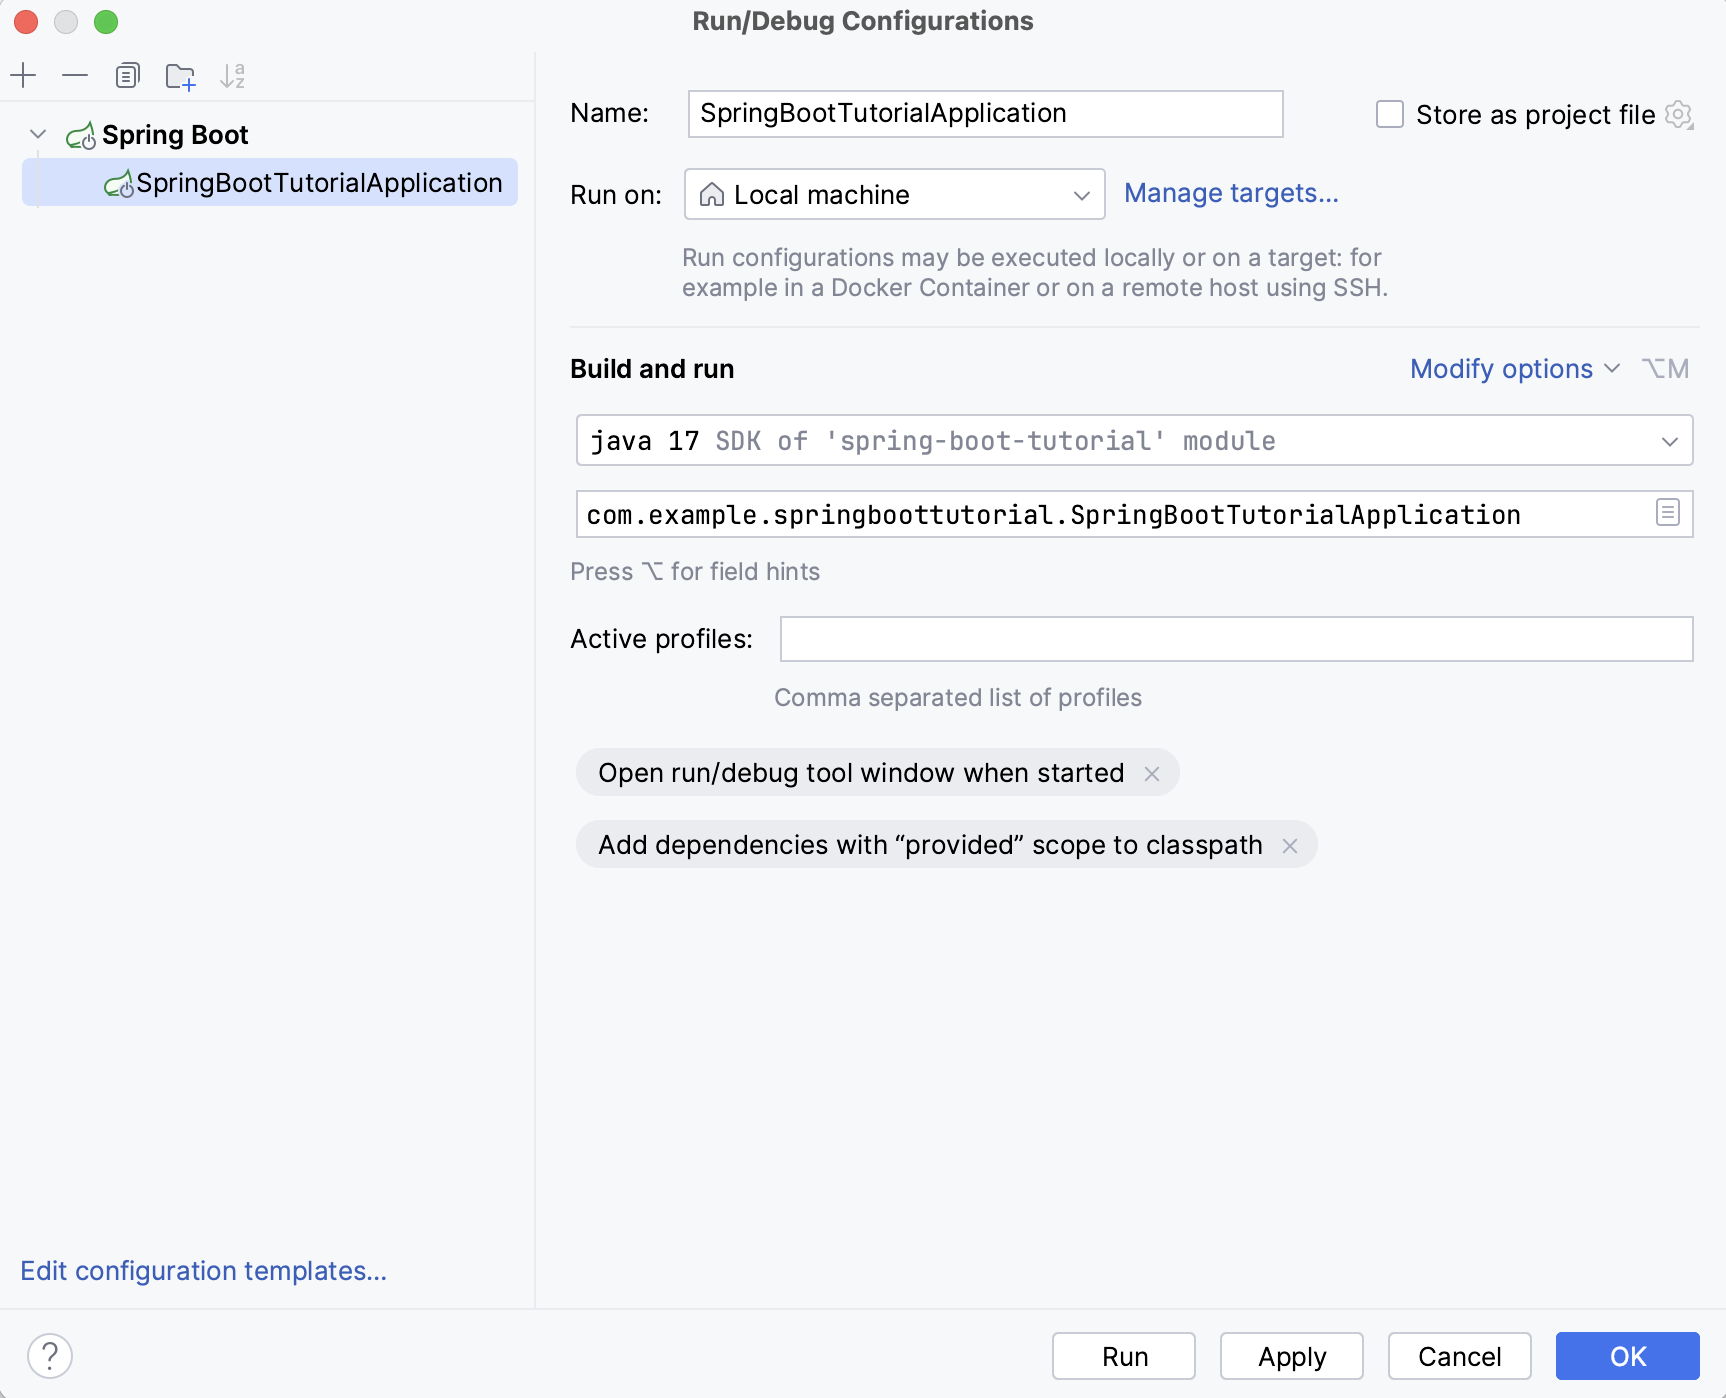
The Spring Boot run configuration defines how to run your Spring Boot application in IntelliJ IDEA. The IDE creates a Spring Boot run configuration when you run the application from the main class file. For more information, refer to Run a Spring Boot application.
Create the Spring Boot run configuration
In the main menu, go to .
In the Run/Debug Configurations dialog, click
and select Spring Boot.

Name | Specify a name for the run configuration to quickly identify it among others when editing or running. |
Run on | Select the target environment where you want to run the configuration. Besides running it locally, you can select to run your application on a remote machine via SSH or in a Docker container. For more information, refer to Run targets. |
Store as project file | Save the run configuration settings to a file that you can share with other team members. The default location is .idea/runConfigurations. However, if you do not want to share the .idea directory, you can save the configuration to any other directory within the project. By default, this option is disabled, and IntelliJ IDEA stores run configuration settings in .idea/workspace.xml. |
Required options
The following options are mandatory to run your Spring Boot application:
JRE | Specify the runtime environment that IntelliJ IDEA should use to run the application. By default, IntelliJ IDEA uses the latest available JDK from the module dependencies. |
Main class | Specify the fully qualified name of the class to be executed. |
Modify options
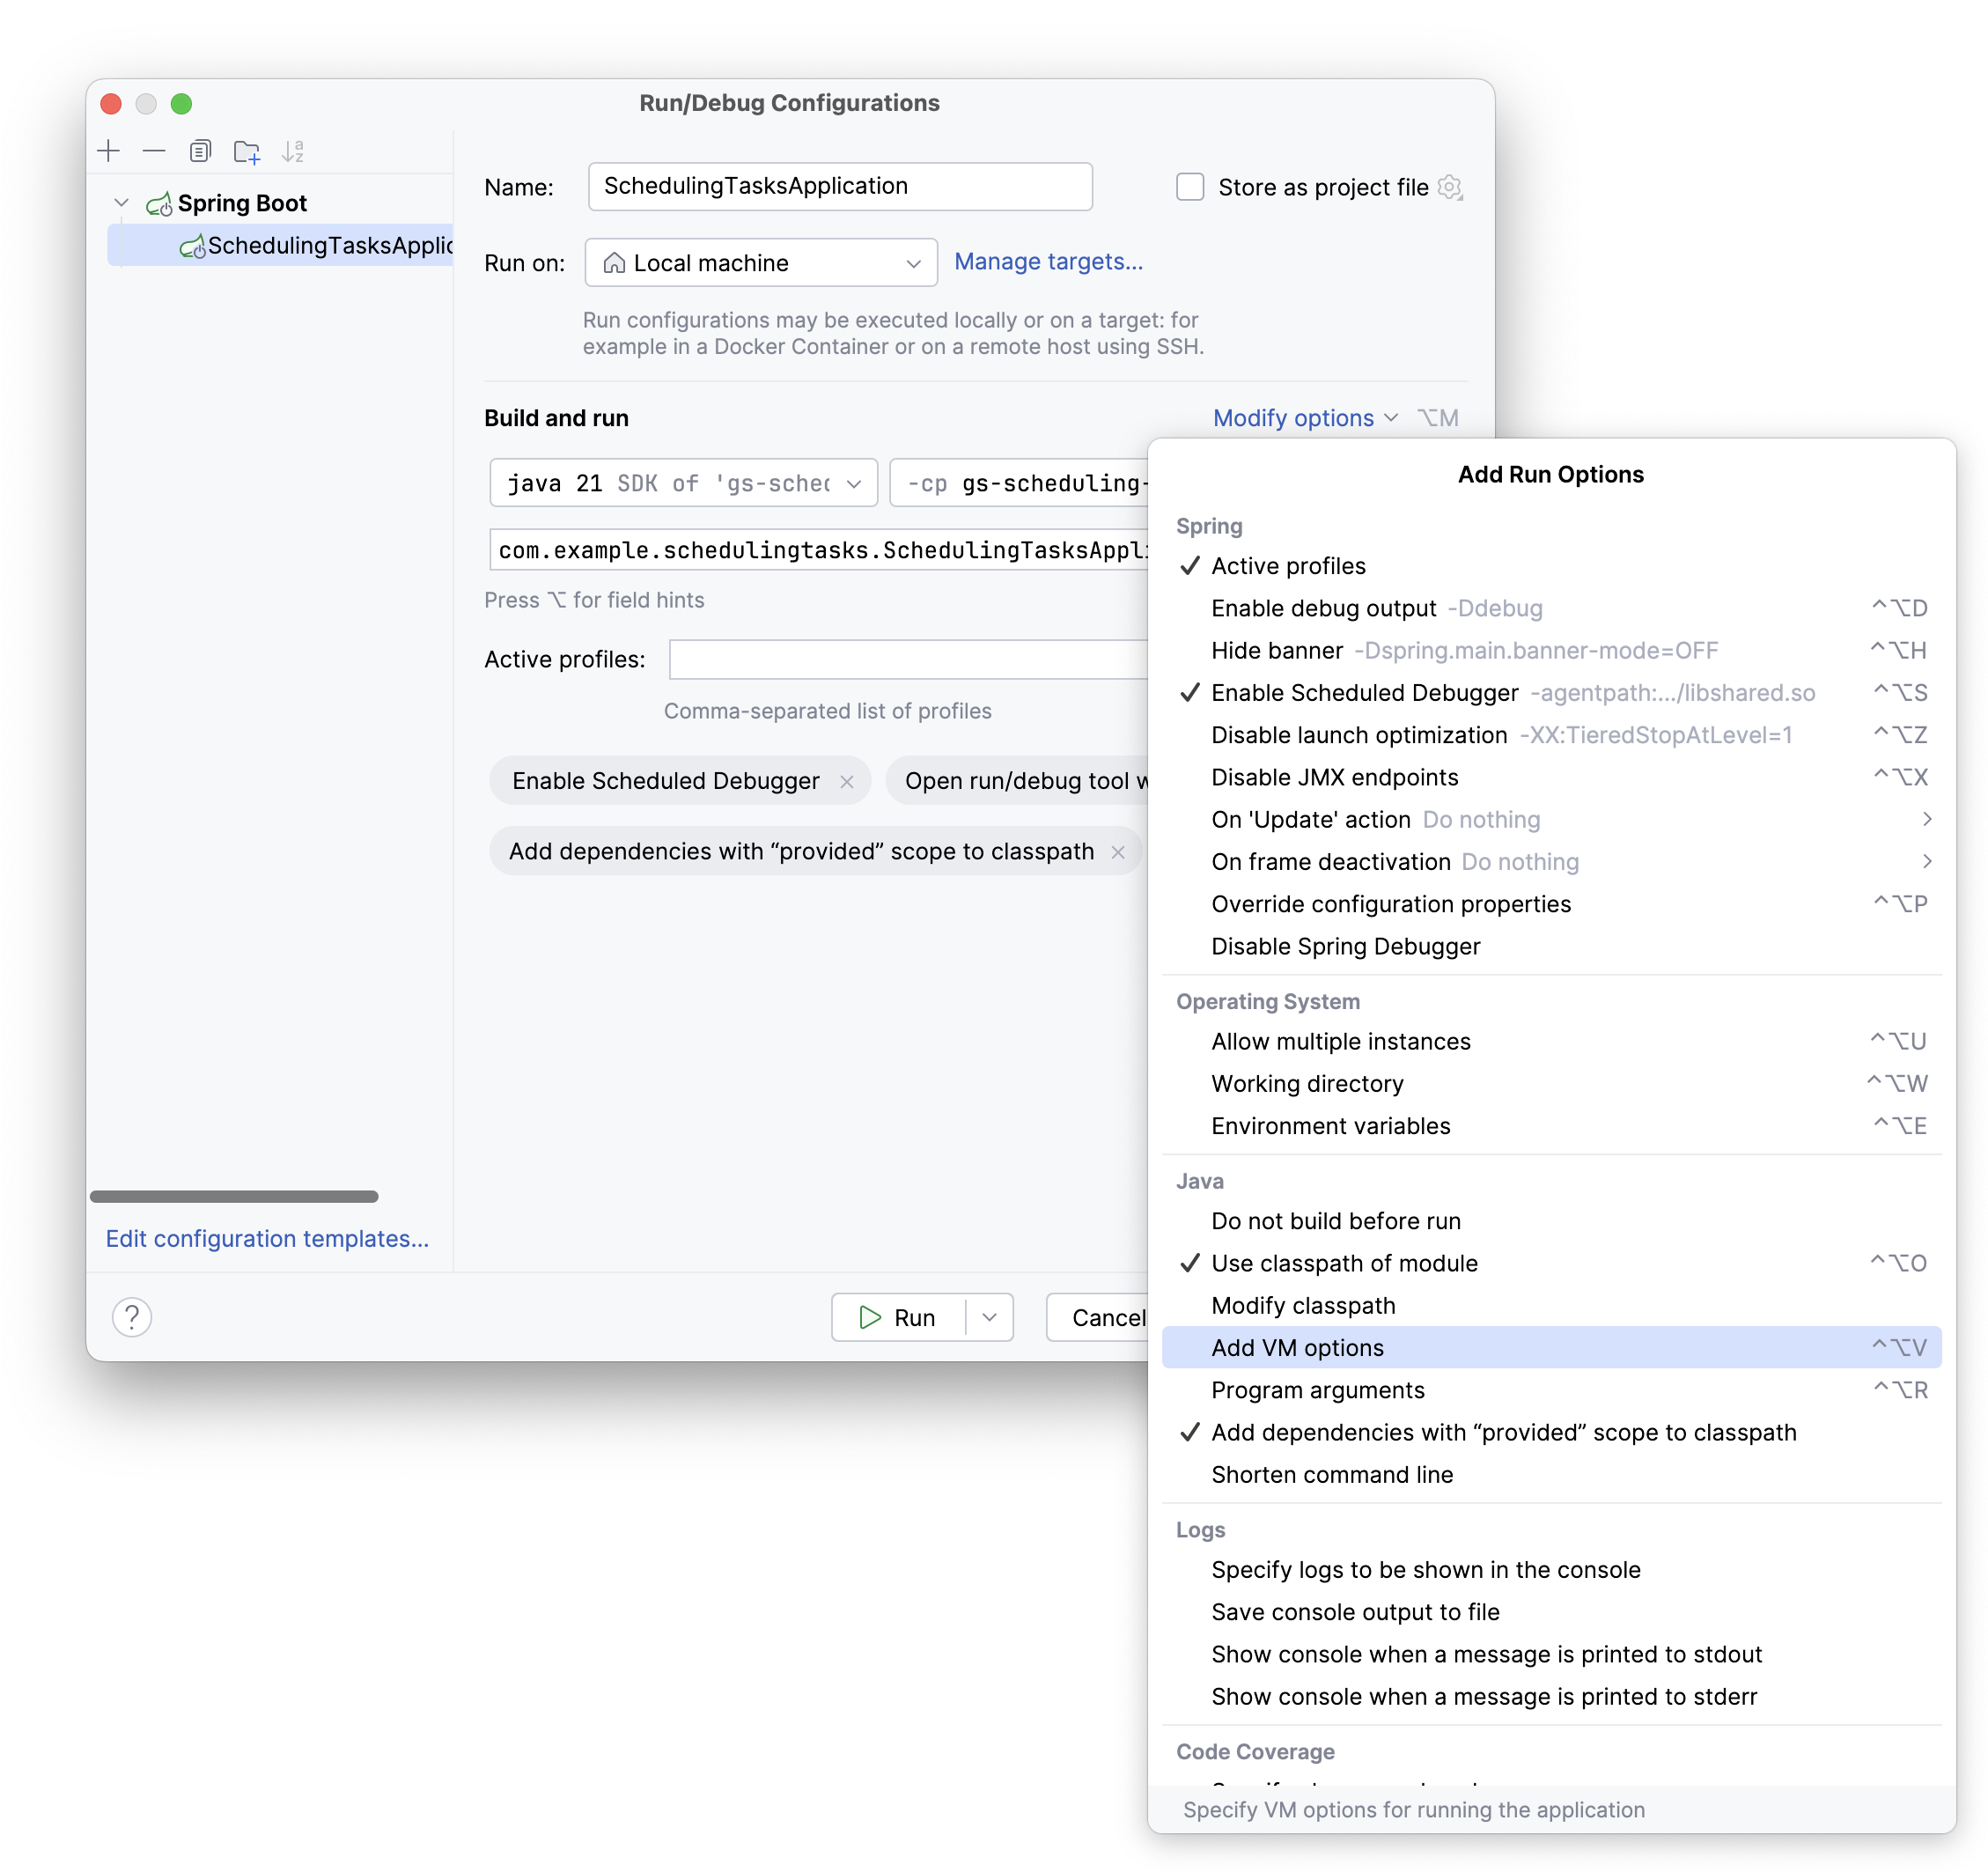
Click Modify options to select additional options for running the configuration.

Spring
The following options are specific to running Spring Boot applications:
Active profiles | Specify which Spring profiles should be active. This passes For more information, refer to Spring Boot: Profiles. |
Enable debug output | Enable logging of the debug output. This passes For more information, refer to Spring Boot: Logging. |
Hide banner | Disable the start-up banner entirely. This passes For more information, refer to Spring Boot: Customizing the banner. |
Disable launch optimization | Do not speed up the start-up time of your application. By default, this optimization is enabled by passing the following JVM options on the command line: |
Disable JMX endpoints | Disable the JMX agent that shows the application endpoints data in the Actuator tab of the Run tool window. By default, the JMX agent is enabled by passing the following JVM options on the command line:
This slows down the application startup. If you disable the JMX agent, the above options will not be added to the command line. For more information, refer to Spring: JMX |
On 'Update' action | Specify what to do when you modify the code and want to update the running application:
|
On frame deactivation: | Specify what to do when you switch from IntelliJ IDEA to another application (for example, a web browser):
|
Override configuration properties | Override any configuration property by passing it as a JVM option. For example, if you override the value of the |
Operating System
The following options are related to the operating system:
Allow multiple instances | Allow multiple instances of this run configuration to execute at the same time. By default, this option is disabled, which means that when you run the configuration, other active sessions of the configuration will terminate. |
Working directory | Specify the directory that will be used for all relative input and output paths. By default, IntelliJ IDEA uses the project root as the working directory. |
Environment variables | Specify the names and values of environment variables that are necessary when running this configuration. |
Java
The following options are specific to the Java compiler and runtime for your Spring application:
Do not build before run | Run the application straight away without launching the build process. |
Use classpath of module | Select the module whose classpath should be used to run the application. |
Modify classpath | If necessary, specify another classpath or select dependencies that you want to exclude from the classpath. This option is necessary in cases when the runtime classpath is different from the compile classpath (debug libraries, different locations, and so on). Use the |
VM options | Specify the options to be passed to the Java virtual machine when launching the application, for example, When specifying JVM options, follow these rules:
-Xmx1024m -Dspaces="some arg" -Dmy.prop=\"quoted_value\" -Dfoo=${MY_ENV_VAR}
Use code completion in this field: start typing the name of a flag, and the IDE suggests a list of available command line options. This works for The |
Program arguments | Pass command-line arguments to your application. |
Add dependencies with “provided” scope to classpath | Add the dependencies with the This option is enabled by default in Spring Boot run configurations. |
Shorten command line | Select a method that will be used to shorten the command line if the classpath gets too long, or you have many VM arguments that exceed your OS command line length limitation. The choice of option depends on the class loader implementation. Note that some frameworks do not support JAR manifest, while other frameworks with custom class loaders will not work well with the classpath.file option.
|
Logs
The following options are related to logging the execution of this configuration. For more information, refer to Logs.
Item | Description |
|---|---|
Specify logs to be shown in the console | Specify which log files to display while running the application. Click
For logs in the table, you can configure the following options:
|
Save console output to file | Save the console output to the specified location. Type the path manually or click the browse button and point to the desired location in the dialog that opens. |
Show console when a message is printed to stdout | Activate the console when the application writes to the standard output stream. |
Show console when a message is printed to stderr | Activate the console when the application writes to the standard error stream. |
Code Coverage
The following options are related to code coverage. For more information, refer to Code coverage.
Item | Description |
|---|---|
Specify classes and packages | In this table, specify classes and packages to be measured. Click |
Exclude classes and packages | Specify classes and packages that you want to exclude from coverage. Click |
Before Launch
In this area, you can specify tasks to be performed before starting the selected run/debug configuration. The tasks are performed in the order they appear in the list.
Item | Description |
|---|---|
Add before launch task | Enable this option to add one of the following available tasks:
|
Open run/debug tool window when started | Depending on the type of configuration, open the Run, Debug, or Services tool window when you start this run configuration. If this option is disabled, you can open the tool window manually:
|
Focus run/debug tool window when started | Focus on the run configuration tool window when the tests are running. |
Show the run/debug configuration settings before start | Show the run configuration settings before actually starting it. |