UML class diagrams
Enable the Diagrams plugin
This functionality relies on the Diagrams plugin, which is bundled and enabled in IntelliJ IDEA by default. If the relevant features are not available, make sure that you did not disable the plugin.
Press Ctrl+Alt+S to open settings and then select .
Open the Installed tab, find the Diagrams plugin, and select the checkbox next to the plugin name.
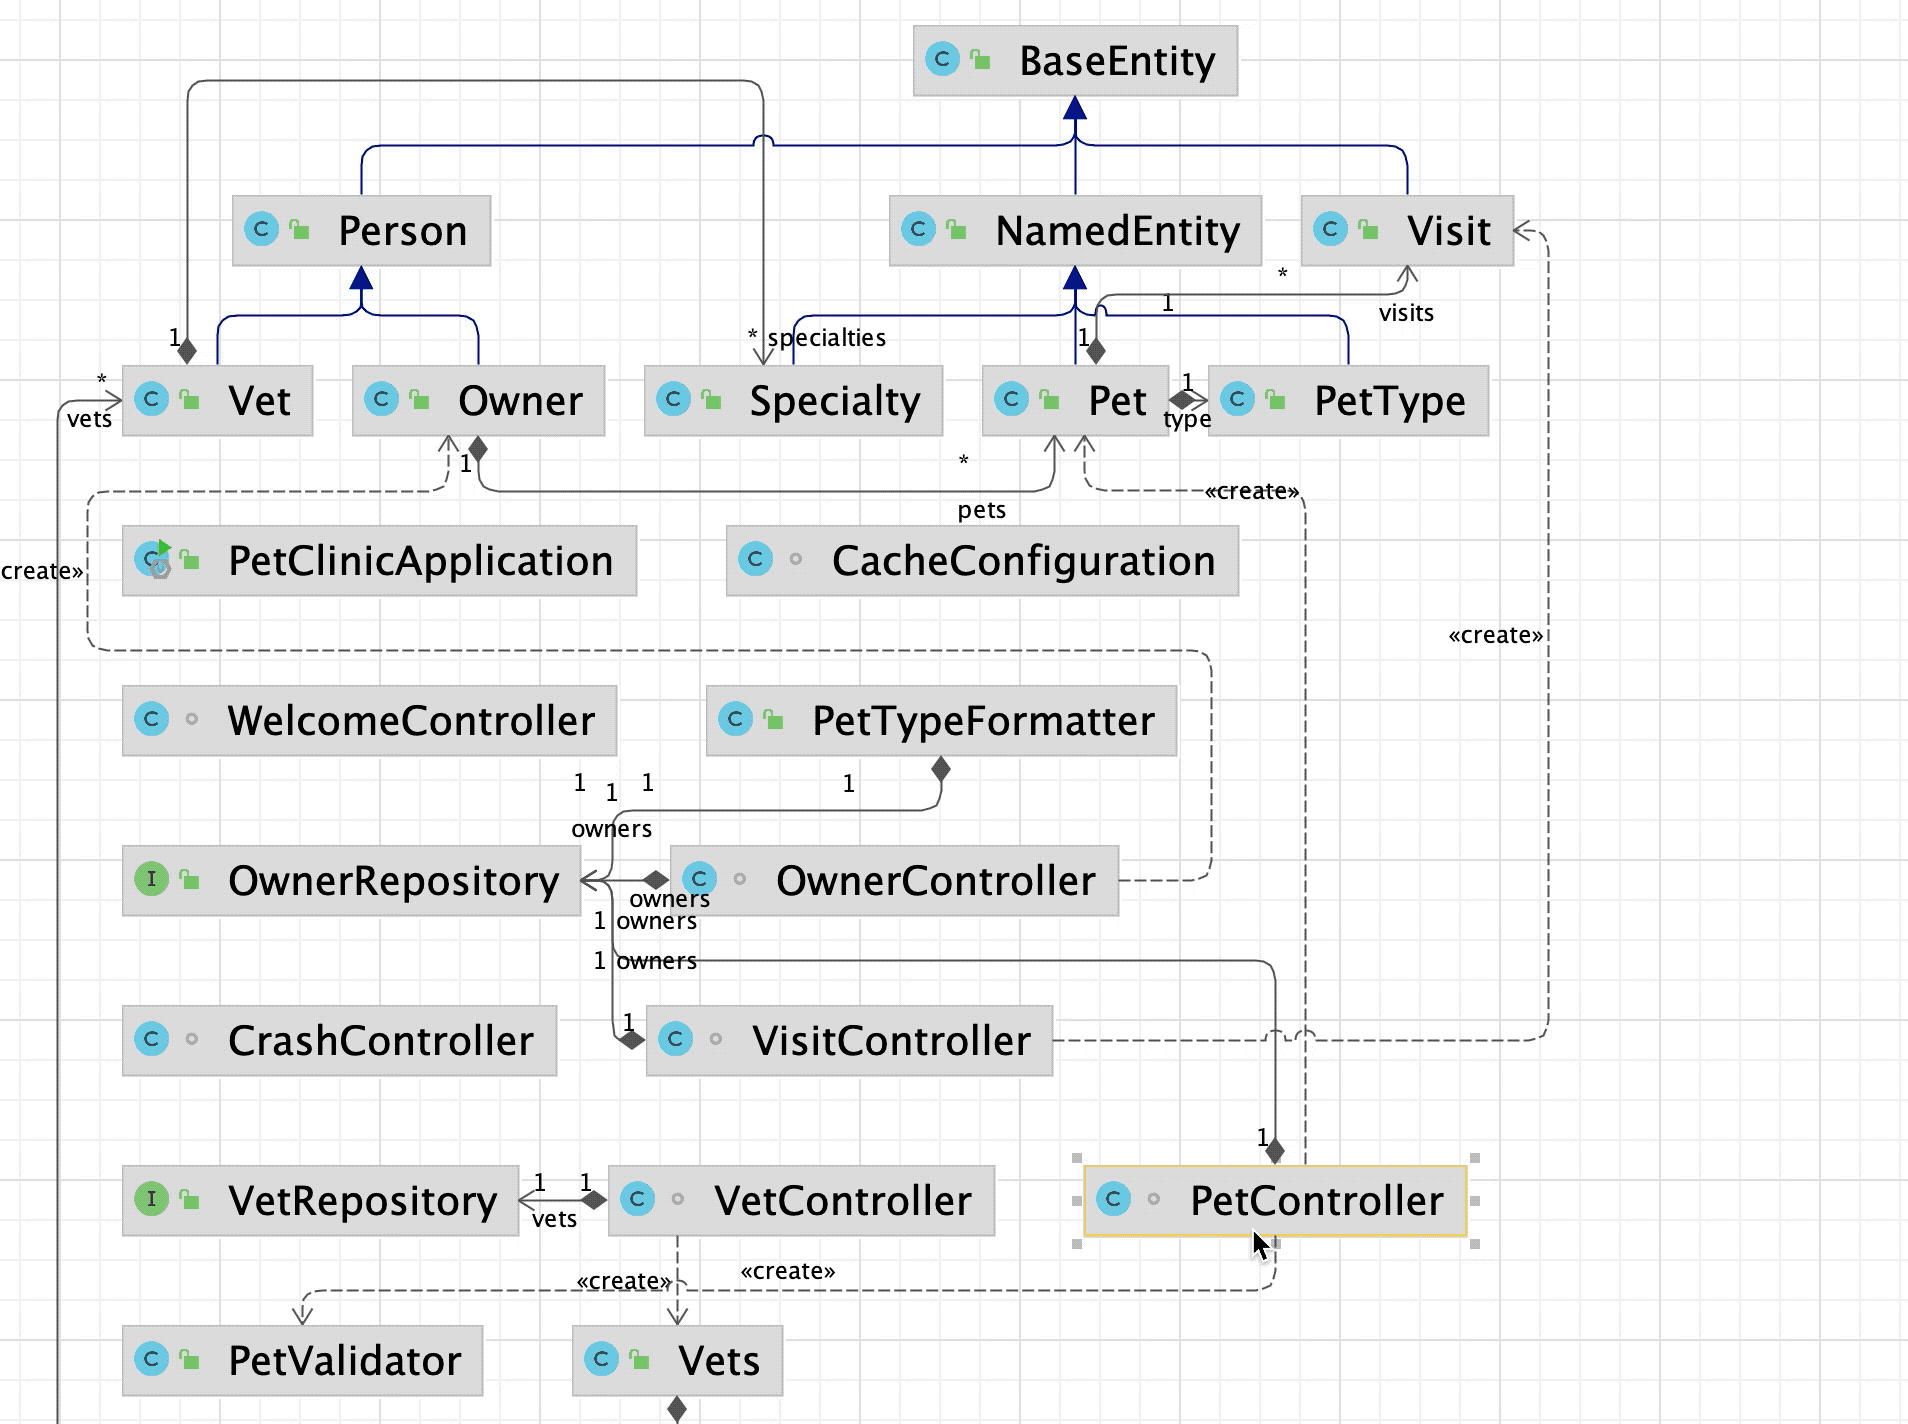
IntelliJ IDEA lets you generate a diagram on a package in your project. Such diagrams always reflect the structure of actual classes and methods in your application.
View diagram on a package
In the Project tool window, right-click a package for which you want to create a diagram and select Ctrl+Alt+Shift+U).
In the list that opens, select Java Class Diagram. IntelliJ IDEA generates a UML diagram for classes and their dependencies.
Analyze class diagram
To see the list of methods, fields, and other code elements, select the appropriate icon on the diagram toolbar located on top of the diagram editor.

The lists are displayed based on the selected visibility level, which you can change. For example, to view protected methods, click ![]() on the diagram toolbar and select protected from the list. IntelliJ IDEA displays members with visibility not less than protected, such as public, package local, and protected ones. The protected methods are displayed with modifier icons
on the diagram toolbar and select protected from the list. IntelliJ IDEA displays members with visibility not less than protected, such as public, package local, and protected ones. The protected methods are displayed with modifier icons ![]() next to them.
next to them.

You can click the ![]() icon to see class dependencies. IntelliJ IDEA follows the UML conventions in showing relationships between the classes.
icon to see class dependencies. IntelliJ IDEA follows the UML conventions in showing relationships between the classes.

When you click through classes in the graph, IntelliJ IDEA greys out classes that do not reside in the same package. This might be helpful, when you generate a diagram on a package that contains inner packages.

To save the diagram as a file, right-click the diagram editor and from the context menu, select and then the file extension in which you want to save the diagram.
Manage class diagram
When working with diagrams, use the context menu in the diagram editor to perform different tasks. You can view members of the class, add new, delete the existing ones, see implementations, check parent classes, perform basic refactoring, add notes, and so on.
View the diagram structure
Generate a diagram.
Click Structure in the left toolbar. IntelliJ IDEA opens the Structure tool window that displays a map of your diagram with a small preview of the selected block and its neighbors.

Use the context menu to zoom in and out, move canvas, change layout, and export part of the diagram into an image.

Add an existing class to a diagram
Press Space.
In the search field that opens, start typing a name of the class you want to add. Then, select the desired class from the suggestion list.
If you want to add a class that is out of the project scope, select the Include non-project items checkbox.
Alternatively, select one or more elements in the Project tool window and drag them to the diagram.
Delete a node element from the diagram
In the diagram editor, select a node element you want to delete.
Right-click the element and from the context menu, select Delete Delete.
Alternatively, select Alt+Delete. In this case, IntelliJ IDEA checks for usages before applying the changes.
Add new members to a class
You can perform some forward engineering while in the diagram editor.
In the diagram editor, right-click anywhere and from the context menu, select . Then select a code element you want to create.
Depending on your selection, IntelliJ IDEA opens the appropriate dialog where you specify the necessary information for creating the new element.
IntelliJ IDEA adds the item to your diagram as well as to your project tree .
View implementations and parent classes
You can view implementations and parent classes in your diagram. If IntelliJ IDEA finds more than one parent class or implementation, it displays a list of appropriate items. Select the one you need to see the connections between the parent and its children.
In the diagram editor, select an item for which you want to see implementations or parent classes.
Right-click the items and from the context menu, select the Show Implementations Ctrl+Alt+B or Show Parents Ctrl+Alt+P respectively.
In the popup that opens, select items you need and press Enter. To extend your selection up or down while in the popup, press Shift+Up or Shift+Down respectively.
Configure diagram settings
You can configure the diagram settings so that you have certain options available by default when you create a diagram.
Press Ctrl+Alt+S to open settings and then select .
In the right-hand pane, select the options that you want to see by default and click OK to apply your changes.
Analyze graph
The Analyze Graph action group lets you analyze the graph in various ways such as perform auto clusterization, measure the node centrality, search cycles, filter path between two nodes, and so on.
Filter paths between two nodes
Most of the time, generated diagrams are big and complicated. Typically, you want to concentrate only on the specific part of the diagram. IntelliJ IDEA lets you filter paths between two diagram elements.
In the diagram editor, select two nodes on which you want to focus and right-click one of them to open the context menu.
From the context menu, select .
In the dialog that opens, select additional options if needed and click Find.

IntelliJ IDEA displays connections associated only with the selected nodes.
Measure diagram centrality
You can use this action to identify the important nodes in the graph.
In the diagram editor, right-click anywhere in the editor to open the context menu.
From the context menu, select .
In the dialog that opens, select additional options if needed and click Measure.

The node "importance" is expressed via fractional value from 0.0 to 1.0 measurement, and the brightest node selection should be explored first.
