Run tests
There are several ways to run tests, including from a file or folder, using the Run widget, and from the Structure tool window. This article covers running tests in general. If you are looking for information for a specific build tool, see:
Run tests directly in a file or folder
If your tests do not require any specific actions before start, and you do not want to configure additional options, such as code coverage, you can run them by using the following options:
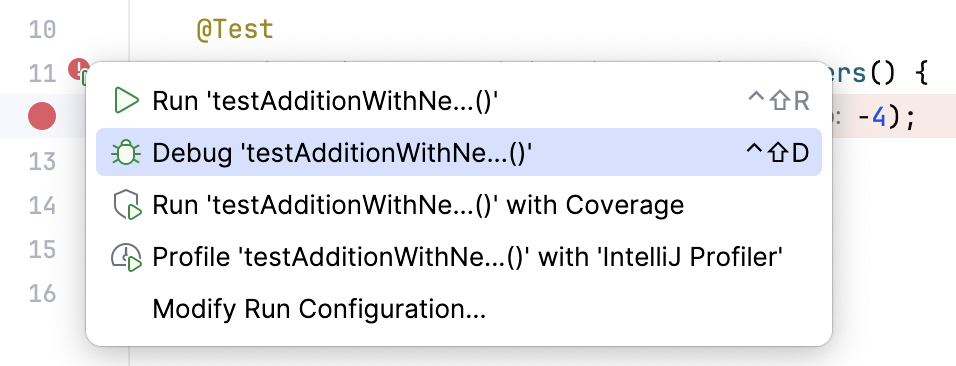
Place the caret at the test class to run all tests in that class, or at the test method, and press Ctrl+Shift+F10. Alternatively, click the
gutter icon next to the test class or test method and select Run '<test name>' from the list.
The gutter icon changes depending on the state of your test:
The
gutter icon marks a set of tests.
The
gutter icon marks new tests.
The
gutter icon marks successful tests.
The
gutter icon marks failed tests.

To run all tests in a folder, select this folder in the Project tool window and press Ctrl+Shift+F10 or select Run Tests in 'folder' from the context menu.
Run tests using the Run widget
When you run a test, IntelliJ IDEA creates a temporary run configuration. You can save temporary run configurations, change their settings, share them with other members of your team. For more information, refer to Run/debug configurations.
Create a new run configuration or save a temporary one.
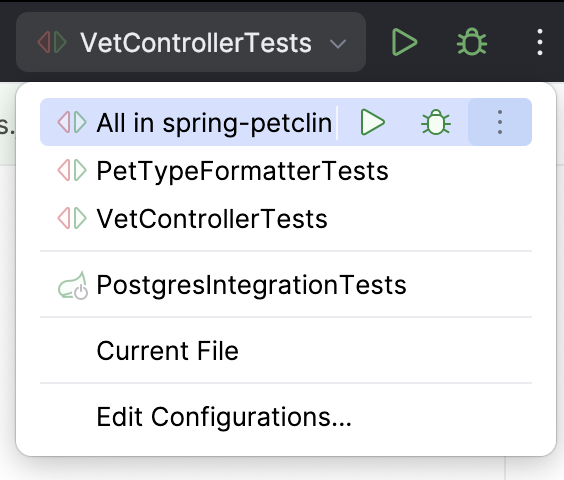
Use the Run widget on the main toolbar to select the configuration you want to run.
Click
or press Shift+F10.
Run tests from Structure
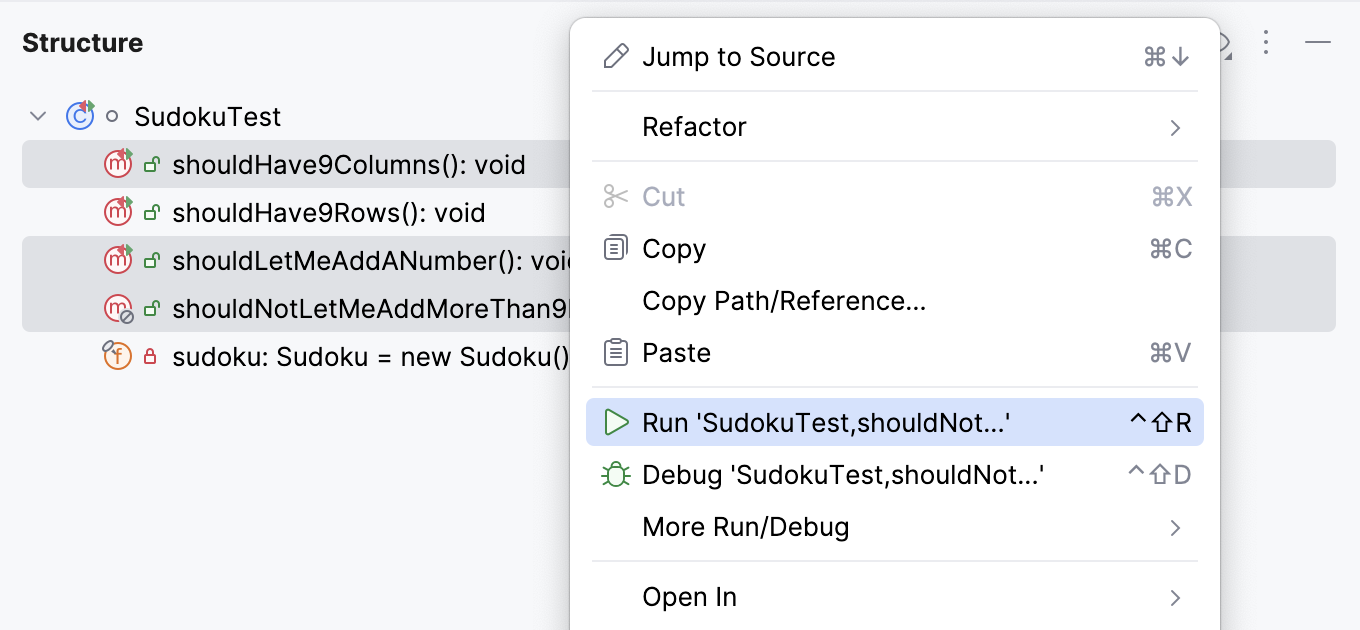
In the Structure tool window, you can select one or several test methods in a class to run. In this case, the IDE also creates a temporary run configuration with these methods that you can save and edit.
In the Structure tool window, right-click one or several test methods and select
Run 'method name' (Ctrl+Shift+F10).
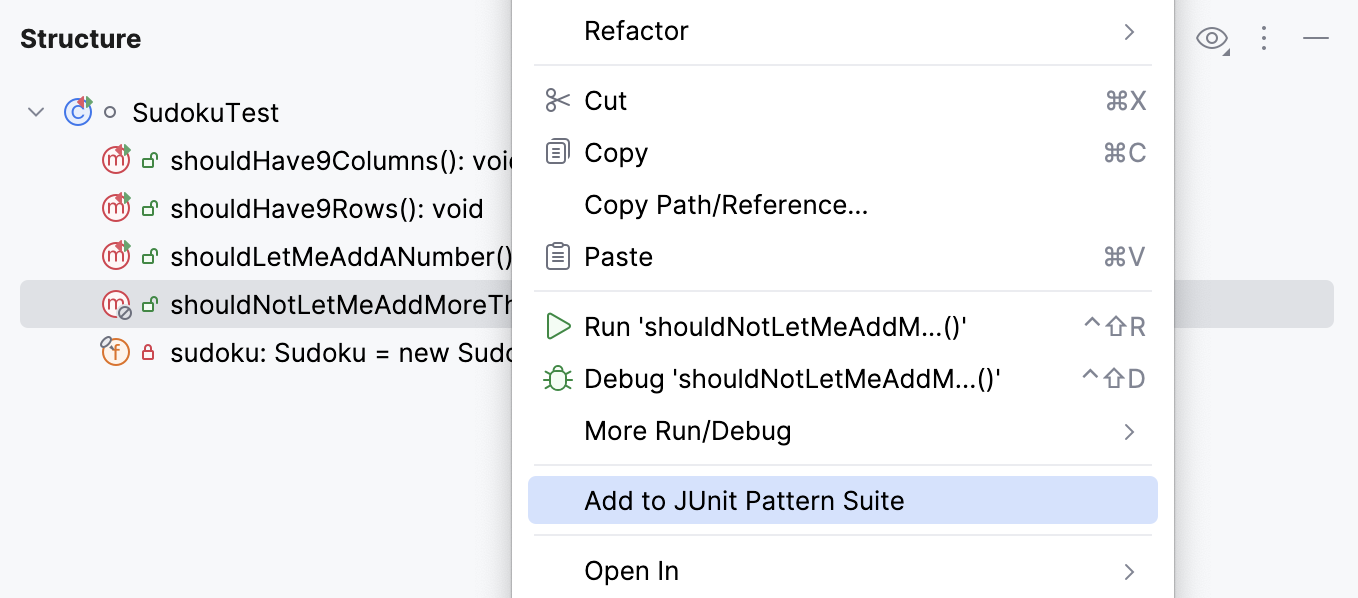
The tool window allows you to add test methods to an existing run configuration (for JUnit and TestNG tests) in which the test scope is specified by means of a pattern. You can add methods from several different classes creating a test suite.
Right-click a method in the Structure tool window and select:
Add to temp suite: <Configuration_name> if there is only one configuration with the Pattern test scope.
Add to JUnit Pattern Suite (JUnit) / Add to Temp Suite (TestNG) if there are several configurations with the Pattern test scope. In this case, a popup appears in which you can select the target configuration.
After IntelliJ IDEA finishes running your tests, it shows the results in the Run tool window on the tab for that run configuration. For more information about analyzing test results, refer to Explore test results.
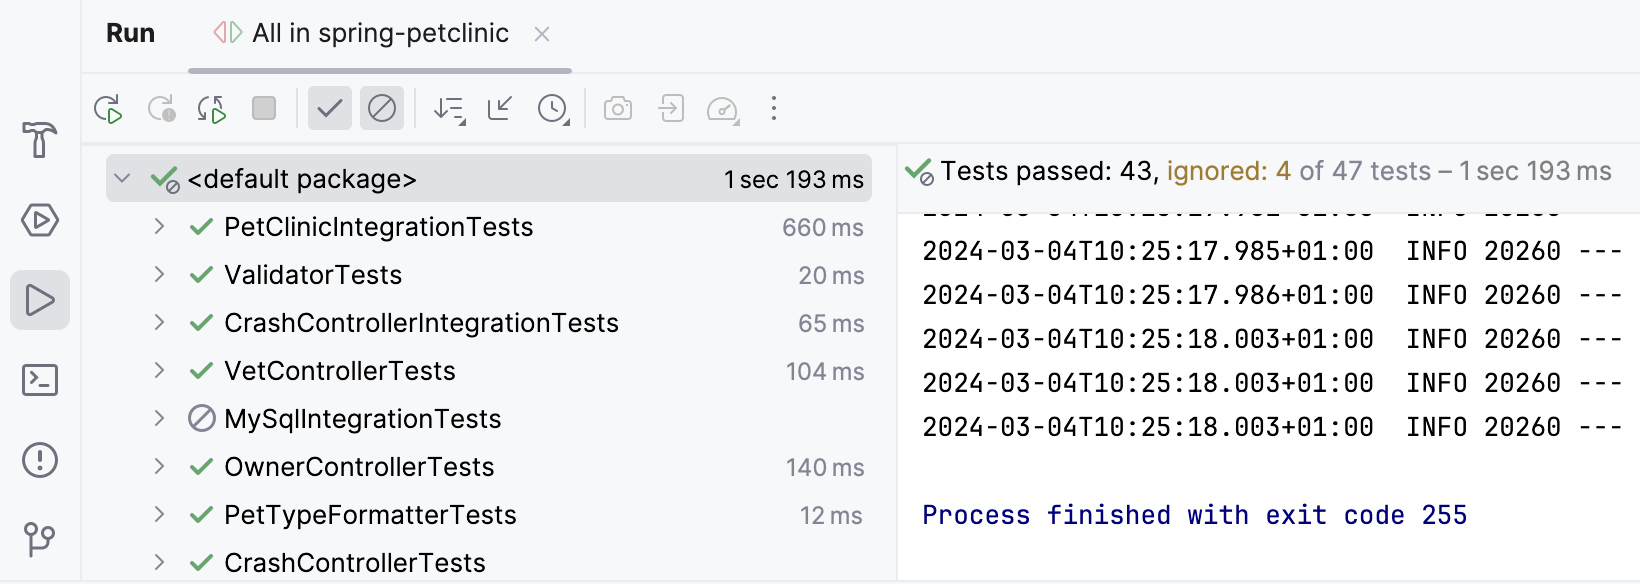
The console on the right shows the output of the current test session. The test results toolbar located above the list of test results provides you with several helpful options.

Run tests after commit
When you want to check that your changes would not break the code before pushing them, you can do that by running tests as commit checks.
Set up test configuration
Press Alt+0 to open the Commit tool window and click Show Commit Options
.
Under the Advanced Commit Checks menu, next to the Run Configuration option, click Choose configuration and select which configuration you want to run. This can be a test configuration provided by your build tool, for example,
gradle testor a single test class from the project.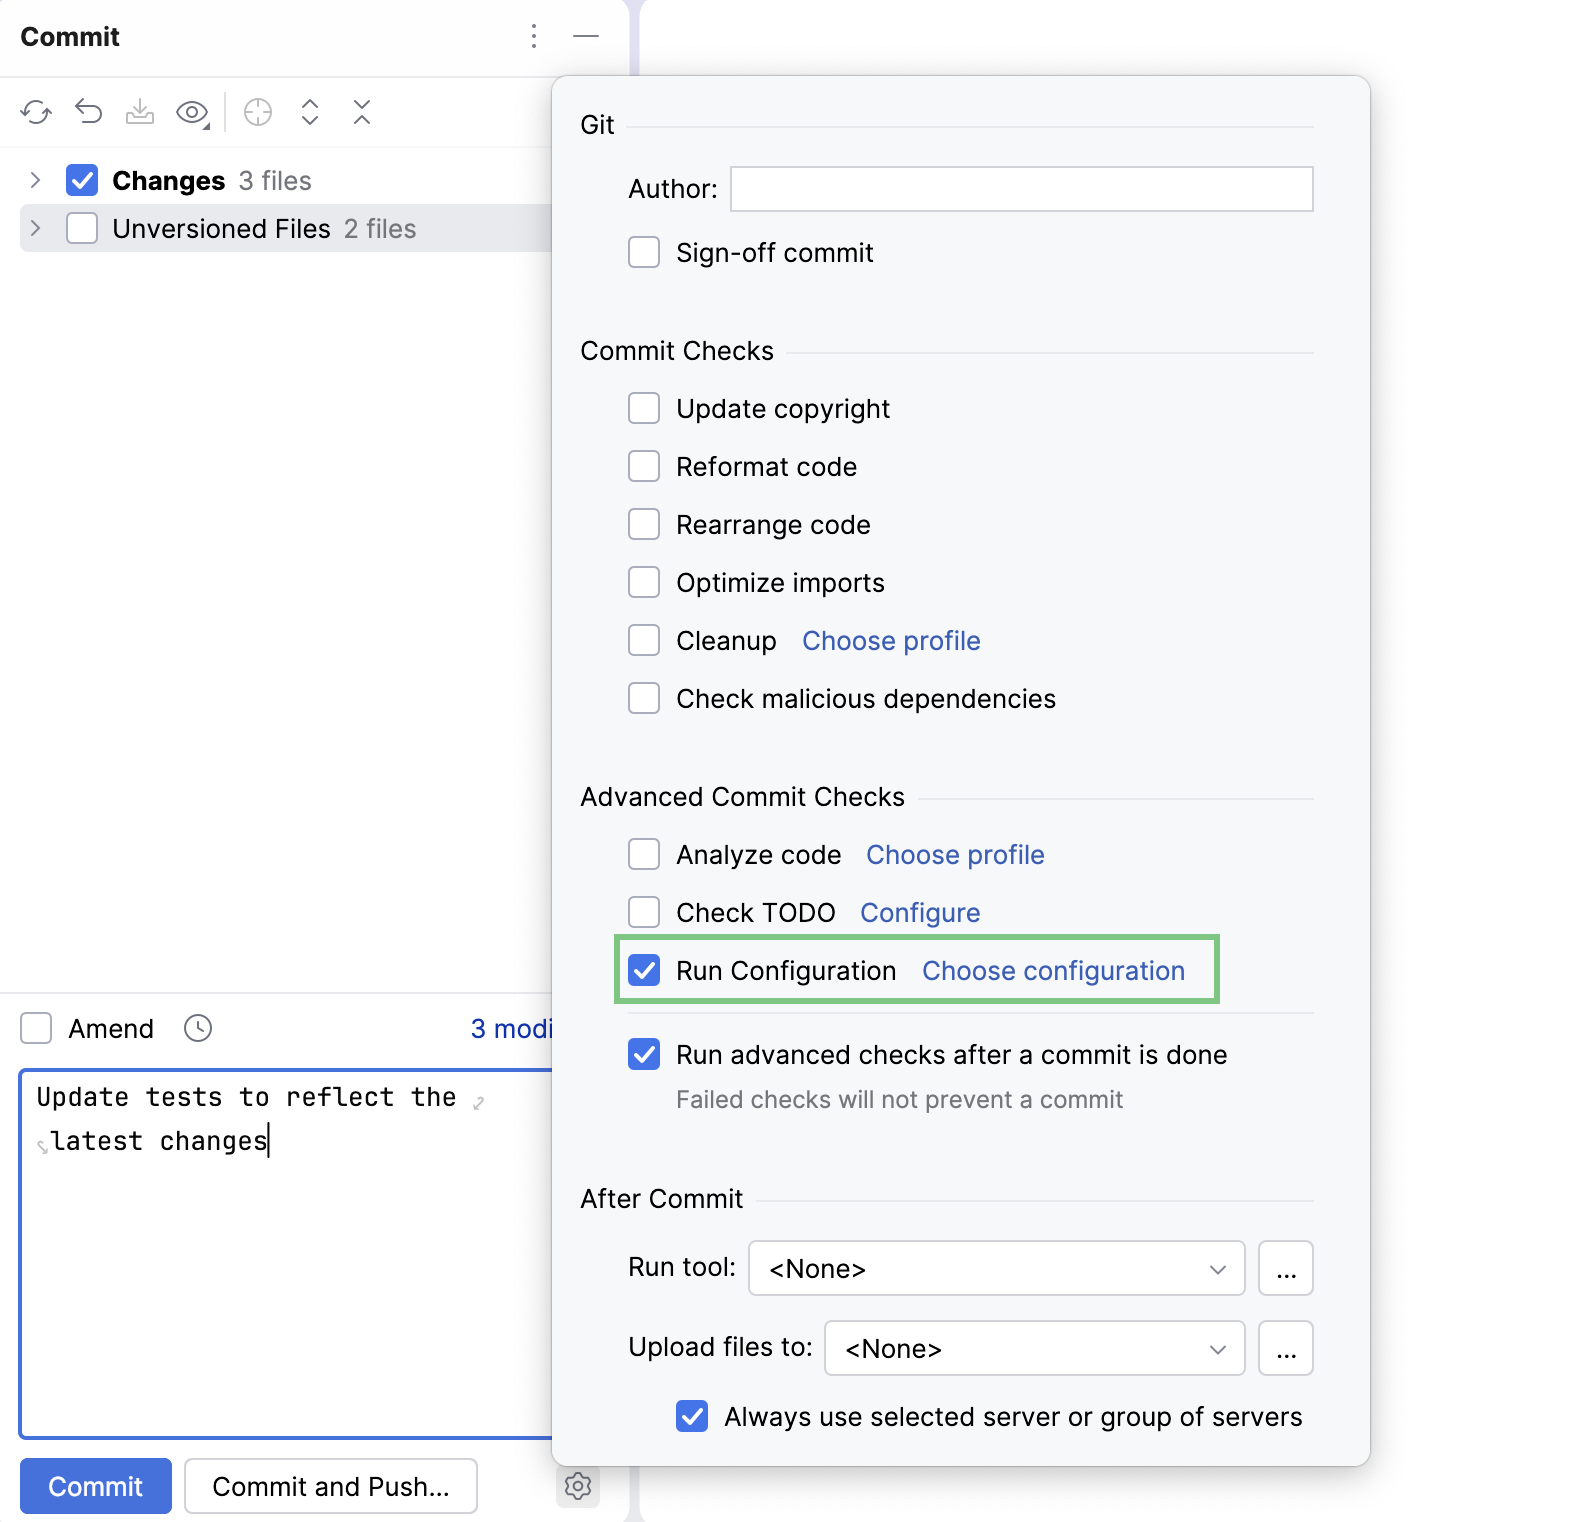
After you have set up the test configuration, the specified tests will run every time you make a commit.
Stop tests
Use the following options on the test results toolbar of the tab for the run configuration:
Click
or press Ctrl+F2 to terminate the process immediately.

Click
to terminate the process gracefully, allowing shutdown hooks to run.

Rerun tests
Rerun a single test
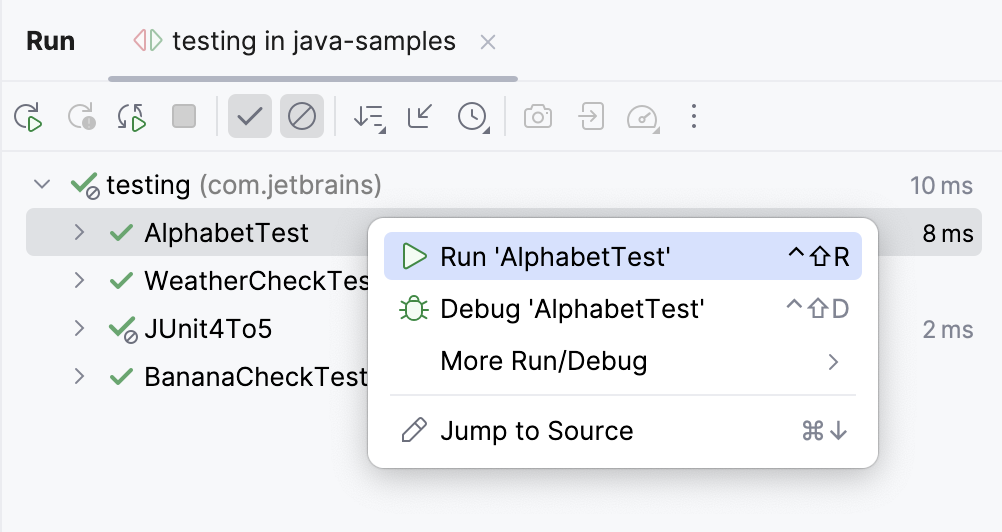
Right-click a test on the tab for the run configuration in the Run tool window and select Run 'test name'.
Rerun all tests in a session
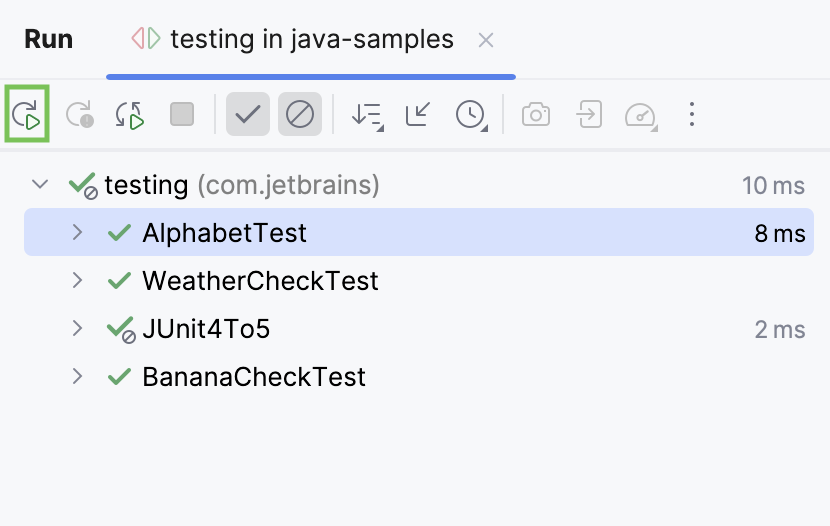
Click
on the test results toolbar or press Ctrl+F5 to rerun all tests in a session.
Rerun failed tests
Click
on the test results toolbar to rerun only failed tests.
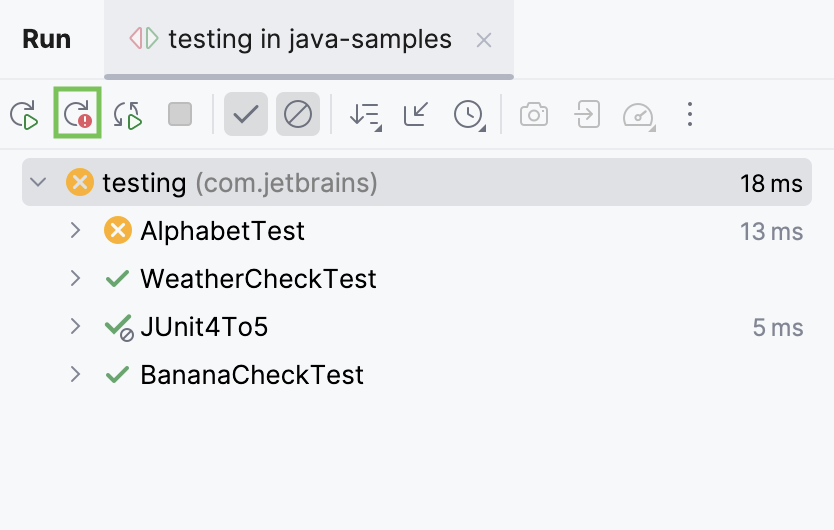
Hold Shift and click
to choose whether you want to Run the failed tests again or Debug them.
You can configure the IDE to trigger tests that were ignored or not started during the previous test run together with failed tests. Click
on the test results toolbar and enable the Include Non-Started Tests into Rerun Failed option.
Rerun tests automatically
In IntelliJ IDEA, you can enable the autotest-like runner: any test in the current run configuration restarts automatically after you change the related source code.
Click
Rerun Automatically on the test results toolbar to enable the autotest-like runner.
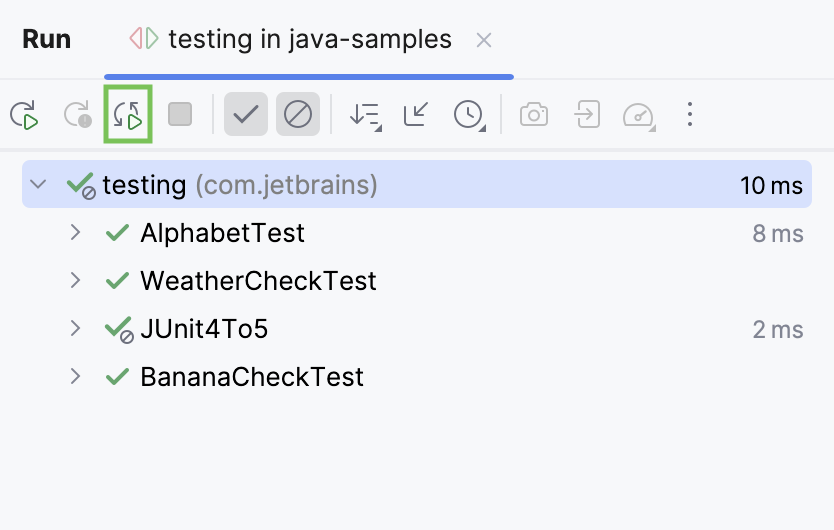
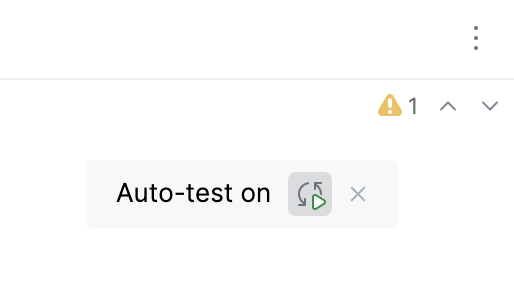
Additionally, you can enable the auto-test popup in the editor. It indicates that the autotest-like runner is on. Click the
More icon on the toolbar and enable Show Auto-Test Status in the Editor.
The Auto-test on
popup shows up in the editor if the autotest-like runner is enabled. Click
in the popup to disable the automatic rerunning of tests.
Debug failed tests
If you do not know why a test fails, you can debug it.
In the editor, click the gutter on the line where you want to set a breakpoint.
There are different types of breakpoints that you can use depending on where you want to suspend the program. For more information, refer to Breakpoints.
Right-click the
gutter icon next to the failed test and select Debug 'test name'.
The test will rerun in debug mode. After that, the test will be suspended, allowing you to examine its current state.
You can step through the test to analyze its execution in detail.
