Project analysis
Project analysis allows IntelliJ IDEA to enable smart IDE features: code completion, inspections, refactoring, navigation, finding usages, and syntax highlighting.
IntelliJ IDEA triggers this process after you open or clone a new project, enable or disable plugins, and switch between branches. It is also triggered after large external file updates (for example, if multiple files are created or generated when you build your project).
![]()
During the analysis, IntelliJ IDEA examines the code in your project to create a virtual map of classes, methods, objects, and other code elements that make up your application. It also analyzes project dependencies, including JDKs, libraries, and files that may be added to the project by different plugins. The result of this process is the project files index, which allows the IDE to provide instantaneous smart features such as coding assistance, search, navigation, and so on.
While the analysis is in progress, smart IDE features might be unavailable or partially available. However, this does not prevent you from using IntelliJ IDEA: you can still type code, work with VCS features, configure settings, and perform other code-unrelated actions.
Tracking the project analysis progress
While project analysis is running, you can track its progress in the status bar, which is located at the bottom of IntelliJ IDEA.
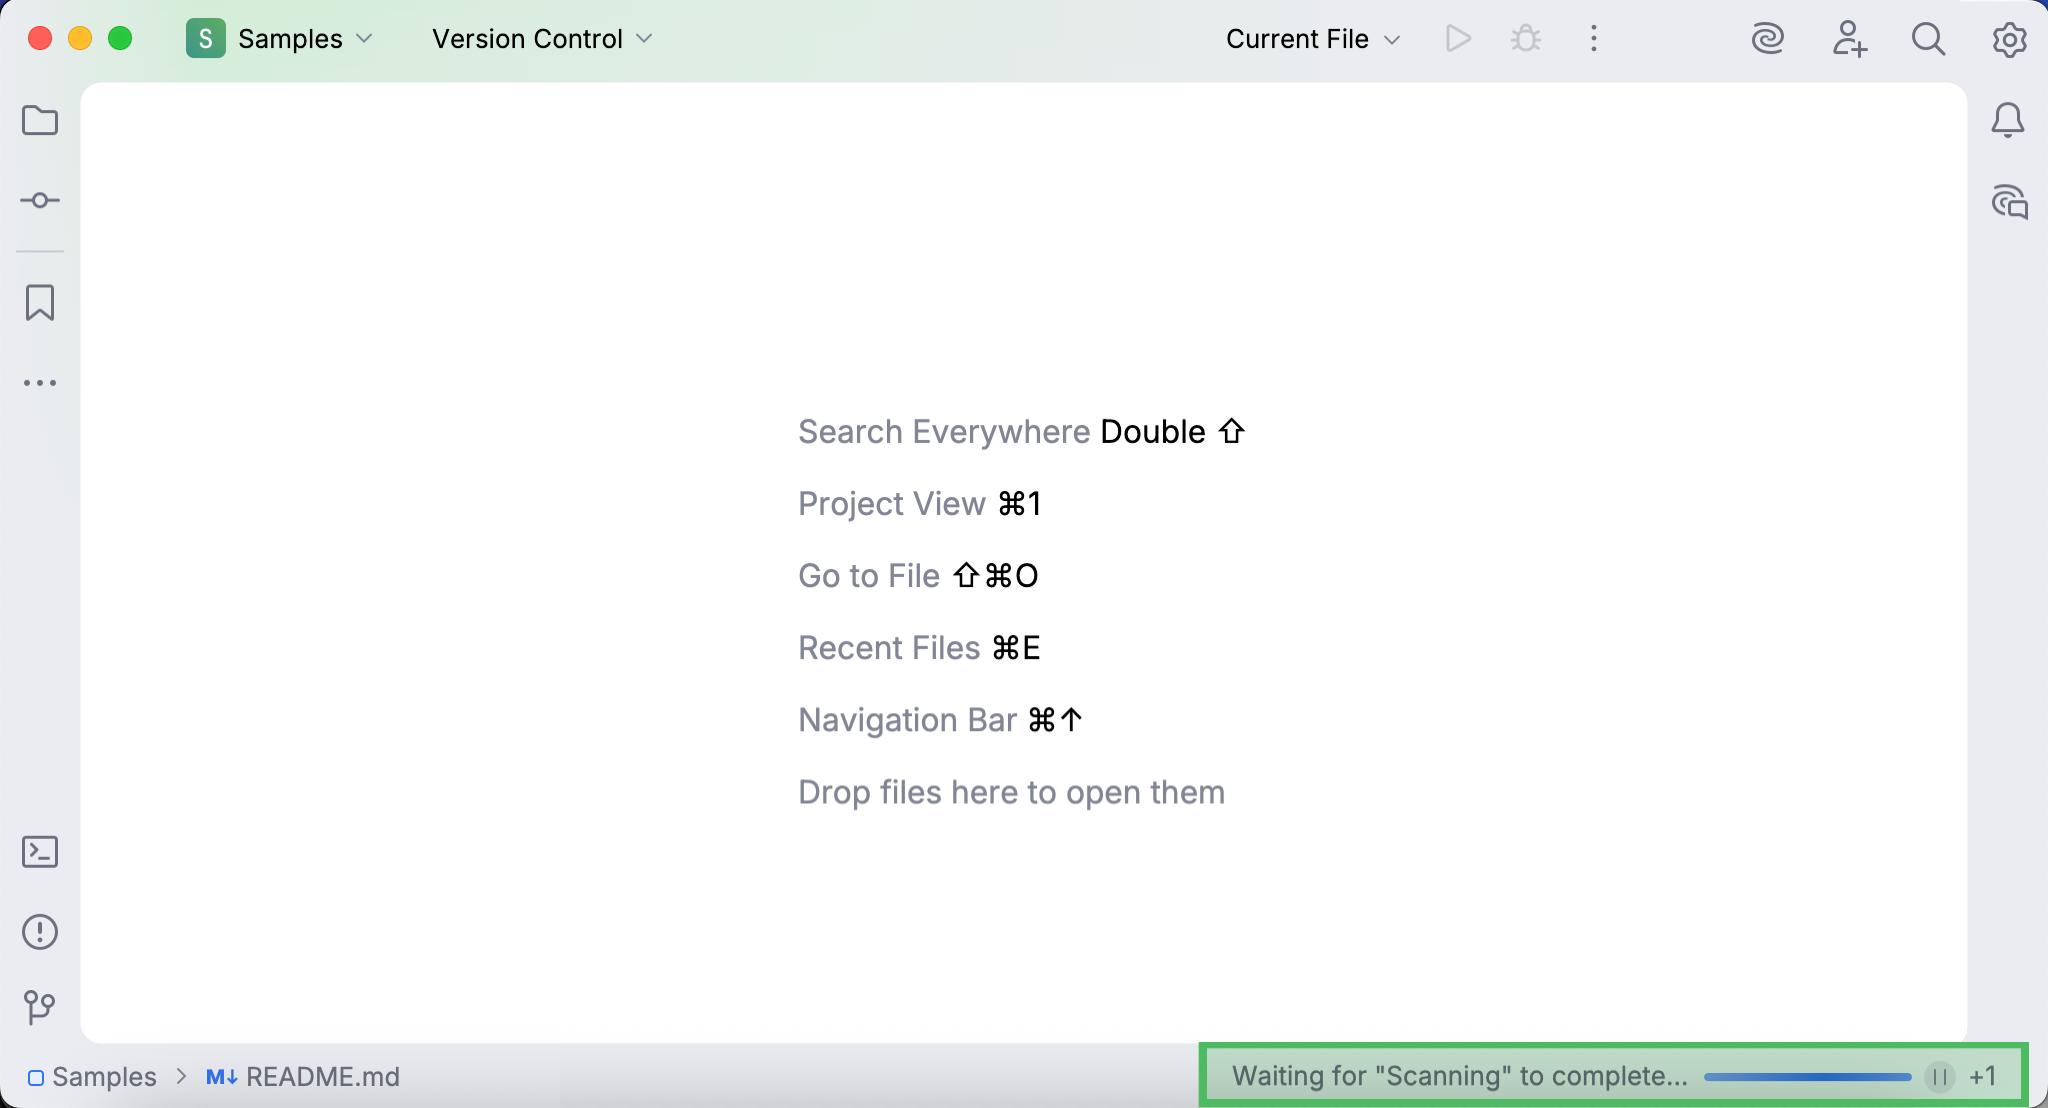
If you click the status bar, the Processes dialog opens, where you can find processes that are currently in progress or in queue.
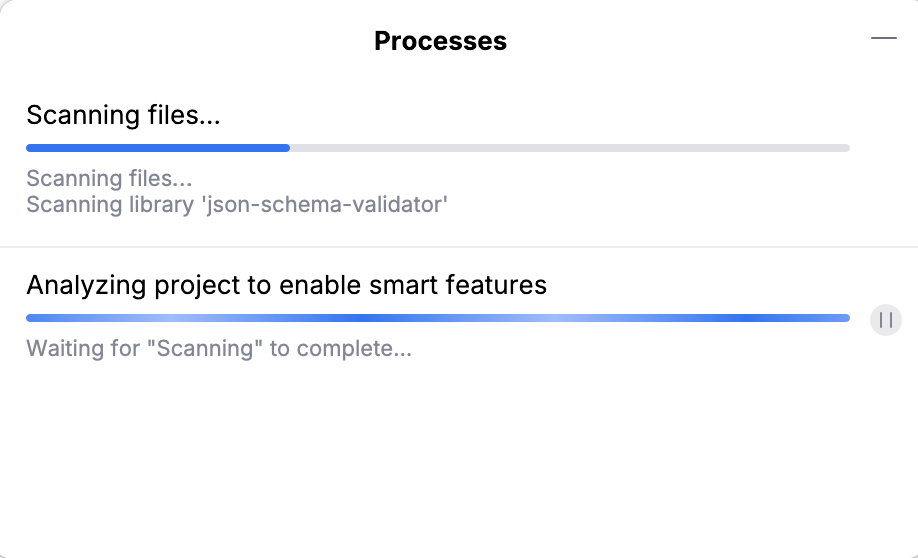
The main processes of project analysis include:
Scanning files: checking which files should be analyzed. This process cannot be paused or canceled.
Analyzing project to enable smart features: examining and indexing the file contents. This process can be paused (and resumed), but not canceled.
You can check the state of each process below its progress bar. When all processes of project analysis are completed, IntelliJ IDEA clears the status bar. This indicates that smart IDE features (such as coding assistance and finding usages) are ready to use.
Reducing the project analysis time
The amount of time it takes to analyze your project depends on its size: the more complex your project is, the more files it contains, and the more time the IDE needs to analyze it.
You can speed up project analysis in several ways:
Exclude files and folders so that the IDE skips them when analyzing the project.
Unload modules to reduce the number of analyzed files.
Use shared indexes to analyze the project once and then reuse the project files index on other computers.
Exclude files and folders from project analysis
You can mark dynamically generated files and folders as excluded to speed up project analysis and improve the overall IDE performance. For example, it's recommended that you exclude compilation output folders. Excluded files and folders are not indexed during project analysis (therefore, smart IDE features are not available for them), but they remain part of the project.
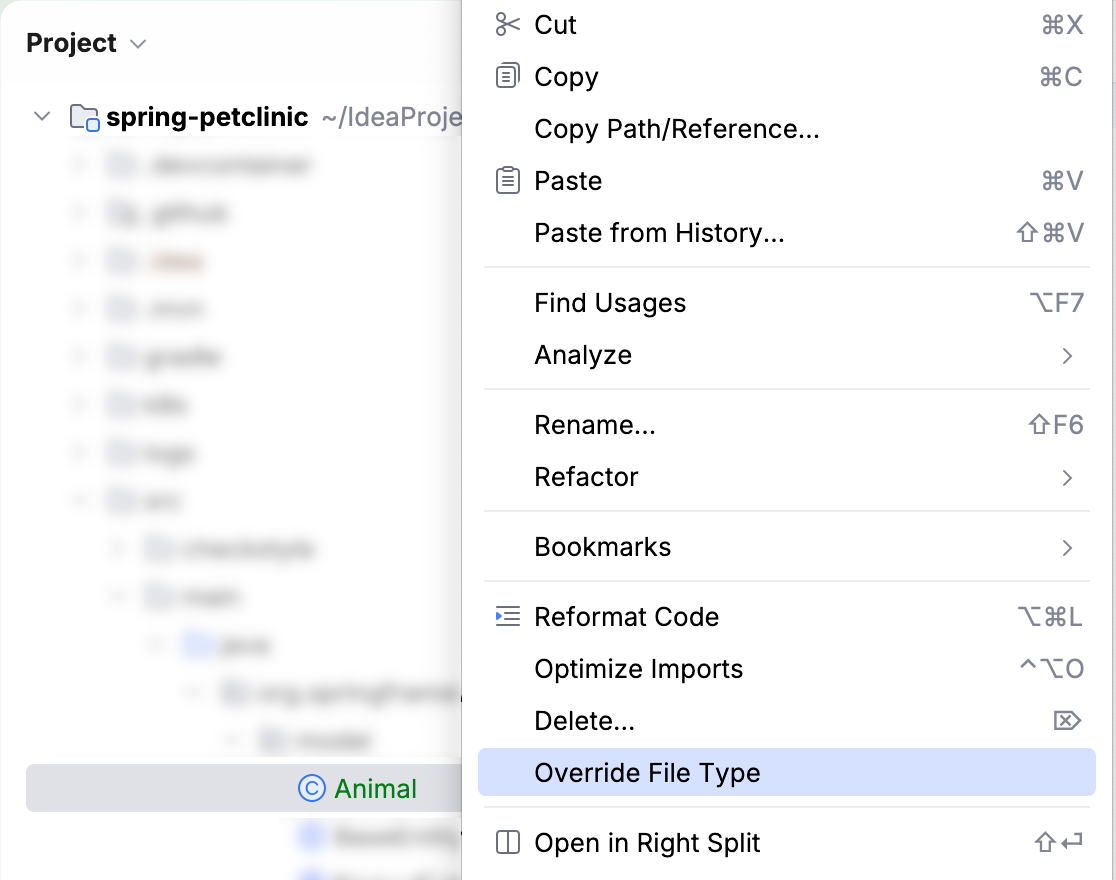
Exclude files from project analysis
Go to the Project tool window (Alt+1).
Right-click a file and select .
Plain text files are marked with the
icon.
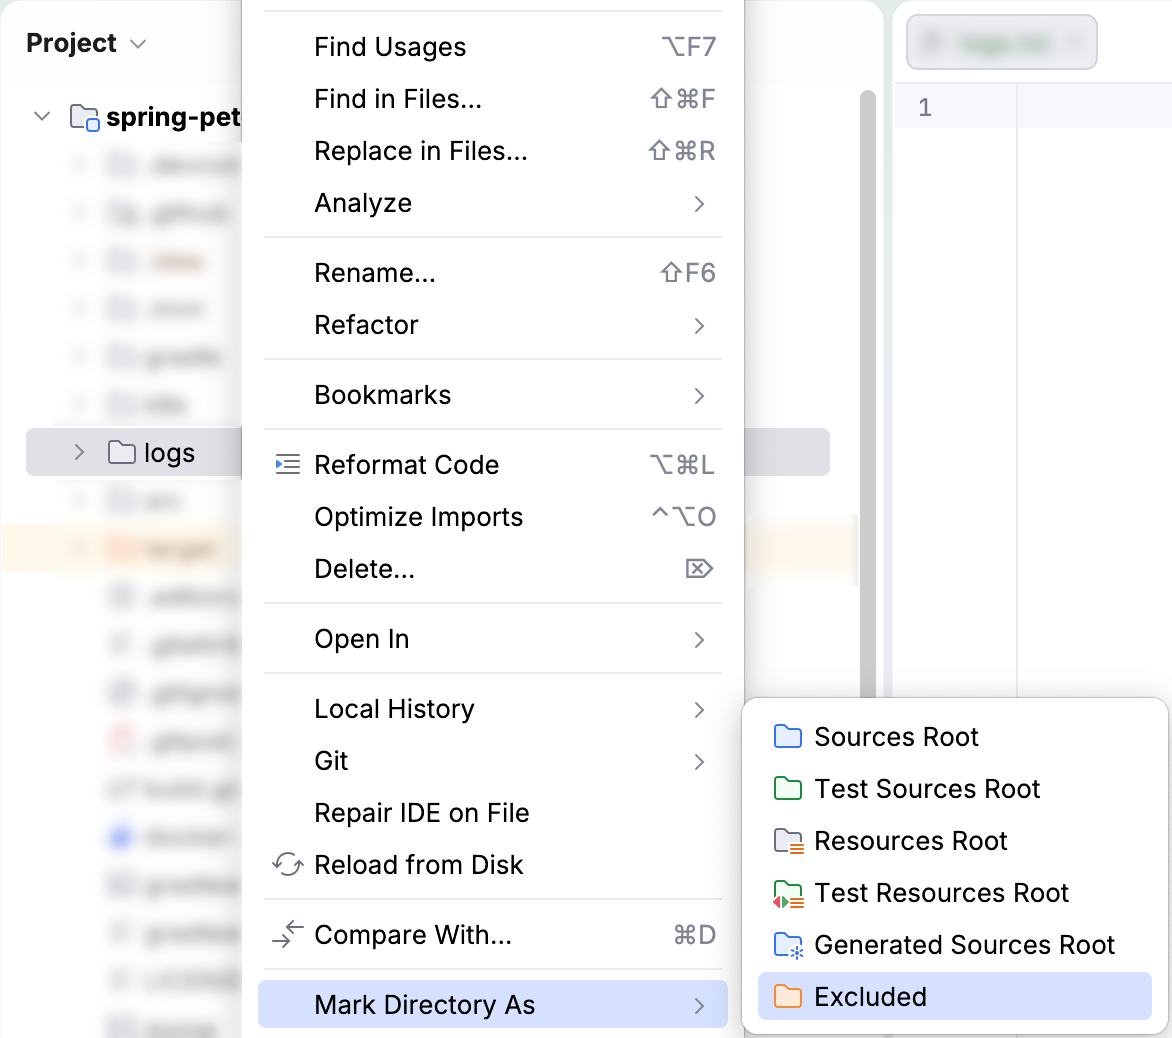
Exclude folders from project analysis
Go to the Project tool window (Alt+1) .
Right-click a folder and select .
Excluded folders are marked with the
icon.
Unload modules
If project analysis takes a significant amount of time, it is possible that your project has more than two modules. If this is the case, you can temporarily set aside (unload) the modules that you are not working with at the moment to speed up project analysis and improve the overall IDE performance.
Files in unloaded modules are not indexed during project analysis, so smart IDE features are not available for them. They are also excluded from compilation.
Manually unload modules
Go to the Project tool window (Alt+1).
Right-click a module and select Load/Unload Modules. A dialog opens.
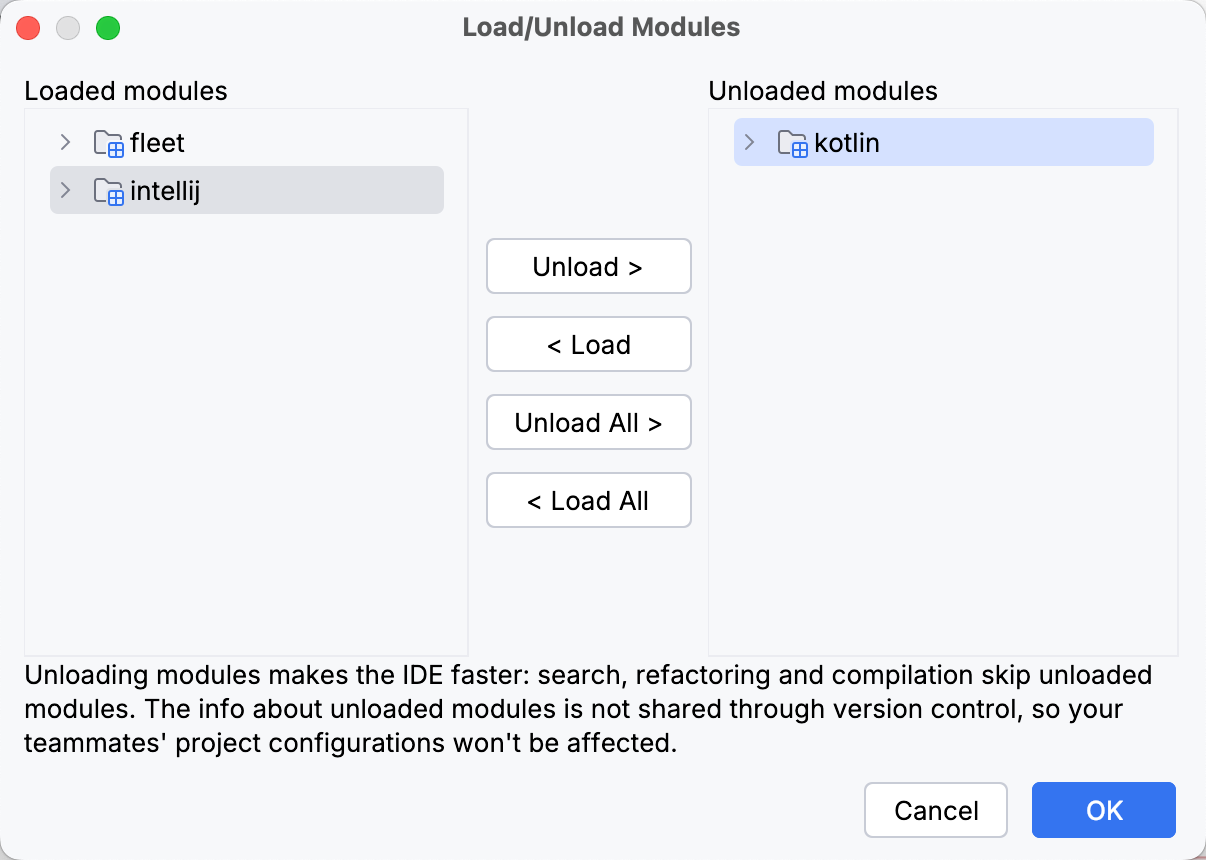
To unload modules, double-click their names or use the buttons in the center of the dialog.
To save the changes, click OK.