Run, debug, and test Scala projects
IntelliJ IDEA lets you run, debug, and test your Scala applications as you would normally do with any other applications in IntelliJ IDEA. IntelliJ IDEA also lets you run your Scala code with coverage and configure code coverage settings.
Run Scala applications
You can run your Scala code through IntelliJ IDEA, use sbt shell, or use Scala worksheet for a quick code evaluation.
For a general overview of running programs in IntelliJ IDEA, refer to Running Applications.
Run a Scala application via IntelliJ IDEA
Create or import a Scala project as you would normally create or import any other project in IntelliJ IDEA.
Open your application in the editor.
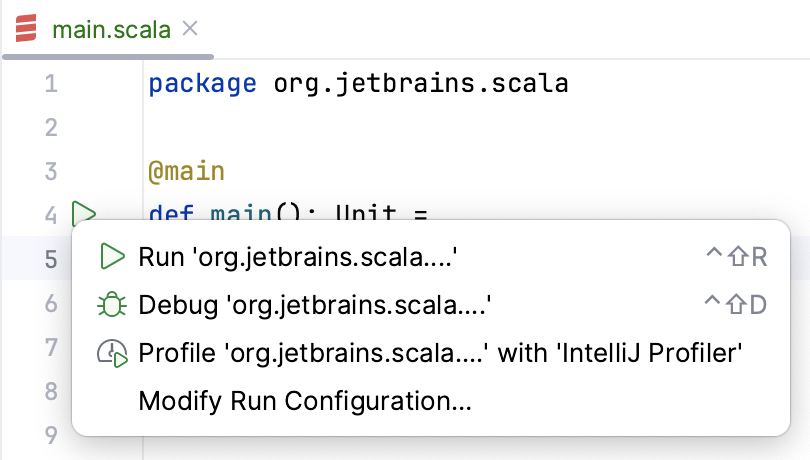
Press Shift+F10 to execute the application. Alternatively, in the editor gutter, click the
icon and select Run 'name'.
Run a Scala application using the sbt shell
You can run your application using the sbt shell that is a part of any sbt project.
Open your sbt project.
If you want to delegate your builds and imports to sbt, in the sbt tool window, click the
icon and select sbt Settings.
On the sbt settings page, under the sbt shell select the builds option (required sbt 0.13.5+) and click OK to save the changes.
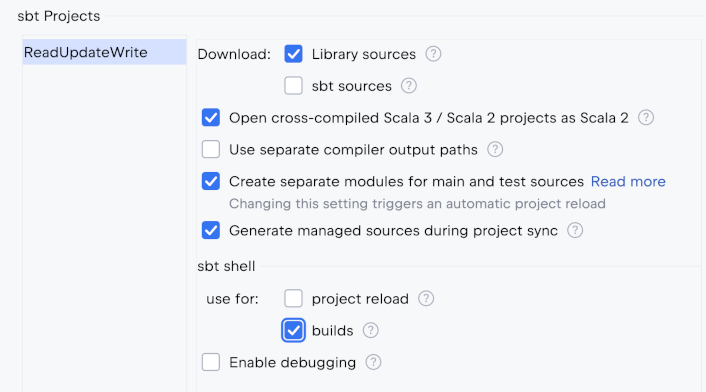
This option is also available when you create or import an sbt project.
If you don't want to delegate your builds and imports to sbt, you can still work in the sbt shell (click sbt shell on the status bar) and run sbt commands directly from it including running your application.
In the sbt projects tool window, click the sbt Tasks node.
In the list that opens, select the run task that will run a main method.
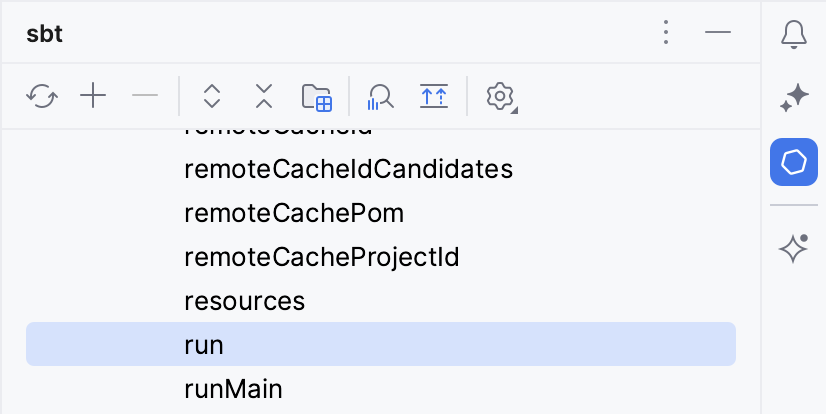
The result of execution is displayed in sbt shell tool window.

Reload changes and hot swapping
Sometimes, you need to insert minor changes into your code without shutting down the process. Since the Java VM has a HotSwap feature, IntelliJ IDEA handles these cases for you. After you make a change in your code, a small popup appears. It offers a hot swap of the code, with the message: "You changed code during the debug session. You can apply these changes without restarting. All modified files will be recompiled and reloaded."

Alternative ways to run Scala code
For quick code evaluation, you can use a Scala worksheet that enables you to interactively run your code. Press Ctrl+Alt+Shift+X to create a light version of the Scala worksheet and Ctrl+Alt+W to run it. Alternatively, you can open Scala REPL and use it to import any class or module of your project and run its methods. For more information, refer to Scala worksheet, Scala REPL and Ammonite.
If your project is a ScalaCLI project, you can also start a ScalaCLI REPL from the terminal, import the project, and through this have access to all its classes, modules, and methods. You can learn more about ScalaCLI projects in IntelliJ IDEA at Using ScalaCLI with IntelliJ IDEA. In a similar way, if you use sbt, you can call sbt console from your terminal. In the screenshot below, we open sbt console for a project which contains a class called Protagonist and then create an instance of this class. For more information, refer to sbt
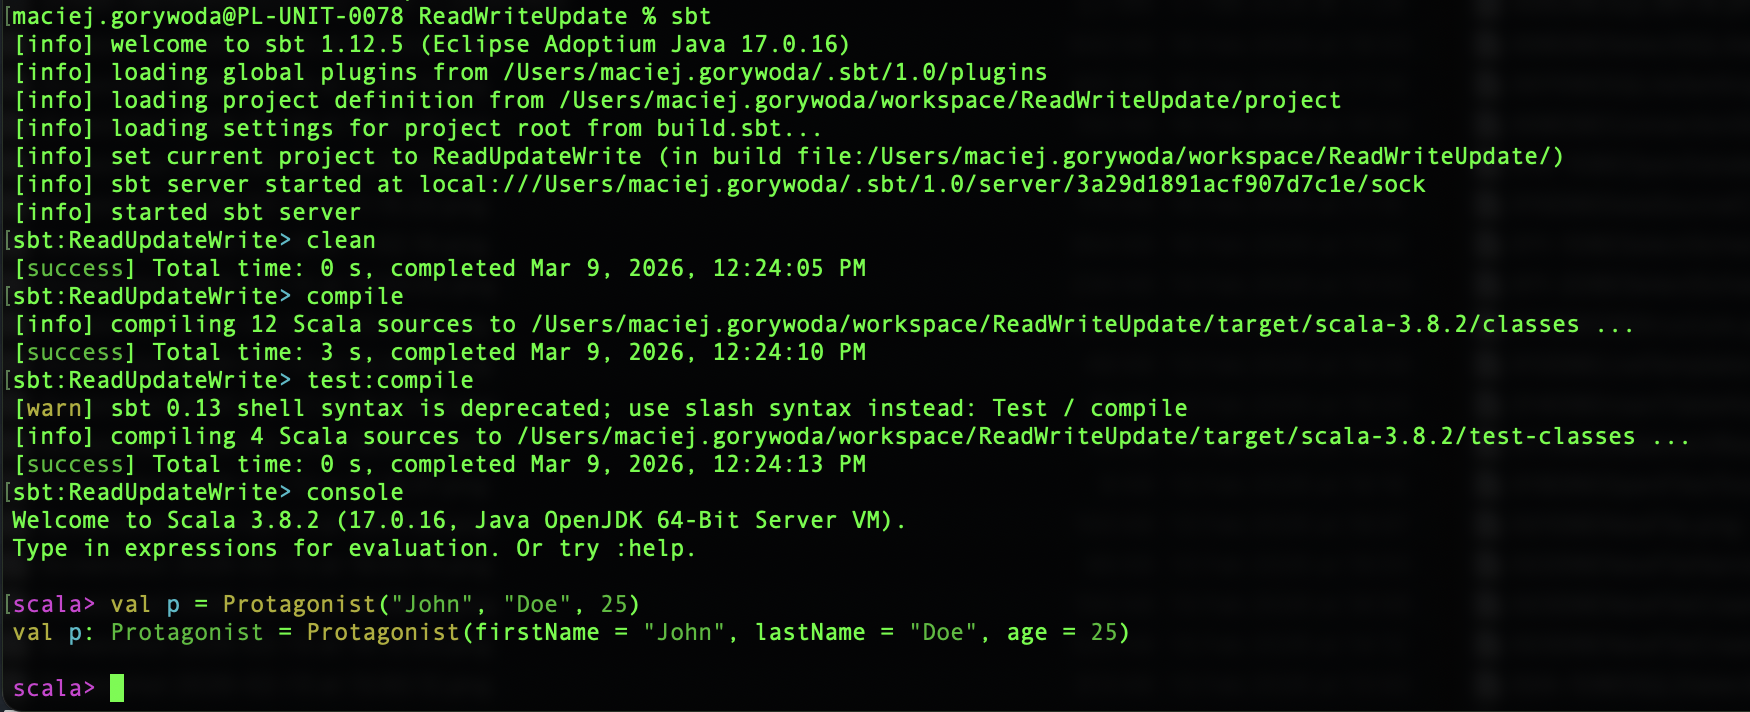
If you need, you can also deploy your Scala application to a server. For more information, refer to Working with Application Servers.
Debug Scala code
IntelliJ IDEA lets you debug your code using IntelliJ IDEA debugger or the sbt shell.
For an overview of debugging in IntelliJ IDEA, refer to Debugging.
Debug Scala code using IntelliJ IDEA
Open your Scala application in the editor.
In the gutter, set your breakpoints for the lines of code you want to debug. For more information about breakpoints, refer to Breakpoints.
If needed, you can access the Run/Debug configurations dialog () and adjust the settings, but usually the default settings are enough to successfully run your debugging session.
Press Shift+F9.
Alternatively, on the project widget, click
icon to start debugging.
Evaluate the results in the Debug tool window.
For more information about using options in the Debug tool window, refer to the Debug code section.
You can adjust the default debugger settings and if you need, turn off the smart step into feature which is enabled by default for the Scala code.
Access the debugger settings
Press Ctrl+Alt+S to open settings and then select .
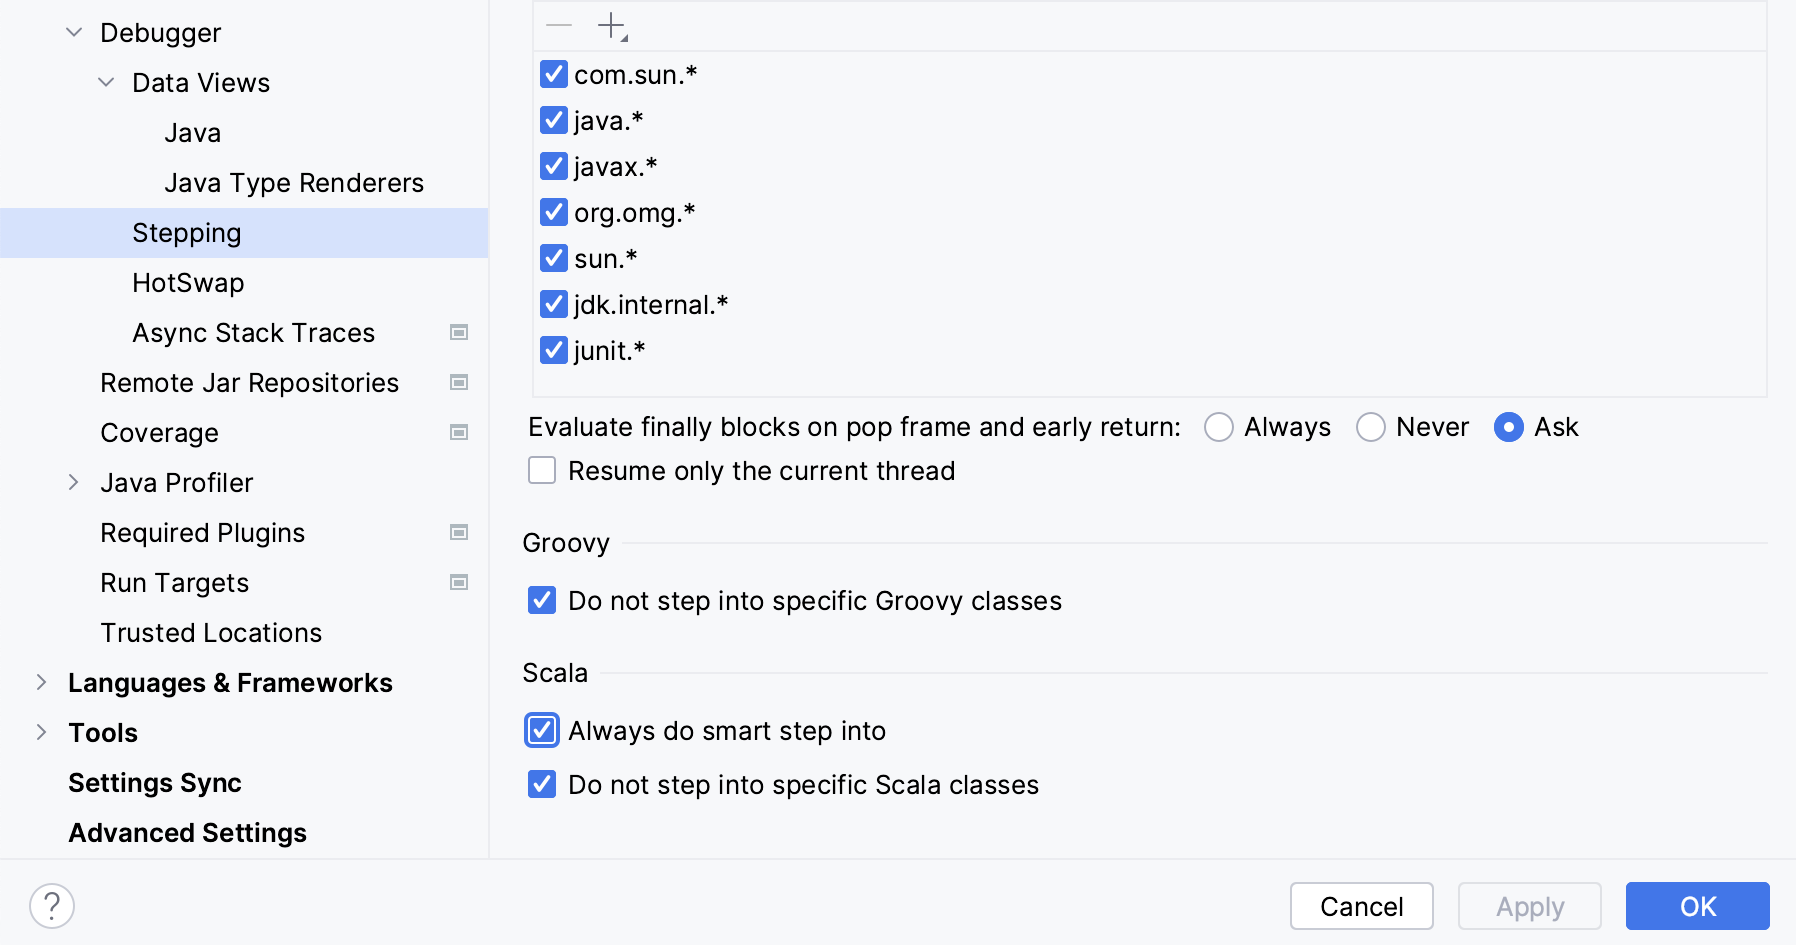
From the options on the right, you can edit the general debugger settings, or scroll down to the Scala section and adjust the Scala-specific debugger settings.
If you need to disable Smart step into for the Scala code, select and disable the Always do smart step into option in the Scala section.
Debug Scala code using sbt shell
Open your sbt project.
Open your application in the editor.
In the editor gutter, set your breakpoints for the lines of code you want to debug.
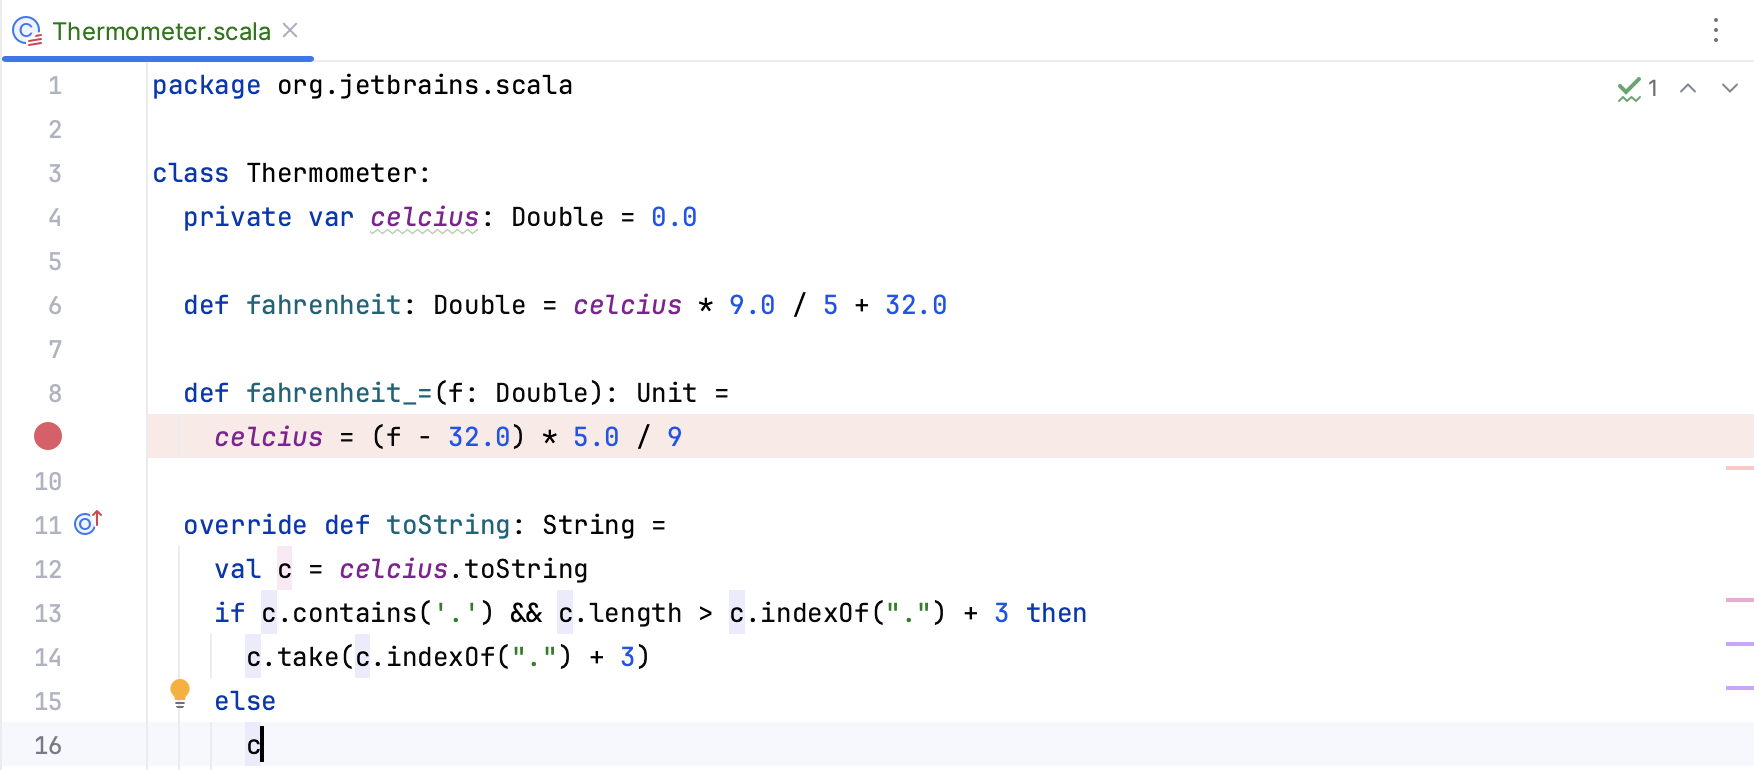
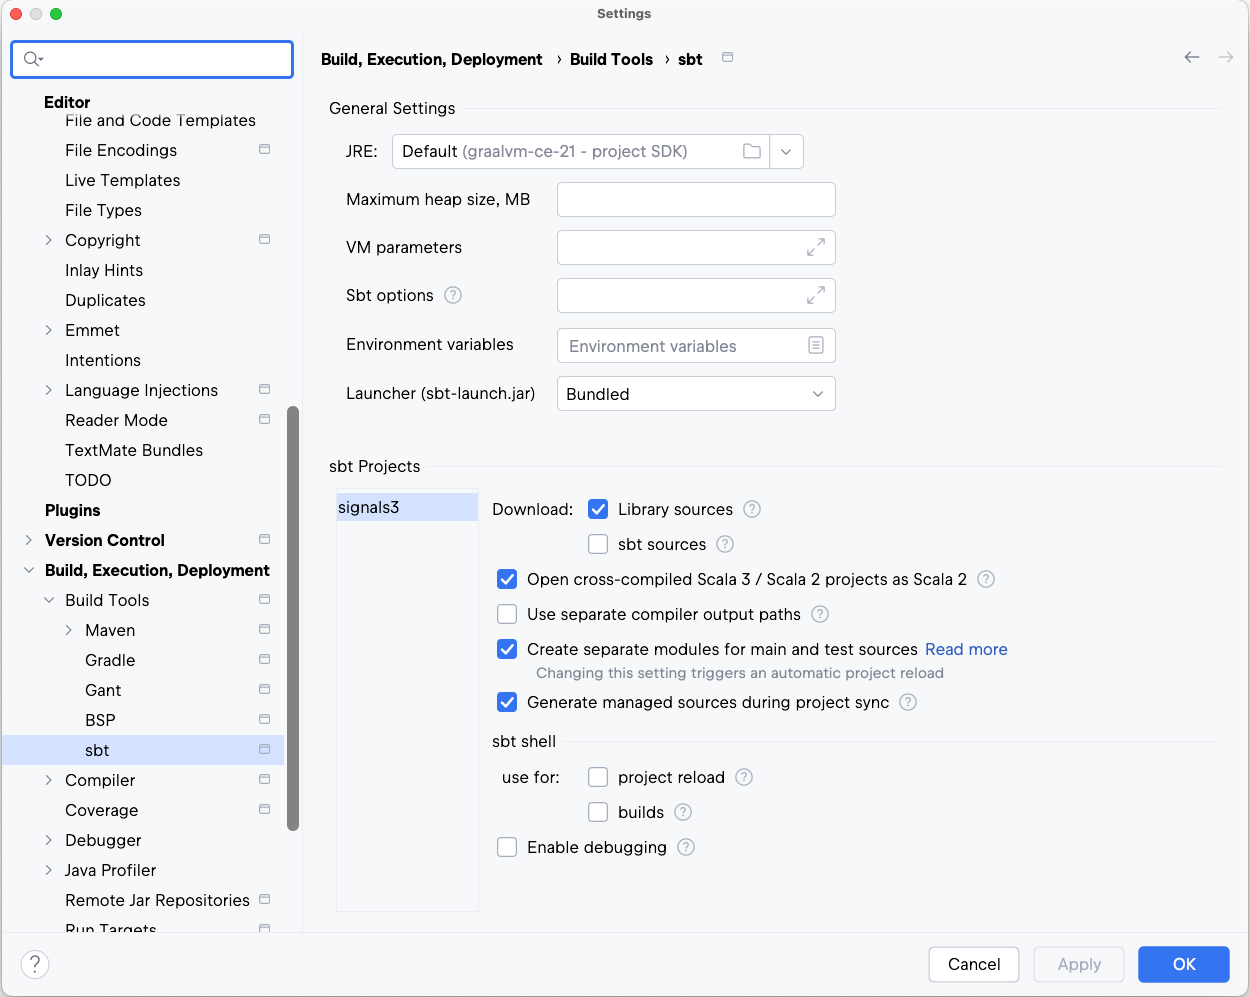
You cannot debug code defined in actual .sbt files, but you can debug code in Scala files that can be invoked from build.sbt.
In the Settings dialog (Ctrl+Alt+S) , select .
On the sbt page, select the Enable debugging and click OK to save the changes.
In the sbt shell tool window, click the
icon to connect to the debugger server and start a debugging session.`
IntelliJ IDEA also creates a run/debug configuration for the debugging session.
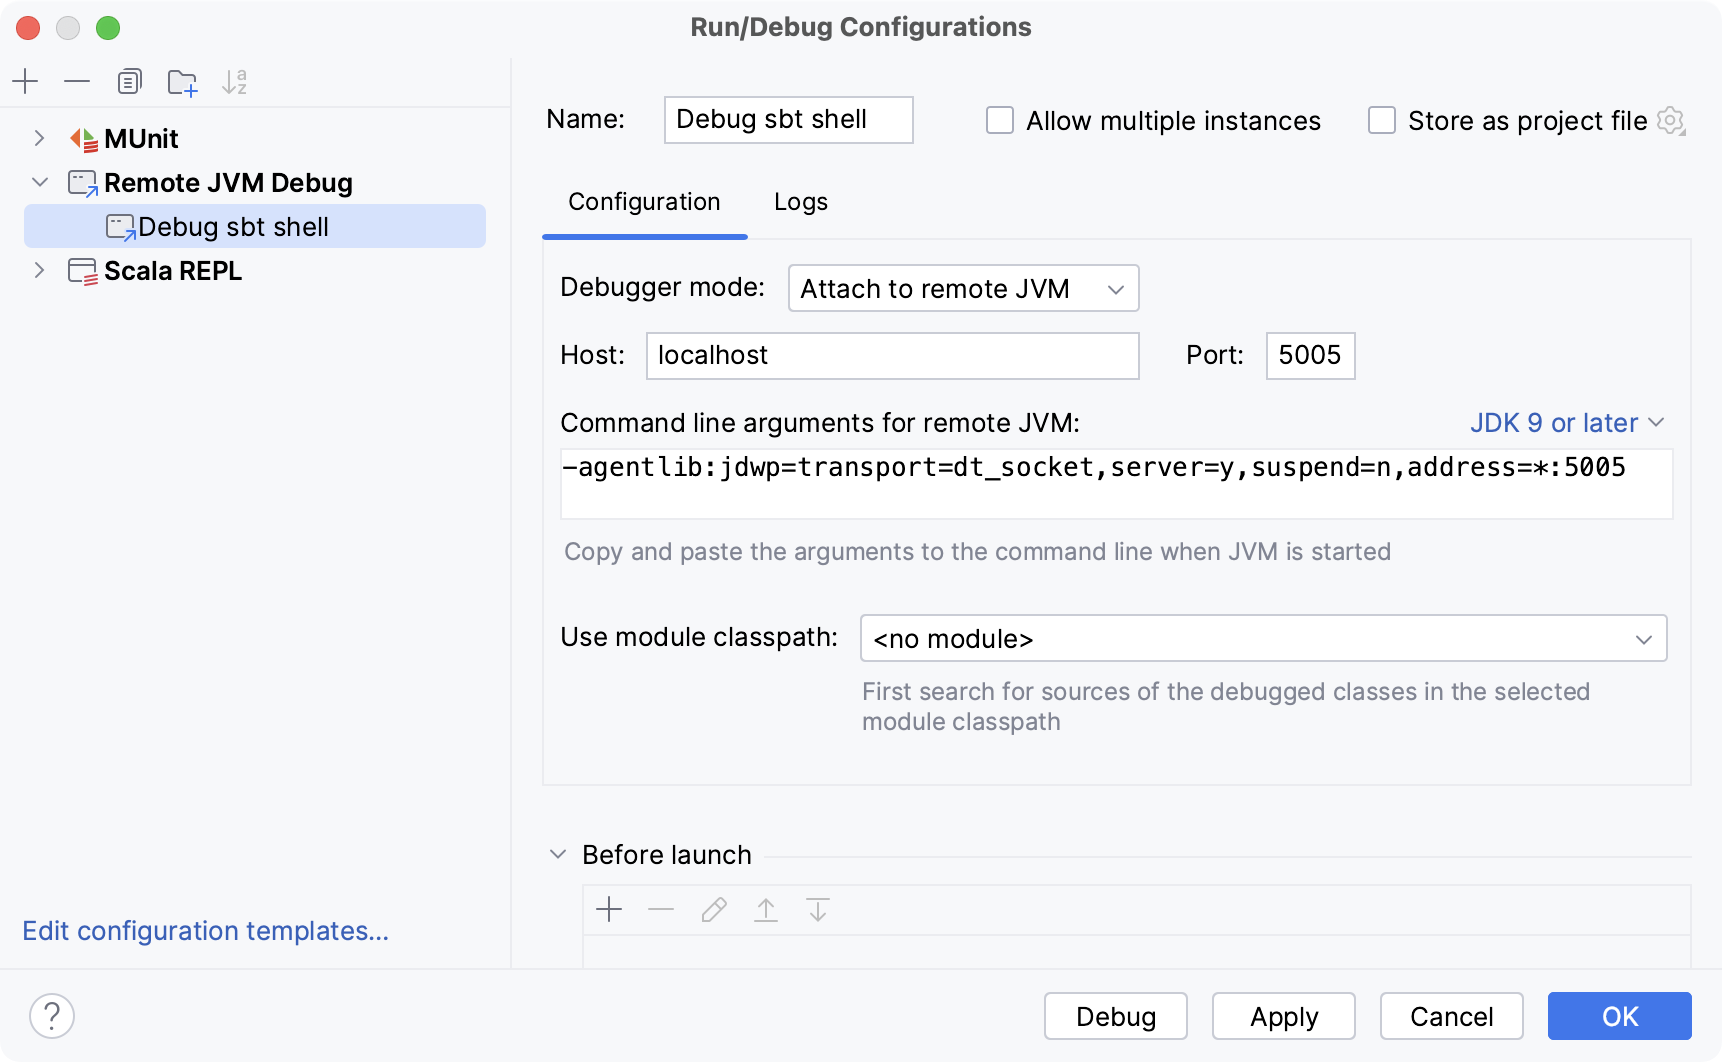
You can edit the run/debug configuration settings, but the default settings should be enough to successfully debug your code.
In the sbt shell enter the
runcommand to run the program.
Evaluate your results in the Debug tool window.

Shortcuts for running and debugging
The regular actions for run/debug are:
Action | Shortcut |
|---|---|
Run | Shift+F10 |
Debug | Shift+F9 |
When in the debug mode, you can evaluate any expression by using the Evaluate expression tool Alt+F8. This tool provides code completion in the same way as in the editor, so it's easy to enter any expression.
Sometimes, you may want to step into a particular method, but not the first one, which will be invoked. In this case, use Smart step into by pressing Shift+F7 to choose a particular method.
Action | Shortcut |
|---|---|
Toggle breakpoint | Ctrl+F8 |
Step into | F7 |
Smart step into | Shift+F7 |
Step over | F8 |
Step out | Shift+F8 |
Resume | F9 |
Evaluate expression | Alt+F8 |
Test Scala applications
IntelliJ IDEA with the Scala plugin lets you test your Scala applications using the following frameworks:
For information on how to debug code in Scala tests, refer to Debug code.
How to test Scala applications
Open your project and configure dependencies:
Assuming you use sbt as your build tool, open the build.sbt file and add a test dependency to
libraryDependenciesClick
icon in the sbt projects tool window to refresh your project or use the Sync project after changes in the build scripts option specified in the Build Tools settings to automatically refresh your project each time you make changes to build.sbt.
If you have a regular Scala project, use the Project Structure dialog, to configure test libraries.
Open a class for which you want to create a test and place the caret within the line containing the class declaration.
Press Ctrl+Shift+T and select Create New Test.
Alternatively, to create a test suite, right-click the class and from the context menu select .
In the dialog that opens, specify your test settings and click OK.
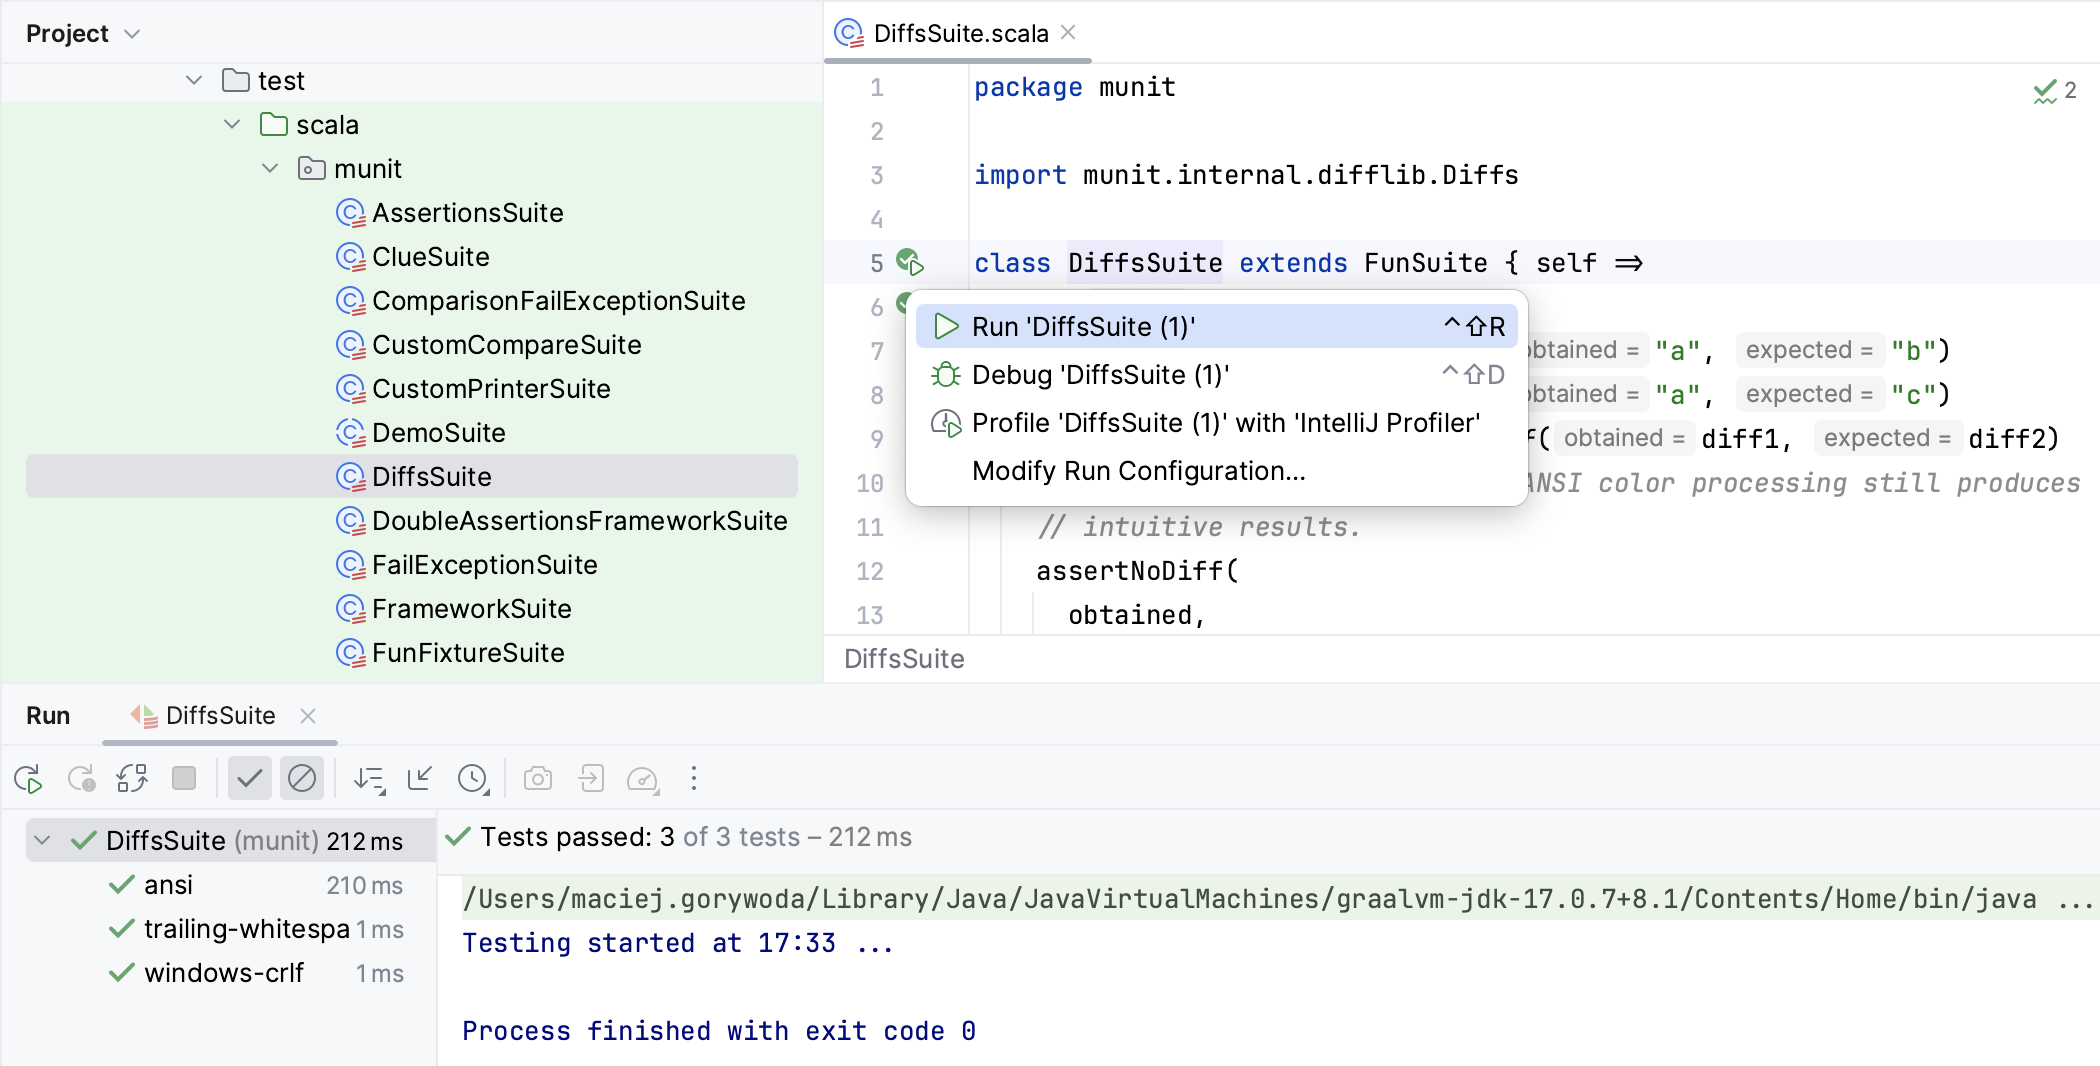
Open the test in the editor, press Ctrl+Shift+F10 or right-click the test class and from the context menu select Run 'test name'.
IntelliJ IDEA creates a run/debug configuration for the test automatically, but if you want to edit settings in your configuration, click from the main menu.
In the Run/Debug Configurations dialog, on the right side, specify settings for the test suite and click OK. The configuration has standard options, and you can find further details in the Run tests section.
You can also specify the following Scala-related options:
You can select the Use sbt shell checkbox to run your test via sbt shell and the Use UI with sbt to display the test results in the same format as for platform test runner.
You can select the Test kind option to specify what kind of test you want to run. For example, you can select Regular expression and set class and test patterns.
On the main toolbar, click the
icon to run the test.
Evaluate the results in the Run tool window.
Test scopes in Scala
You can run tests inside a scope or test the whole scope in your Scala projects.
Create your test scope. For example:
In the editor, depending on your test scope, you can perform the following:
If you open the context menu for one of the tests inside the scope, you can create a run configuration for the specified test inside that scope.
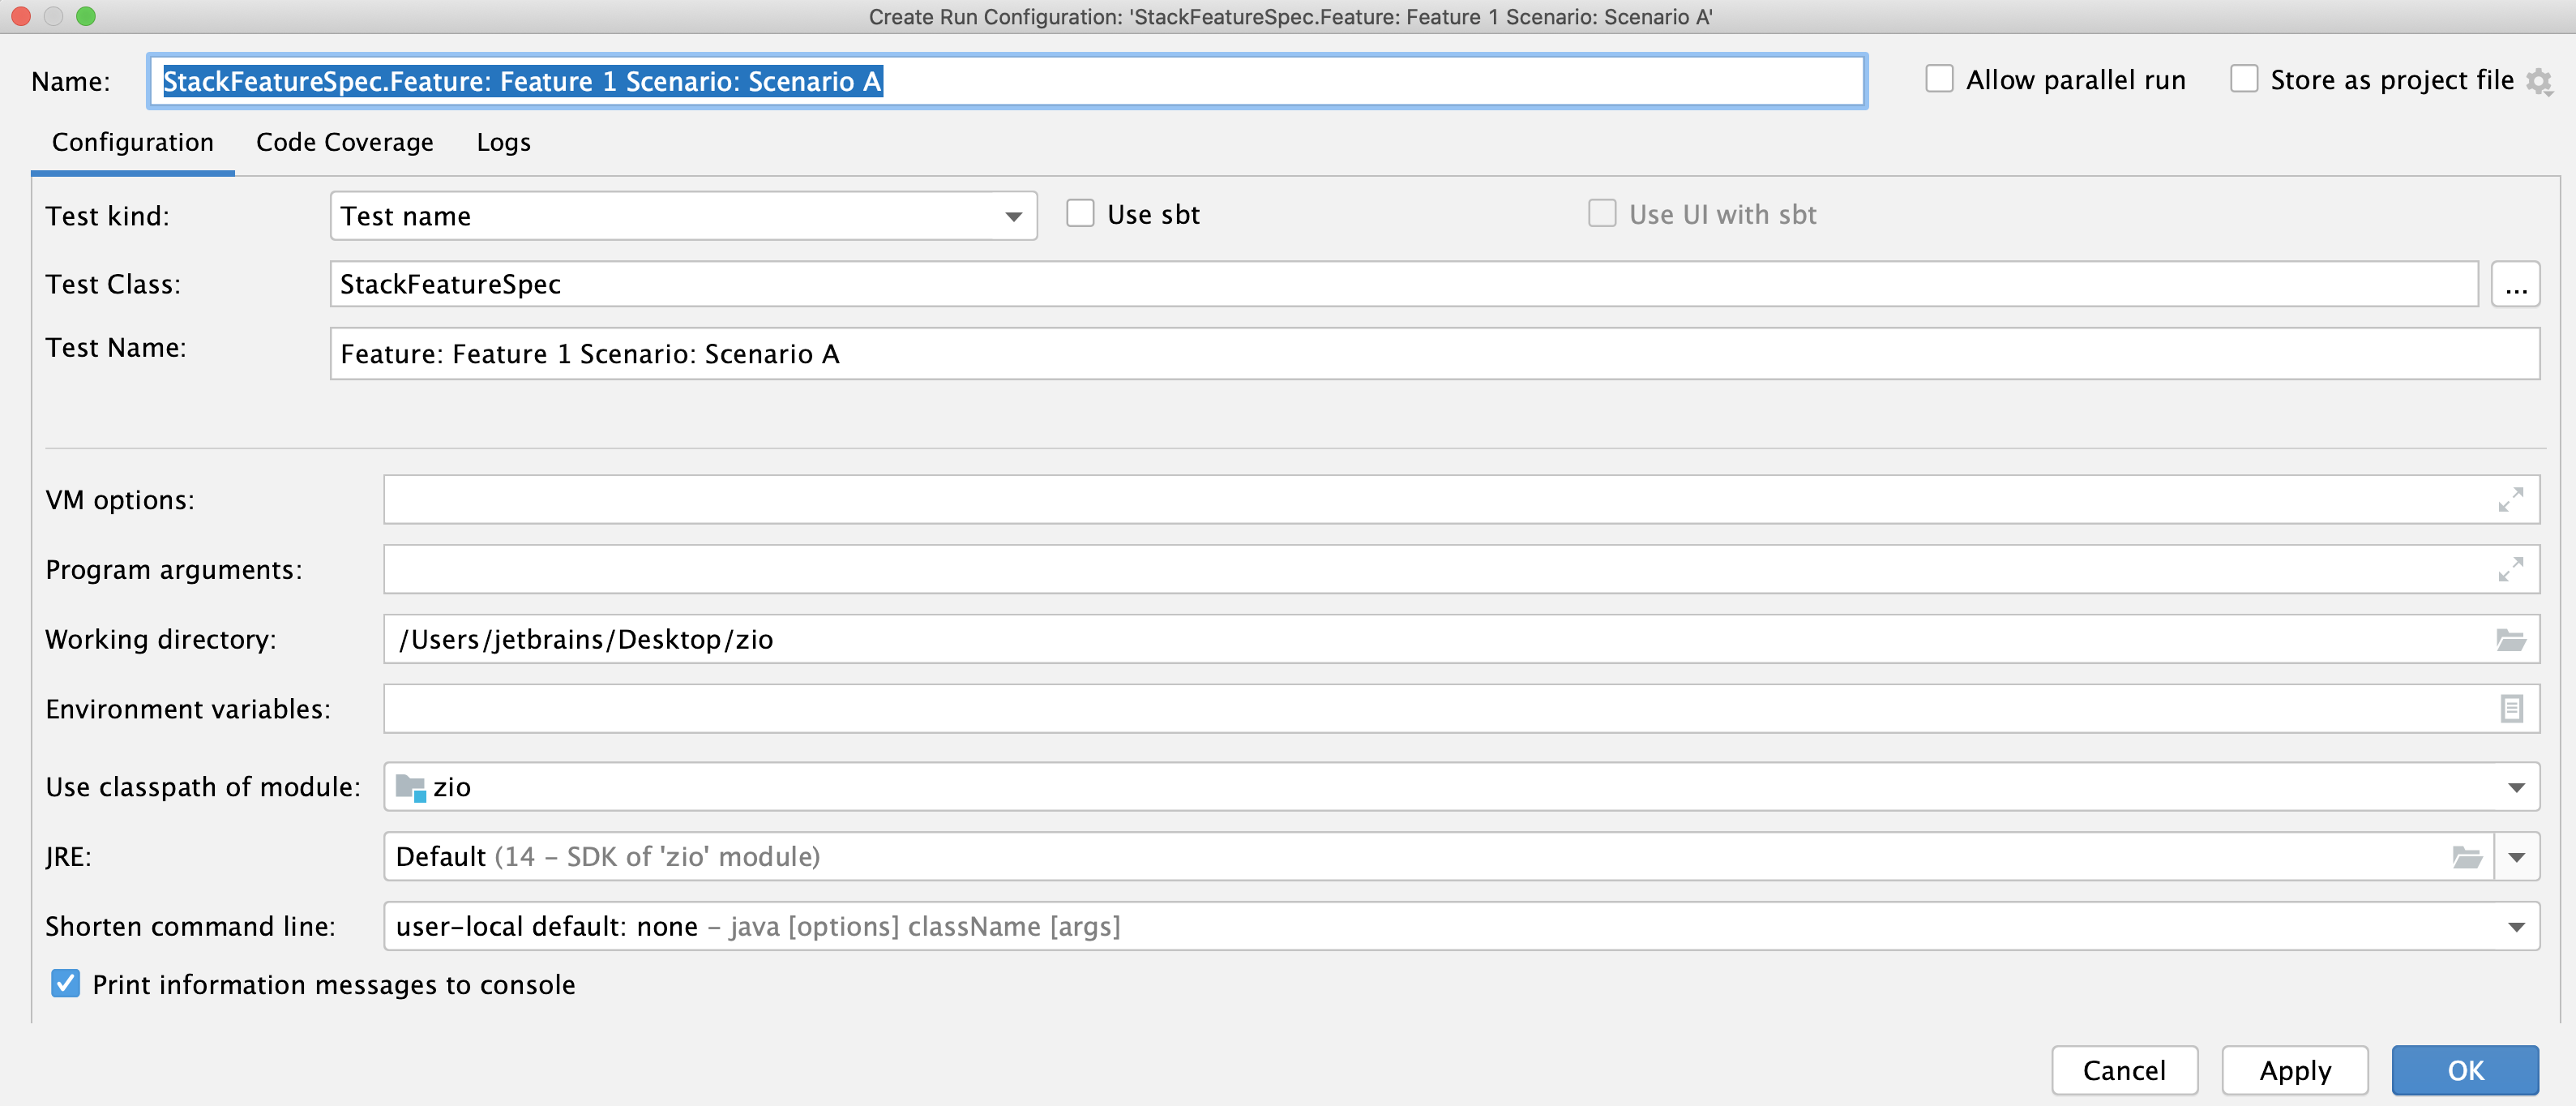
If you open a context menu for the whole scope, you can create a run configuration for all tests inside the scope.
Run your tests and view the output in the Run tool window.

You can also use the sbt shell to run scope tests.
Test Scala applications with coverage
IntelliJ IDEA lets you run your test suite with code coverage.
Enable the Code Coverage for Java plugin
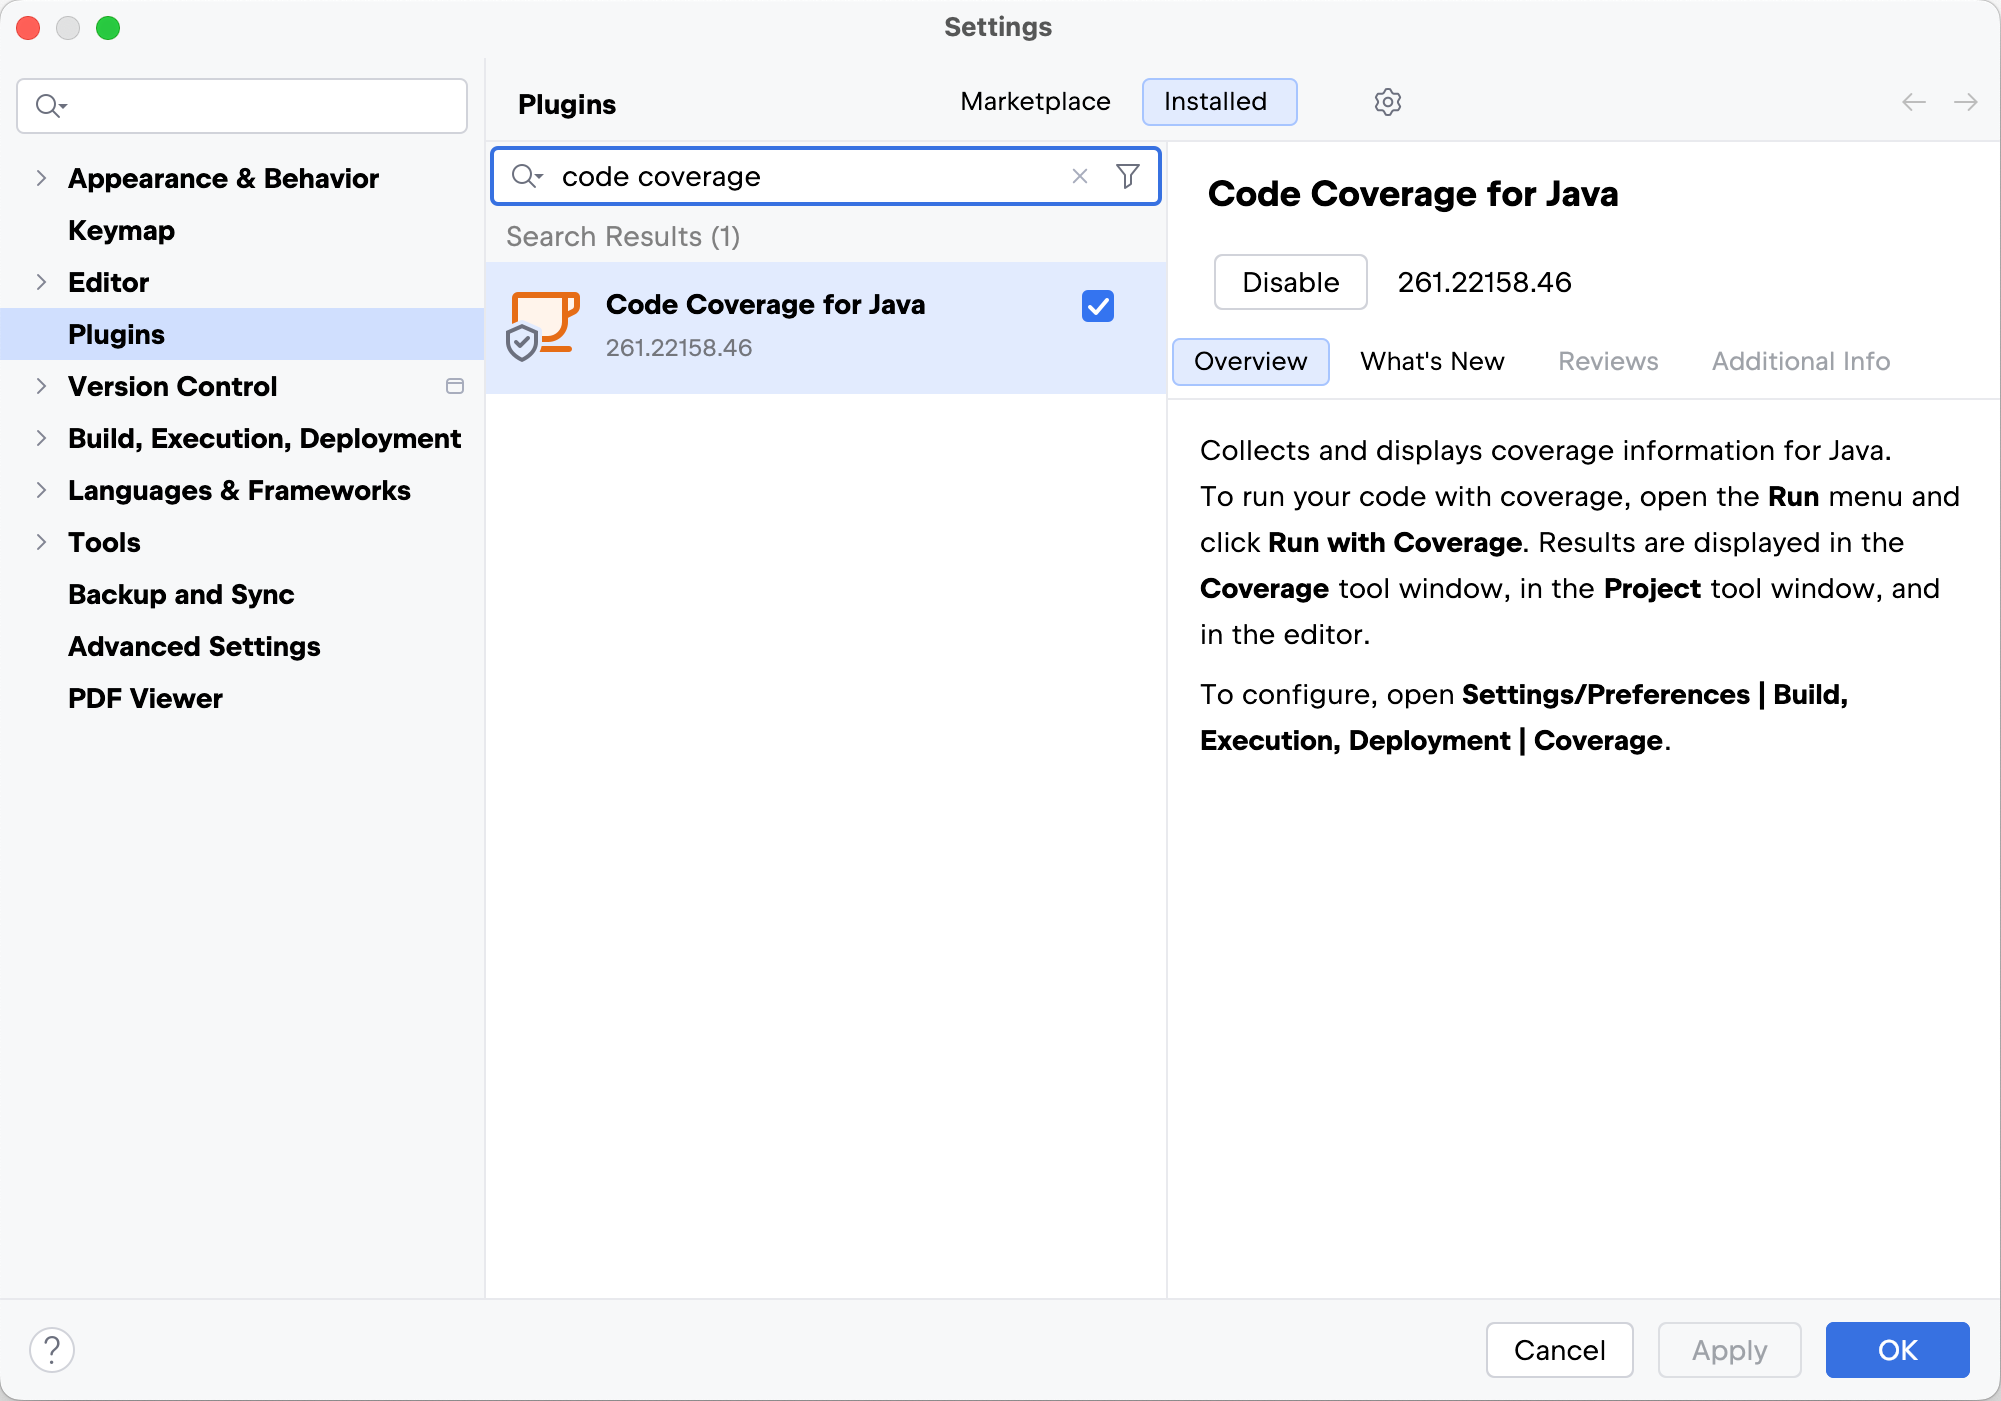
This functionality relies on the Code Coverage for Java plugin, which is bundled and enabled in IntelliJ IDEA by default. If the relevant features are not available, make sure that you did not disable the plugin.
Press Ctrl+Alt+S to open settings and then select .
Open the Installed tab, find the Code Coverage for Java plugin, and select the checkbox next to the plugin name.
Run Scala tests with coverage
Make sure the Code Coverage for Java plugin is installed and enabled.
Open your project.
Open the test you want to run in the editor.
In the gutter, click
and select the Run 'name' with Coverage option.
Alternatively, go to in the main menu to run your code with coverage.
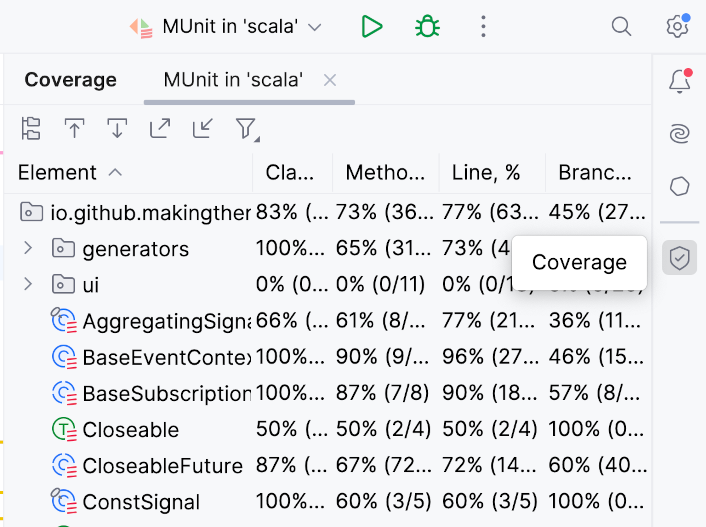
IntelliJ IDEA runs the test and displays the Coverage tool window with code coverage information.
Configure coverage in a run configuration
You can adjust the default code coverage settings or code coverage behavior if you need.
If you have already run your test suite, IntelliJ IDEA creates a run/debug configuration automatically. You can open the created run configuration and adjust its settings. If you want to create a new run configuration for the test suite, do the following:
Make sure the Code Coverage for Java plugin is enabled.
In the main menu, go to .
In the Run/Debug Configurations dialog, click the
icon from the options on the left.
From the list that opens, select the configuration you need.
Open the Code Coverage tab. Adjust the default settings and click OK. For more information, refer to Run configuration settings.
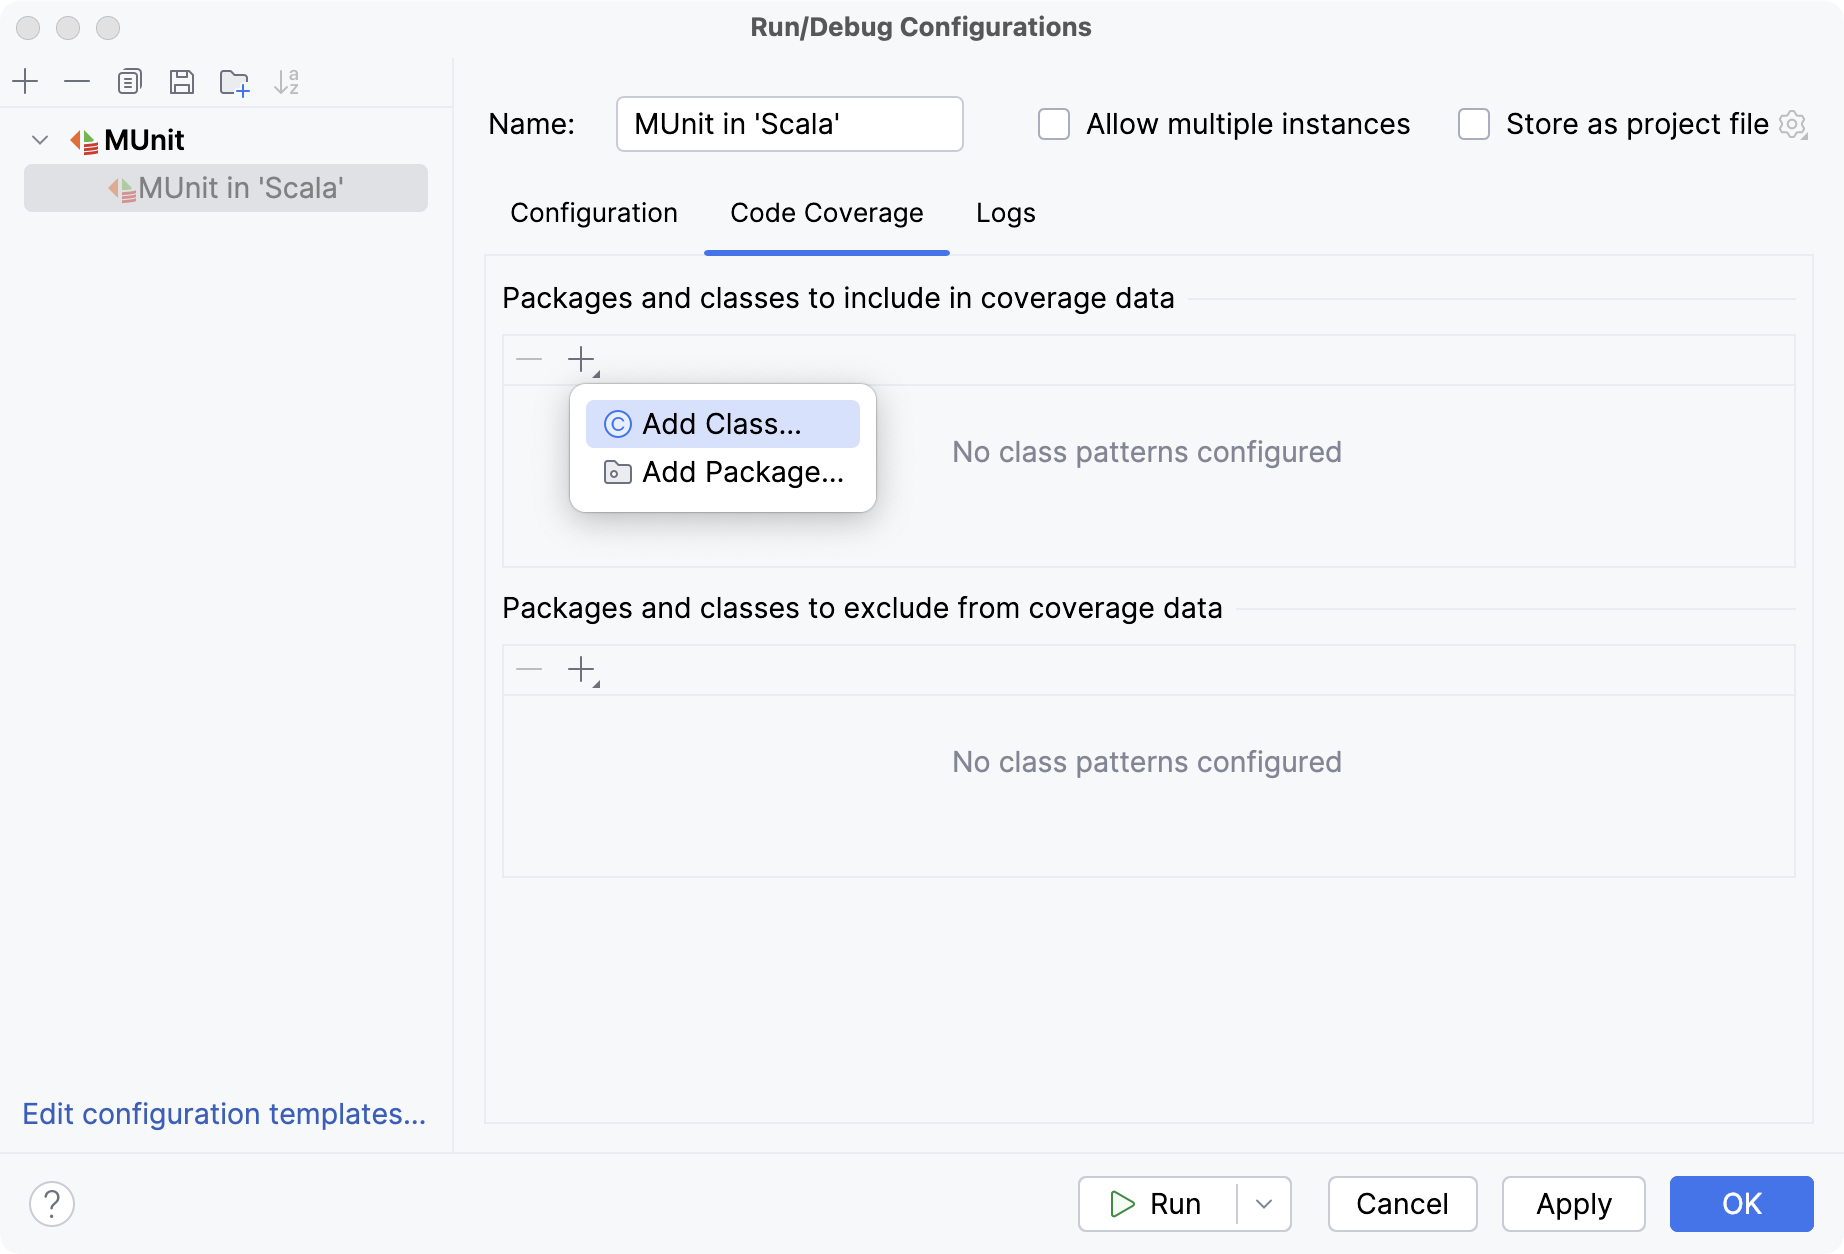
Configure coverage settings
You can also adjust code coverage behavior.
Press Ctrl+Alt+S to open settings and then select .
Adjust the default settings and click OK. For more information, refer to Project settings.