Run and debug
Java and Kotlin by IntelliJ IDEA lets you run and debug Java and Kotlin applications in VS Code, Cursor, or any other VS-Code-based editor. You can start from the editor, create a launch configuration to control how the application starts, or attach the debugger to a running JVM. To learn what the Java and Kotlin by IntelliJ IDEA debugger adds to the standard VS Code or Cursor debugger, refer to Debugger in Java and Kotlin by IntelliJ IDEA.
Build the project
Build your code before you run or debug it, so that the application includes your latest changes.
For Maven and Gradle projects, Java and Kotlin by IntelliJ IDEA provides the intellij: build task. It runs Maven or Gradle to build the module that the launch configuration starts, together with its dependencies.
If the launch configuration runs code from a source set other than main, for example test, the task builds that source set instead. For example, it runs gradle :app:testClasses.
To build the code automatically before every run or debug session, add the intellij: build task to the preLaunchTask field in launch.json.
In Gradle projects, you can use an intellij_gradle launch configuration instead. Gradle compiles the code as part of the run, so you do not need a separate build task. Use an intellij_jvm configuration with intellij: build when you need more control over how the JVM starts.
Run and debug from the editor
Run an application
Open the file with the main method and click Run above the method.

Start a debug session
To set a breakpoint, click the gutter next to an executable line. The application pauses before it runs this line.
Click Debug above the
mainmethod.When the application reaches the breakpoint, Java and Kotlin by IntelliJ IDEA pauses all its threads.
Create a launch configuration
Another way to run or debug a program is to use a launch configuration. It allows you to customize the startup: add arguments, custom commands, and environment variables.
Java and Kotlin by IntelliJ IDEA provides two configuration types for starting an application:
|
| |
|---|---|---|
Starts the application as | A plain | A Gradle task that compiles the code as part of the run |
Requires a separate build | Yes, through the intellij: build pre-launch task | No |
Applies to | Any module | Modules of Gradle projects |
In a Gradle project, both types apply. The intellij_jvm type offers more configuration fields, so use it when you need to control how the JVM starts. Use intellij_gradle when you want Gradle to compile and start the code.
Launch a main class
Use the IntelliJ: Launch main class (JVM) configuration template to run and debug your application by starting java directly.
Add the IntelliJ: Launch main class (JVM) configuration to launch.json and save the changes.
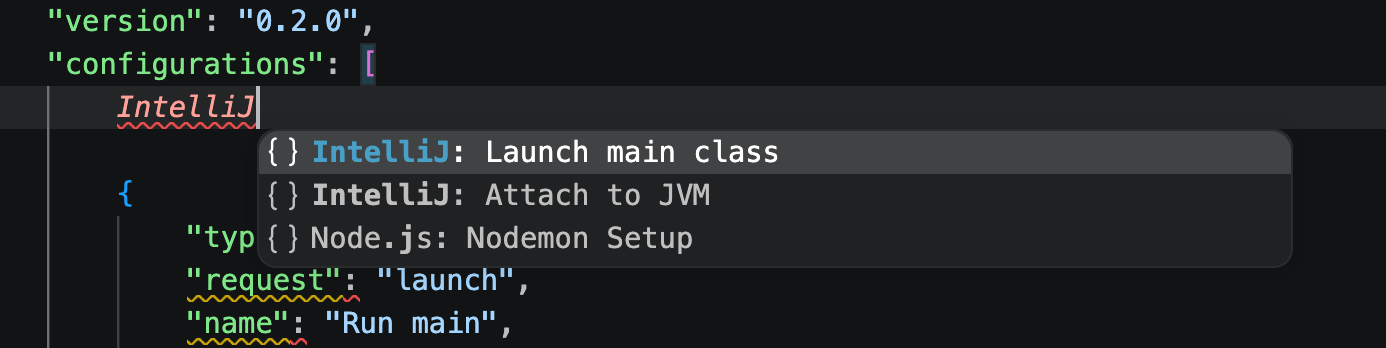
Select the Run main configuration in the Run and Debug view.
Press Ctrl+F5 to run the application or press F5 to start a debug session.
In most cases, you only need to specify mainClass. Java and Kotlin by IntelliJ IDEA finds the source file, classpath, and Java executable from the project settings.
The launch configuration supports the following fields:
mainClassRequired. The fully qualified name of the class with the
mainmethod.filePath to the source file that declares the main class. If omitted, Java and Kotlin by IntelliJ IDEA finds it automatically. Specify this field when several files declare the same
mainClass.classPathsRuntime classpath. If omitted, Java and Kotlin by IntelliJ IDEA finds it automatically.
javaExecPath to the
javaexecutable. If omitted, Java and Kotlin by IntelliJ IDEA finds it automatically.modulePathsJPMS module path.
vmArgsJVM arguments placed before the main class, for example
-Xmx512mor-ea.argsProgram arguments passed to
main(String[]).cwdWorking directory.
envAdditional environment variables.
consoleWhere the application runs and where its output goes. Default:
integratedTerminal.integratedTerminal: the editor runs the application in the integrated terminal. Interactive input works.externalTerminal: the editor runs the application in a separate terminal window. Interactive input works.internalConsole: Java and Kotlin by IntelliJ IDEA runs the application and streams its output to the Debug Console. Interactive input is limited.
Breakpoints, stepping, and variable inspection work the same way in all three modes.
preLaunchTaskTask to run before the application starts. Set it to
intellij: buildto build the module before every run. The IntelliJ: Launch main class (JVM) template includes this field by default.
Launch a Gradle project
Use the IntelliJ: Launch main class (Gradle) configuration template to run and debug a module of a Gradle project. Java and Kotlin by IntelliJ IDEA runs the application through Gradle, which compiles the code as part of the run, so you do not need a pre-launch task.
Add the IntelliJ: Launch main class (Gradle) configuration to launch.json and save the changes.
Select the Run main configuration in the Run and Debug view.
Press Ctrl+F5 to run the application or press F5 to start a debug session.
In most cases, you only need to specify mainClass. Java and Kotlin by IntelliJ IDEA takes the Gradle project and source set from the module.
The launch configuration supports the following fields:
mainClassRequired. The fully qualified name of the class with the
mainmethod.filePath to the source file that declares the main class. If omitted, Java and Kotlin by IntelliJ IDEA resolves it automatically. Specify this field when several files declare the same
mainClass, or set it to${file}to run the file that is open in the editor.argsProgram arguments passed to the application.
vmArgsJVM arguments for the application process that Gradle starts, for example
-Xmx512m. To pass arguments to Gradle itself, usegradleArgs.projectPathThe Gradle project in which to run the application, in Gradle path notation, for example
:appor:modules:lib. If omitted, Java and Kotlin by IntelliJ IDEA uses the project that the module was imported from.sourceSetThe Gradle source set that provides the runtime classpath for the application, for example
main,test, orintegrationTest. If omitted, Java and Kotlin by IntelliJ IDEA uses the source set that the module belongs to.gradleArgsArguments passed to Gradle itself, for example
--offlineor-Pkey=value. Pass program arguments inargsand JVM arguments invmArgs.cwdWorking directory for the application. If omitted, Gradle uses its default for the project.
envAdditional environment variables for the application process. They do not apply to Gradle itself.
consoleWhere the application runs and where its output goes. Default:
integratedTerminal. For the accepted values, refer to theconsolefield of theintellij_jvmconfiguration.
Attach to a running JVM
Use this configuration to connect the debugger over JDWP to a JVM that is already running on the local machine or on a remote host.
Start the target JVM with JDWP enabled by adding the following VM option:
-agentlib:jdwp=transport=dt_socket,server=y,suspend=n,address=*:5005Add the IntelliJ: Attach to JVM configuration to launch.json, set
portto the port the JVM listens on (5005in the example), and save the changes.Select the Attach to JVM configuration in the Run and Debug view and press F5 to start the debug session.
The launch configuration supports the following fields:
portRequired. The debug port that the application listens on. Default:
5005.hostNameThe host that the target JVM is listening on. Default:
localhost.timeoutConnection timeout in milliseconds. Default:
30000.
Debugger in Java and Kotlin by IntelliJ IDEA
Java and Kotlin by IntelliJ IDEA works with the standard VS Code-based debugging UI: the Run and Debug view, the Debug Console, and the debug toolbar. For the basics, refer to Debugging in VS Code. This chapter covers only what the Java and Kotlin by IntelliJ IDEA debugger adds, changes, or does not support for JVM applications. For debugging tests, refer to Run and debug tests.
Breakpoints
Java and Kotlin by IntelliJ IDEA supports the breakpoint types typical of VS Code-based editors, with the following JVM-specific behavior and limitations:
Conditional breakpoints
A breakpoint condition is evaluated as a Java or Kotlin expression, depending on the language of the source file. If the expression cannot be evaluated, the debugger reports an error and does not suspend the application.
Hit counts
For a hit count, specify a positive integer. For example, a hit count of 5 pauses the application every fifth time it reaches the line. Expressions and operators such as
>5or%3are not supported.Logpoints
Logpoints write messages to the Debug Console without suspending the application. You can include expressions in curly braces in the log message, for example:
user = {user.name}You can also add a condition to a logpoint.
Inline breakpoints
Inline breakpoints are not supported. VS Code lets you set one, but the debugger ignores it and does not pause the application.
Function breakpoints
You can add a function breakpoint in the Breakpoints section of the Run and Debug view. Specify the function using the following pattern:
<class pattern>.<method pattern>The debugger splits the pattern at the last dot. Both the class and method parts support the
*wildcard. A pattern without a dot matches the method in any class.Class names use fully qualified JVM names. For a nested class, separate the outer and inner class names with
$, for example,com.example.Outer$Inner.process.Exception breakpoints
In the Breakpoints section, select Caught Exceptions, Uncaught Exceptions, or both. Both options are off by default. Exception breakpoints apply to all exception classes. Setting a breakpoint for a specific exception class or adding a condition to an exception breakpoint is not supported.
Stepping
Step Into can enter JDK and library code as well as your application code. If the current line contains several method calls, use Step Into Target Ctrl+F11 to select the particular call that you want to enter.
Pause and Continue apply to all application threads. The Call Stack view lists threads while the application is suspended.
Evaluate expressions
You can evaluate expressions in the Watch section, Debug Console, and editor hovers. Expressions are evaluated in the context and language of the selected stack frame: Kotlin expressions in Kotlin frames and Java expressions in Java frames.
In the Debug Console, code completion is available for Java expressions. Type a dot to invoke code completion.
Inspect and modify variables
In the Variables section, use Set Value to change a variable value. You can enter an expression instead of only a literal value. Values of final fields are read-only.
For large arrays and collections, the Variables section displays only the first 100 elements. String values longer than 1000 characters are truncated.
Work with stack frames
Restart Frame is available for every stack frame except the bottom one, which is the first call in the thread.
The Call Stack view collapses frames from libraries and the JDK under Show More Stack Frames. Select it to display the hidden frames.
View asynchronous stack traces
When execution stops in asynchronous code, the Call Stack view can also show the stack frames where the asynchronous task was scheduled. This helps you trace execution back to the code that started the task.
Asynchronous stack traces are available for debug sessions started with an intellij_jvm launch configuration.
Stop and disconnect
Stop Shift+F5 terminates the application.
When you attach the debugger to an existing JVM, use Disconnect Shift+F5 to end the debug session without terminating the JVM.