Get Started with Timeline Profiling
Unlike "classic" performance profiling, during timeline profiling dotTrace collects temporal call stack and thread state data. You get the same data about call times, but bound to a timeline. This way, you can analyze not only typical "what is the slowest method?" issues, but also the ones where the order of events does matter, such as UI freezes, excessive garbage collections, uneven workload distribution, insufficient file I/O, and so on.
Running the profiler and getting snapshots
To start timeline profiling, simply choose the Timeline profiling type when configuring a session.
The process of gathering snapshots is absolutely identical to the one during performance profiling. You simply click the Get Snapshot and Wait button during the application execution. To analyze collected timeline profiling snapshots, you should use a separate dotTrace component called Timeline Viewer.
First look at the timeline user interface
Let's make a little digression and take a look at the user interface of Timeline Viewer.

The analysis workflow in the viewer is quite simple: all you do is slice and dice the collected temporal data using filters.
So, where are the filters? Actually, almost all UI elements you see on the screen not only display data but also allow applying specific filters. The result of filters' work is always a set of time intervals or point events selected by a specific condition. For example, clicking Events | File Operations will tell dotTrace to Select all time intervals on all threads where the application performed file I/O operations. Clicking on the Main thread in the Threads list will Select lifetime of the Main thread.
Of course, filters can be chained together. If you activate two filters mentioned above one after another, you will get the resulting filter: Select all time intervals where the Main thread performed file I/O operations. By carefully combining filters, you can investigate almost every aspect of your application.
How to
Now let's take a look at the most important Timeline Viewer use cases. In this section, you will find how to:
- Find and select an interval with high CPU usage
- Find the slowest method and see its call tree
- Quickly understand what's going on in a method
- See method's parent calls
- Find a method by its name
- Find the cause of a UI freeze
- Find the cause of excessive memory allocation
- Trace an HTTP request
Find and select an interval with high CPU usage
The intervals with high CPU usage are of the main interest when you need to evaluate the overall application performance and find methods with the highest own time. You can quickly find and select such intervals using the Process overview diagram: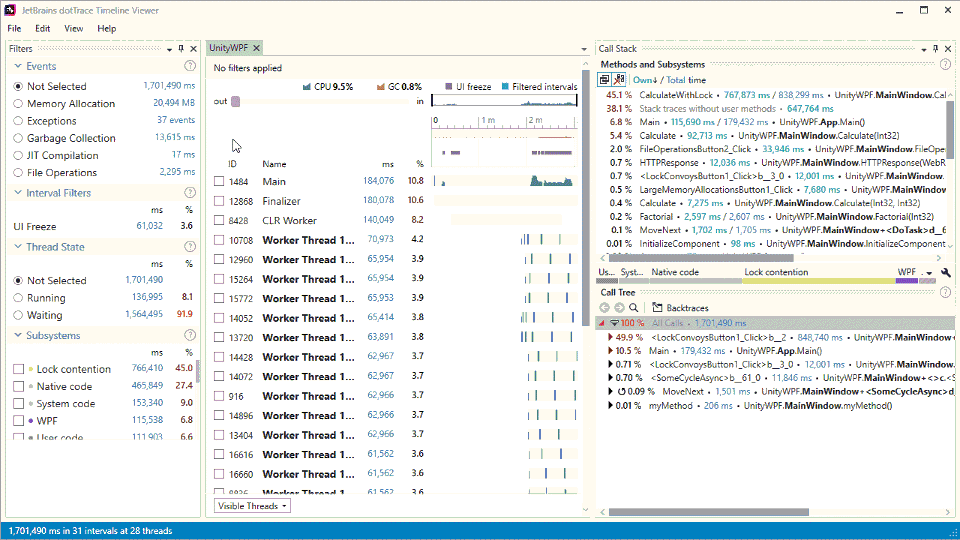
Find the slowest method and see its call tree
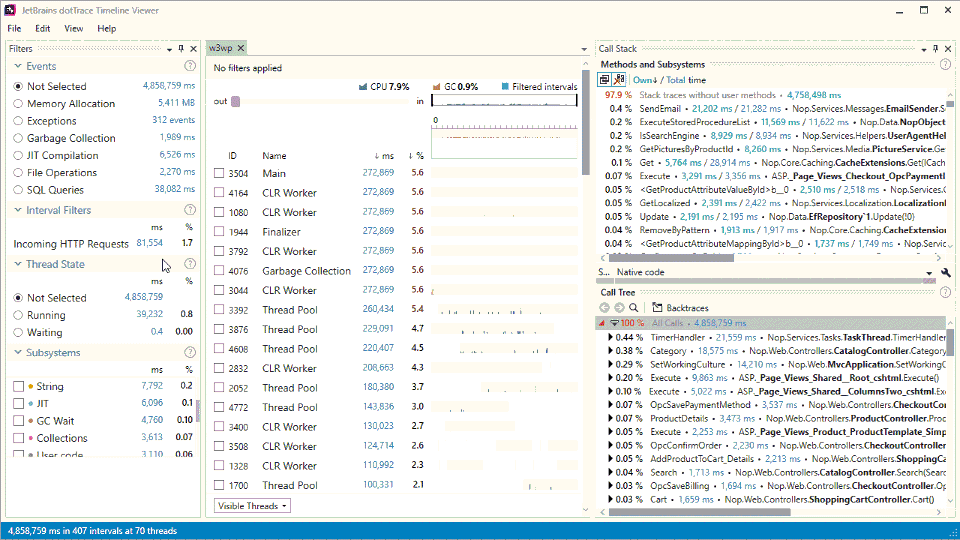
Once you found the time interval you are interested in, the next step is to find the slowest method on this interval and examine method's call tree. The latter will help you to identify "why the method is slow" or "what exact child calls of the method occupy most of the time". You can perform both operations by using the Call Stack window that consists of the Methods and Subsystems list (shows methods with the highest own/total time on the interval) and Call Tree: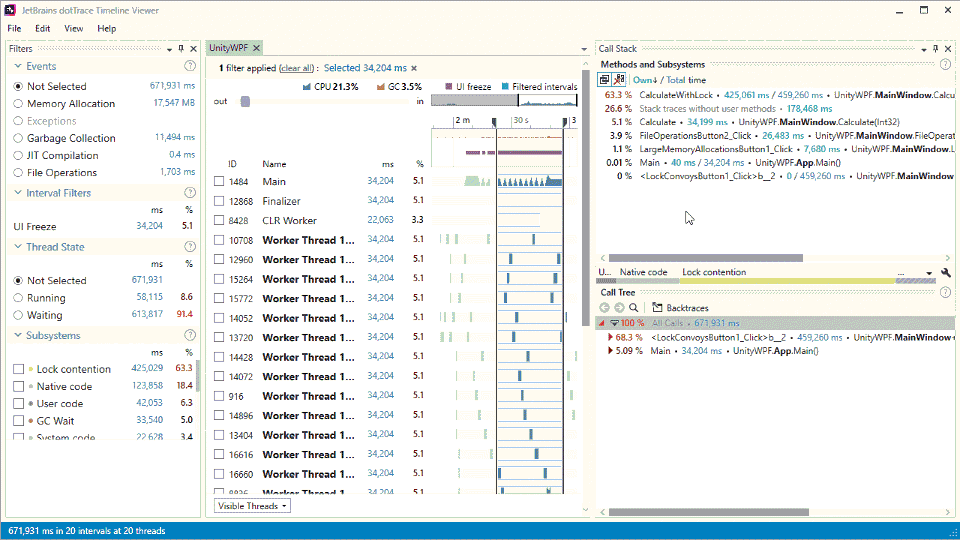
Quickly understand what's going on in a method
Since the version 2017.1, Timeline Viewer offers the super-helpful Subsystems feature. The purpose of Subsystems is to quickly answer the main question “What the heck is going on in my app?”, along with more specific questions like “What causes the performance drop?” or “What allocates so much memory?”. Does the performance drop relate to file operations, JIT, strings processing, or just some excessive work in my code? The Subsystems filter is the single place that shows you how time on the selected time interval is distributed among various activities. In the example below, the Subsystems bar shows that the main time in the method is occupied by lock contention: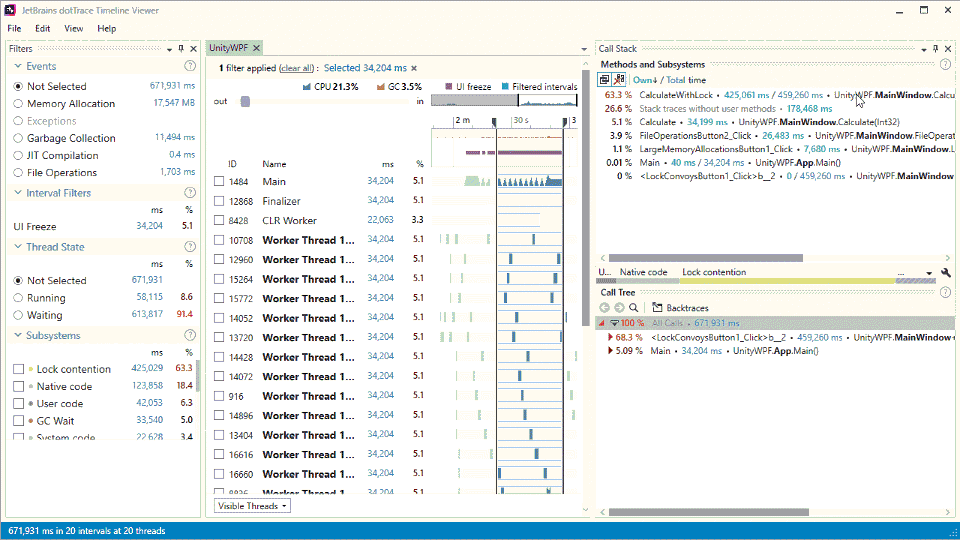
See method's parent calls
When examining a problematic method, it's important not only to check its child calls but also understand how the method is called by itself. For this purpose, you can switch Call Tree to the Backtraces mode. In this mode, you can see the execution path up to the first method in the stack (so, in some sense, Backtraces is the inverted Call Tree):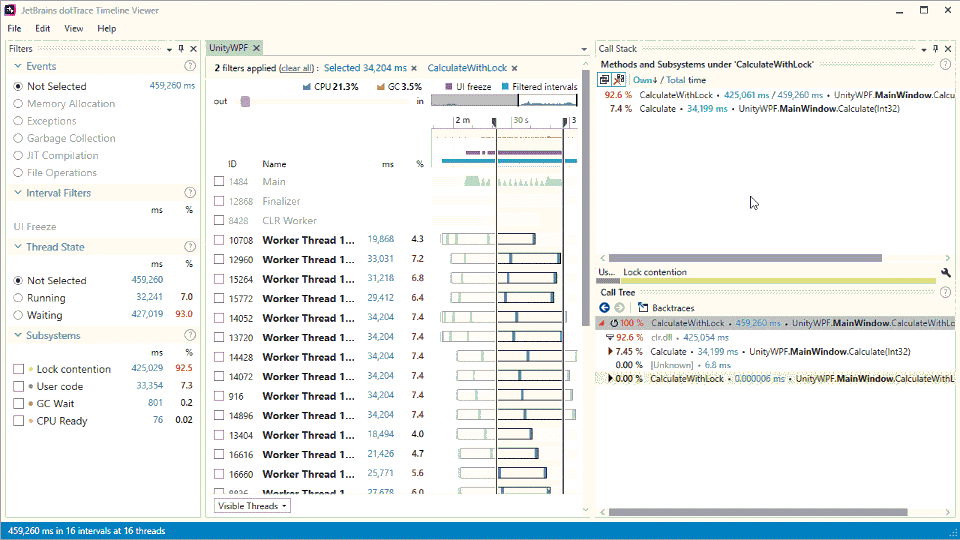
Find a method by its name
Sometimes, you need to check the performance of some particular method: how long does it take, where it is called on the timeline exactly, and so on. In this case, you can find the method you're interested in by its name. For instance, in the example below, we'll find theFactorial method: 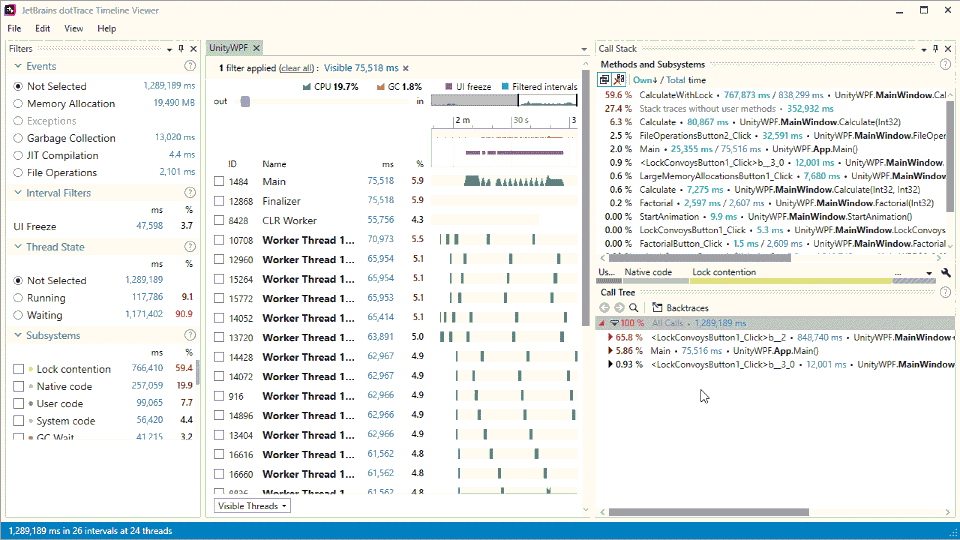
Note that right after Timeline Viewer finds the method, it also automatically applies the filter by this method.
Find the cause of a UI freeze
The analysis of UI freezes is the field where dotTrace shows its best. The intervals where the GUI of your application freezes are detected automatically. Typically, all you need is select a UI freeze and examine the Methods and Subsystems list: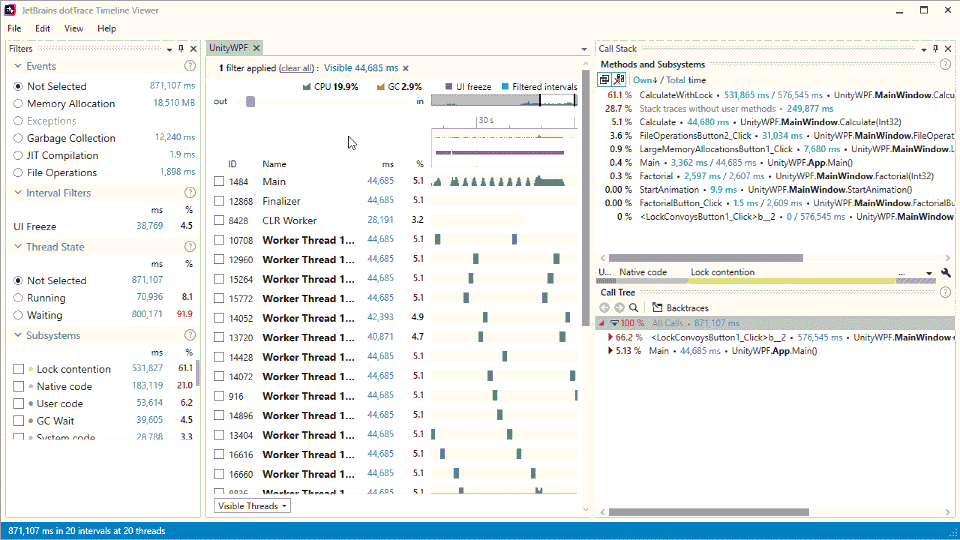
Find the cause of excessive memory allocation
The excessive memory allocation, or more correctly, its consequence in the form of garbage collection may have a great impact on application performance. Therefore, it's very important for performance analysis to understand the origin of memory allocations in your application. The example below shows how to use the Memory Allocation event to determine methods and subsystems that allocate the most memory: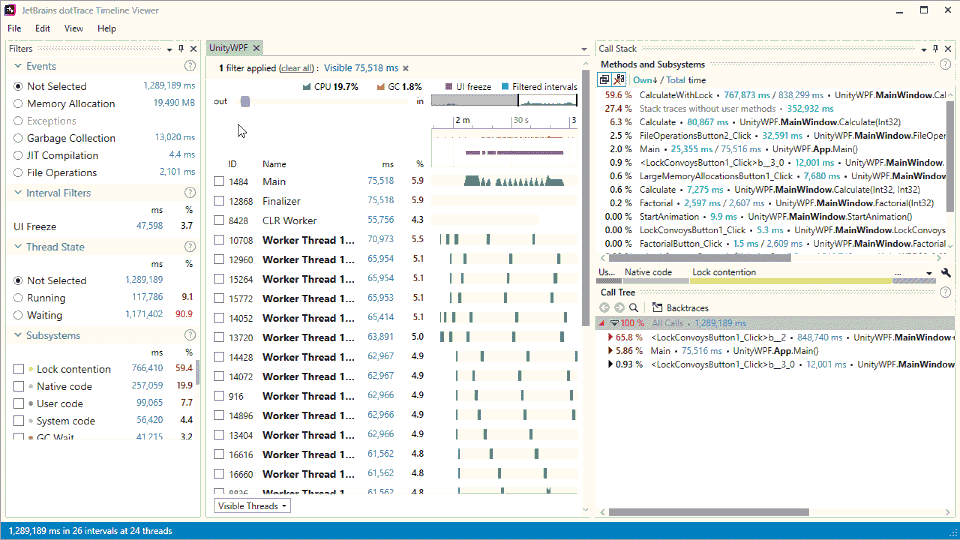
Trace an HTTP request
The ability to trace an HTTP request is very important when analyzing performance drawbacks in a web application. dotTrace allows you to trace a transaction in the same way as in any Application Performance Management (APM) system, i.e. you can filter requests to particular URLs, see HTTP methods behind them, as well as all operations your server does in order to process the request, like SQL transactions or .NET code. Moreover, dotTrace has a significant advantage over APM systems as it provides full-fledged call tree analysis: