Working with dotTrace Integrated in Visual Studio
dotTrace integrated in Visual Studio is very convenient when profiling is the essential part of your development process (e.g., when you work on optimizing performance in your code). One of the main benefits of using dotTrace in this mode is that you can profile the so-called 'run configurations'*. Since dotTrace 10, you can not only start profiling session in Visual Studio, but also analyze timeline profiling results using the integrated viewer.

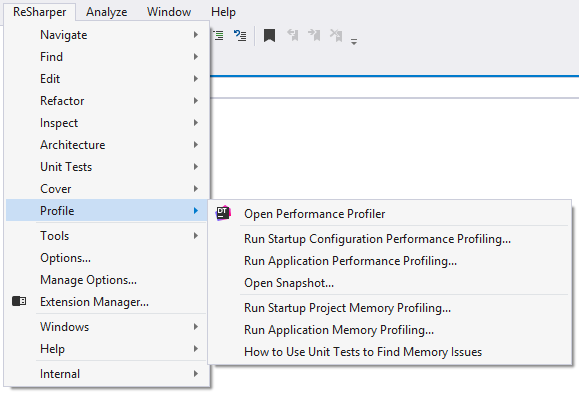
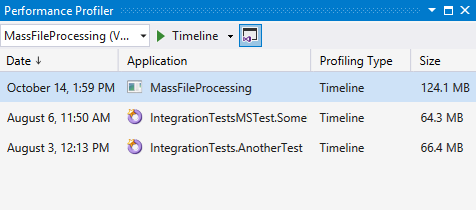
The main component of dotTrace integrated in Visual Studio is the Performance Profiler tool window which can be opened via the menu.

The details on profiling steps that can be performed with dotTrace integrated in Visual Studio are provided in the following sections:
- Starting a profiling session on a local computer.
- Working with collected snapshots.
- Analyzing Timeline Profiling Results.