Compare Snapshots
As your application evolves, you need an ability to see how code changes impact performance. For example:
inspect differences in execution time of a function before and after code optimisation
find out whether the number of function calls differs greatly in two different call stacks
dotTrace helps you keep track of such changes by comparing profiling snapshots.
To compare two snapshots
Open a snapshot you want to compare in dotTrace Viewer (snapshot A).
In Filters | Comparison, click
 Add a snapshot to comparison.
In the Open Snapshot window, choose the second snapshot for comparison (snapshot B). You can choose a snapshot from the list of available snapshots or open a snapshot
.dtpfile from disk (use the Choose from Disk button).In the Comparison filter, select Comparison.

Analyze the data:
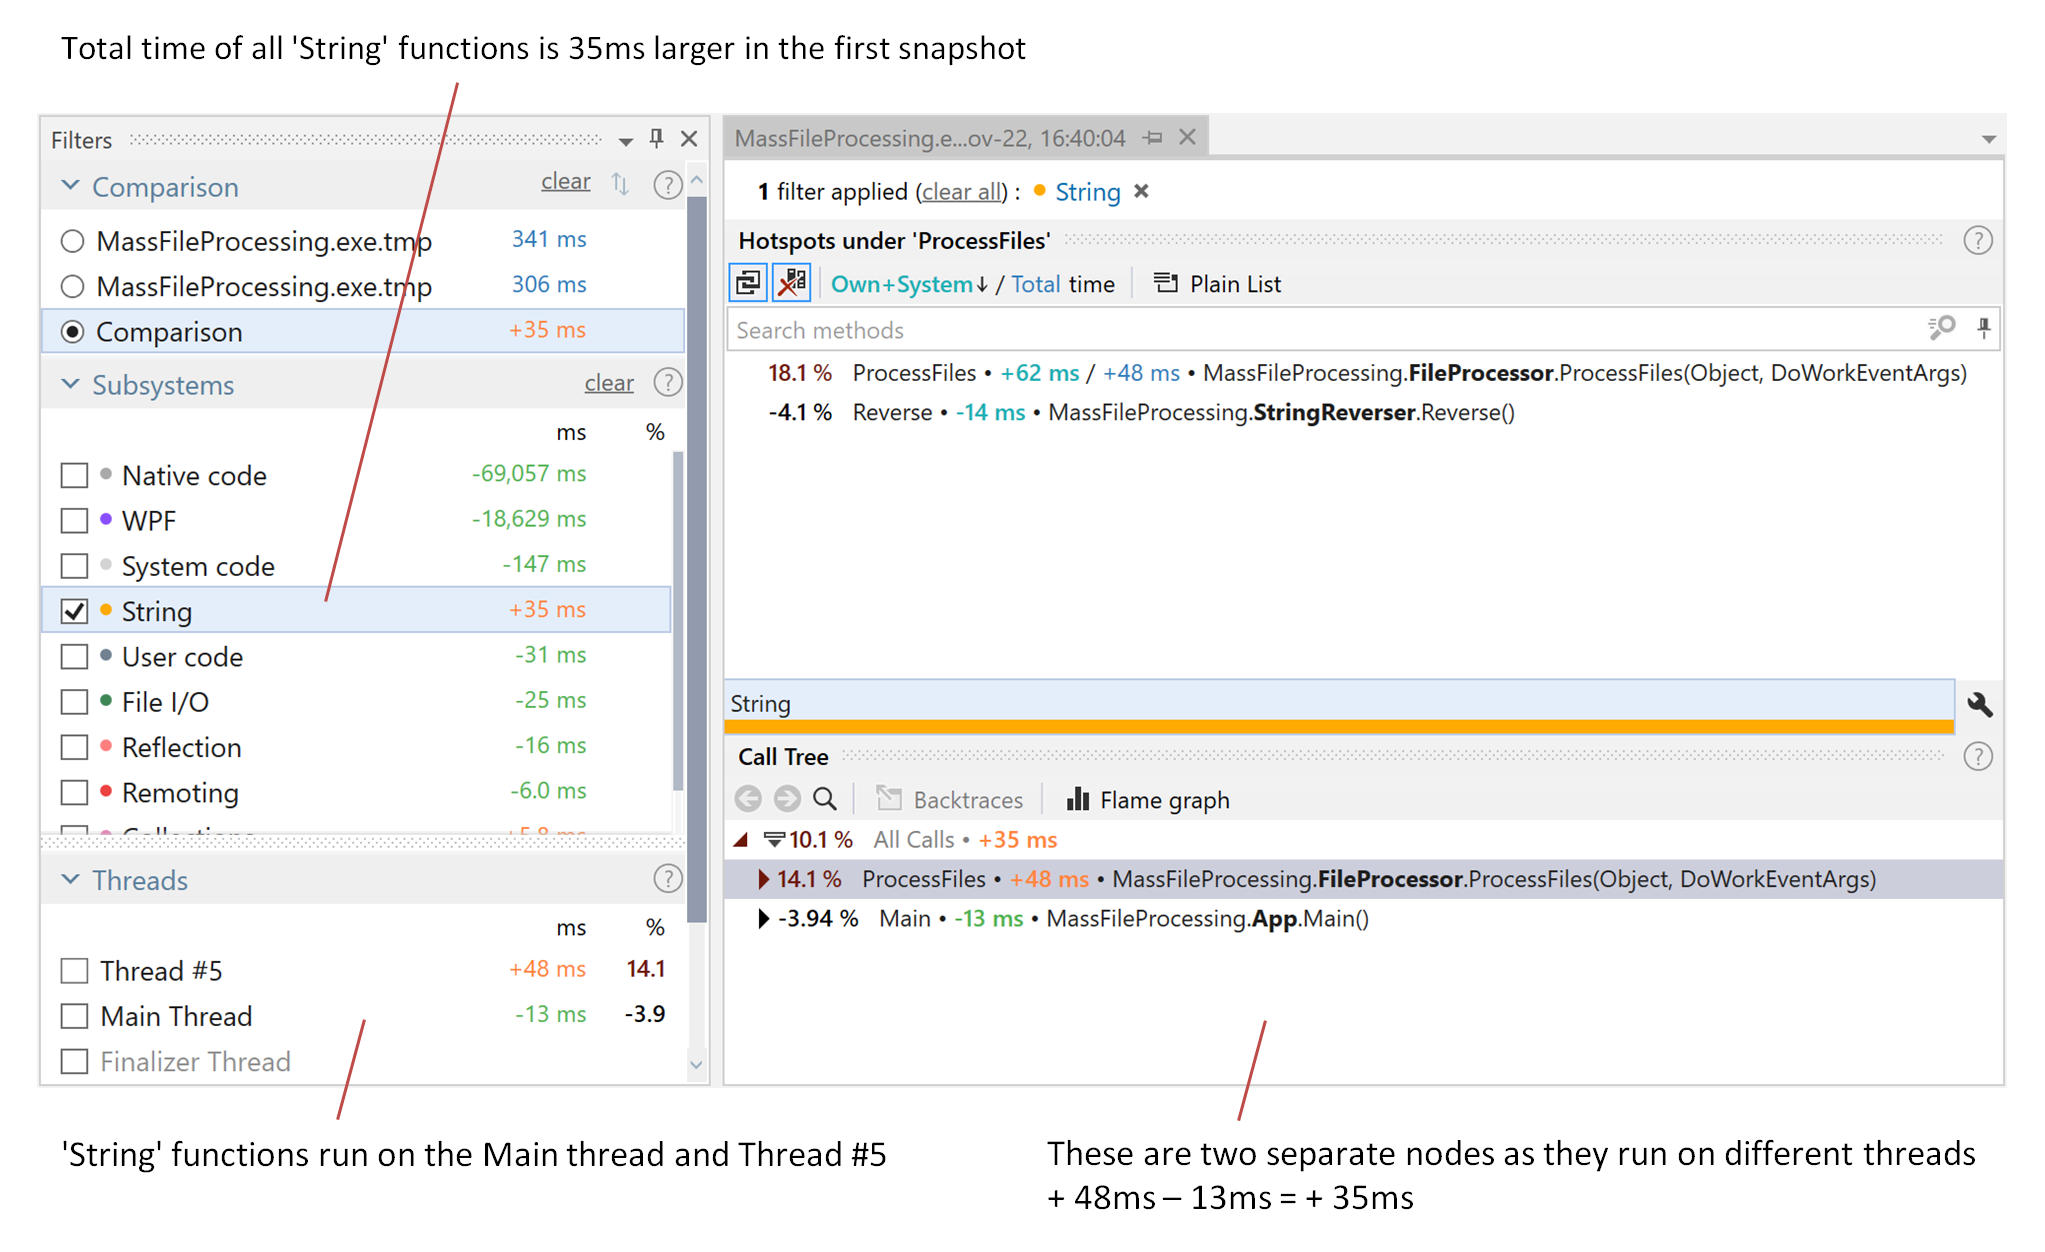
Each filter in the viewer shows time difference: Delta = A - B
Negative values shown in green represent improvement in performance.
Positive values shown in red represent deterioration of performance.
If a function exists in snapshot A but doesn't exist in B, its whole execution time is shown as a green negative value. If a function doesn't exist in snapshot A but appears in B, its time is shown as a red positive value.
If you scope to a particular call tree node in one of the snapshots, do the same in the second snapshot. Otherwise, the resulting comparison data will be hard to interpret.
All filters keep working in the comparison mode. For example, if you select a subsystem, Call Tree will show you difference in execution time only for the functions belonging to this particular subsystem.

You can swap snapshots A and B using the
 Swap snapshots button in the Comparison filter.