Source View
The Source View window shows the source code of the profiled application. After you select a method in Call Tree, Source View will automatically locate its underlying source code. To make the source code visible, you must provide dotTrace with project symbol .pdb files or specify the path to the project source code.
Unlike other dotTrace Viewer views, Source View does not work as a filter but only displays source code and time distribution for particular lines of code (Timeline on Windows only).
Source View is available only on Windows.
To open the Source View window
From the main menu, select .
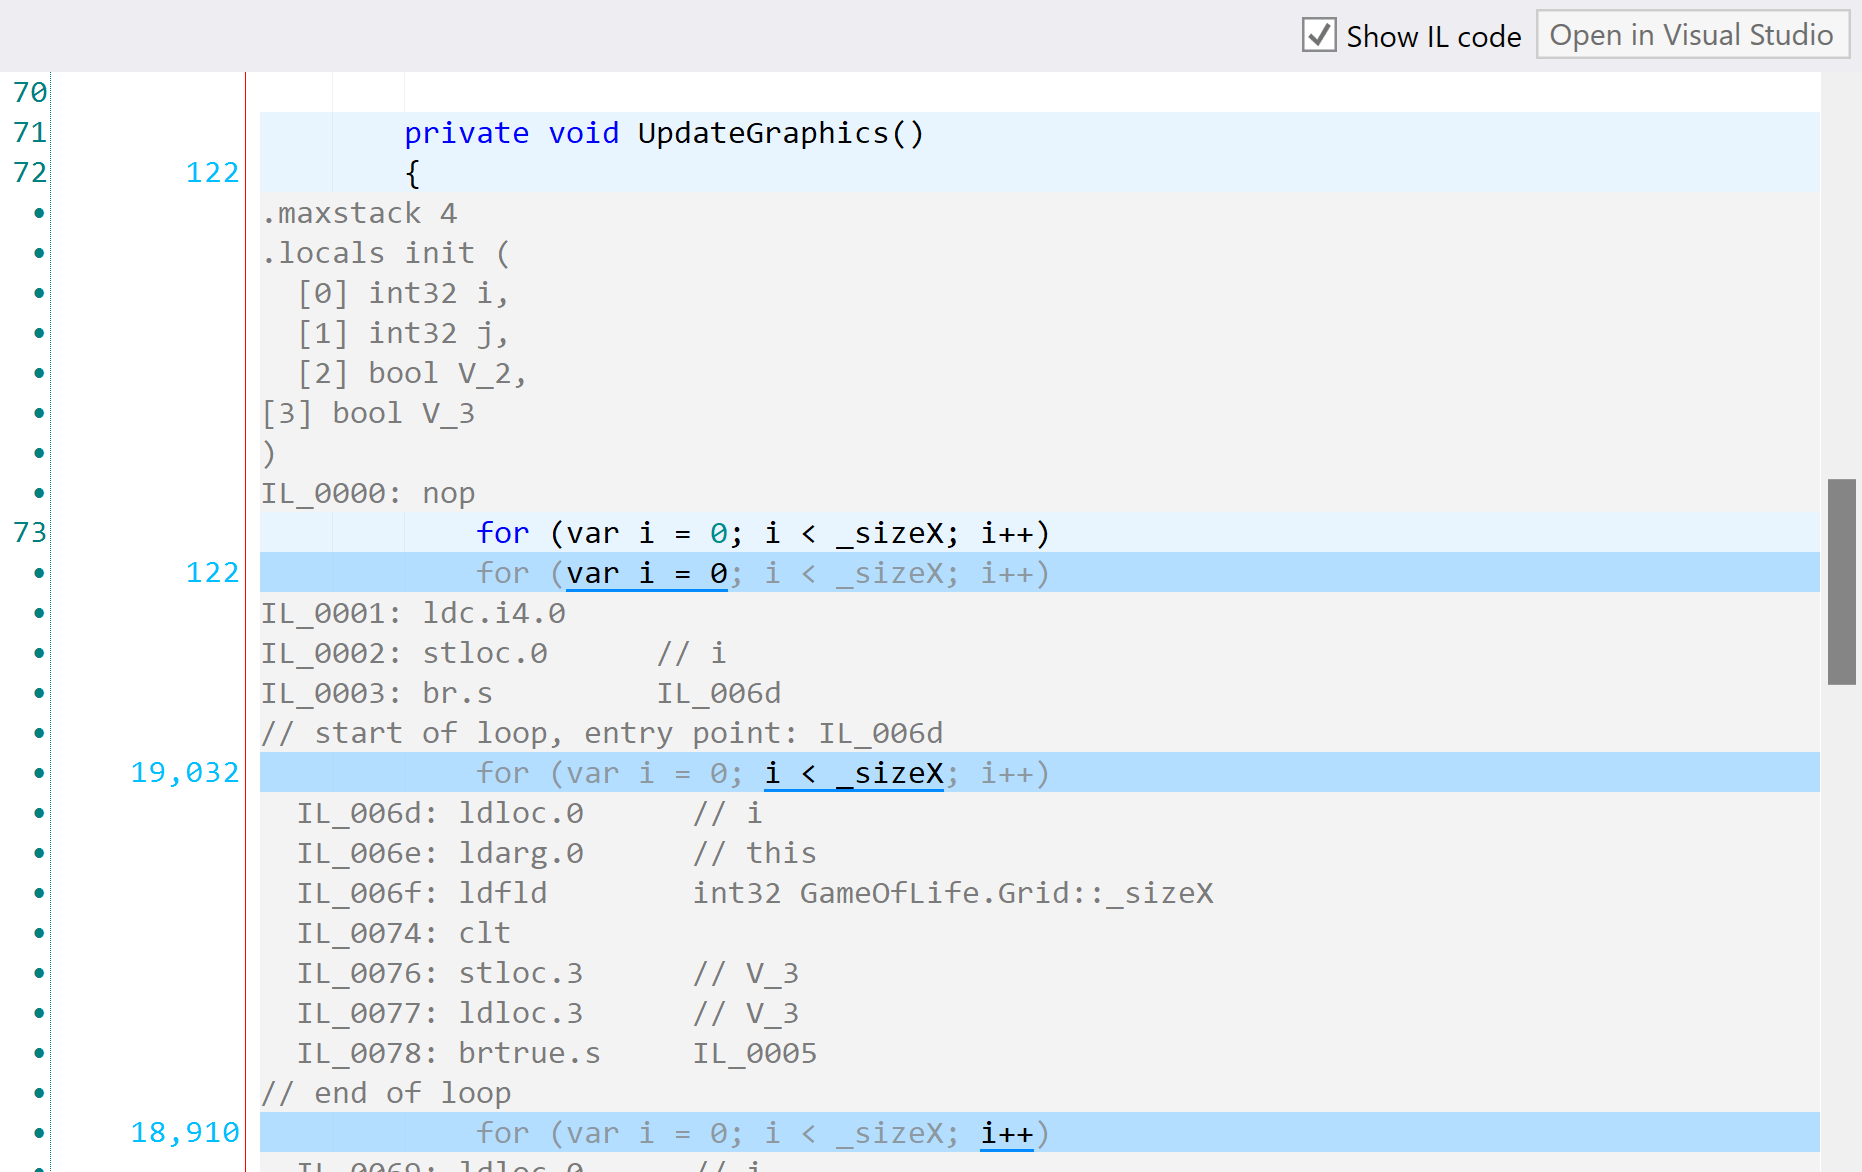
If you need to debug your code at a low level or for some other reason examine the code emitted by the compiler, you can do it right in Source View.
To view IL code
Select a method in Call Tree.
Open Source View.
Select the Show IL Code checkbox in Source View.
IL code will be displayed under each code statement.
In some cases, source code is not available, however Source View can recreate source code close to original using the built-in decompiler.
To view decompiled code
Select a method in Call Tree.
Open Source View.
Click Decompiled Source in Source View.
In order to enable code decompiling, do one of the following:
Select the I accept the terms of the license agreement, allow to decompile checkbox and click Apply.
From the main menu, select . The Options dialog opens. Select the Decompiler node on the left pane, accept the license terms, and click Save.
Configure Path to Source Code
As Source View can look for sources on local disks or network shares, you can specify a local path or UNC path.
To add a new folder substitution
From the main menu, select . The Options dialog opens.
Select Folder substitutions.
In the Folder substitutions pane, click Add. The Edit Folder Substitution dialog opens.
Enter a path to the source folder and a path to the target folder where source files are actually located. Click OK.
New substitution appears in the table. Click Save.
To specify the path to a source server
From the main menu, select . The Options dialog opens.
Select Symbol server integration.
In the Symbol server integration pane, click one of the options to enable downloading PDB and source files from one of the particular servers:
Microsoft Reference Source Server
Custom source server
Otherwise, click Don't use symbol server.
Click Save.
Alternatively, you can specify the path to .pdb or source files right from Source View with the Browse for PDB button to find the desired file on your computer manually.
Navigate from Source View to Visual Studio
You can navigate right to the source code in Visual Studio from dotTrace Viewer.
To navigate from Source View to the source code in Visual Studio
Select a method in Call Tree.
Open Source View.
Click Open in Visual Studio in Source View.
Source View and line-by-line profiling
Depending on the chosen profiling mode, Source View may look different. With line-by-line profiling, performance analysis is available for some functions in Source View.

If a statement consists of several statements, each of them is displayed on a separate line and highlighted with a blue line. On the left side you can see:
Numbers that indicate how many times a particular statement was invoked during line-by-line profiling.
Bars that indicate how much time was spent executing a particular statement.
If you make IL code visible, a grey block of IL code is displayed under each statement for the selected method.
