Analyze Profiling Results in Performance Viewer (Deprecated)
Deprecation of Performance Viewer
Before the 2022.3 release, sampling, tracing, and line-by-line performance snapshots had to be opened in the legacy Performance Viewer, while timeline snapshots were opened in a more modern Timeline Viewer. This worsened the overall user experience since the two viewers have different user interfaces and approaches to snapshot analysis.
In dotTrace 2022.3, we got rid of Performance Viewer in favor of dotTrace Viewer (former Timeline Viewer). dotTrace uses it to open snapshots of all types. Nevertheless, if you want to continue using the discarded Performance Viewer in dotTrace 2022.3, you still have such an option.

Here are the main differences between dotTrace Viewer and the deprecated Performance Viewer.
- Start of analysis
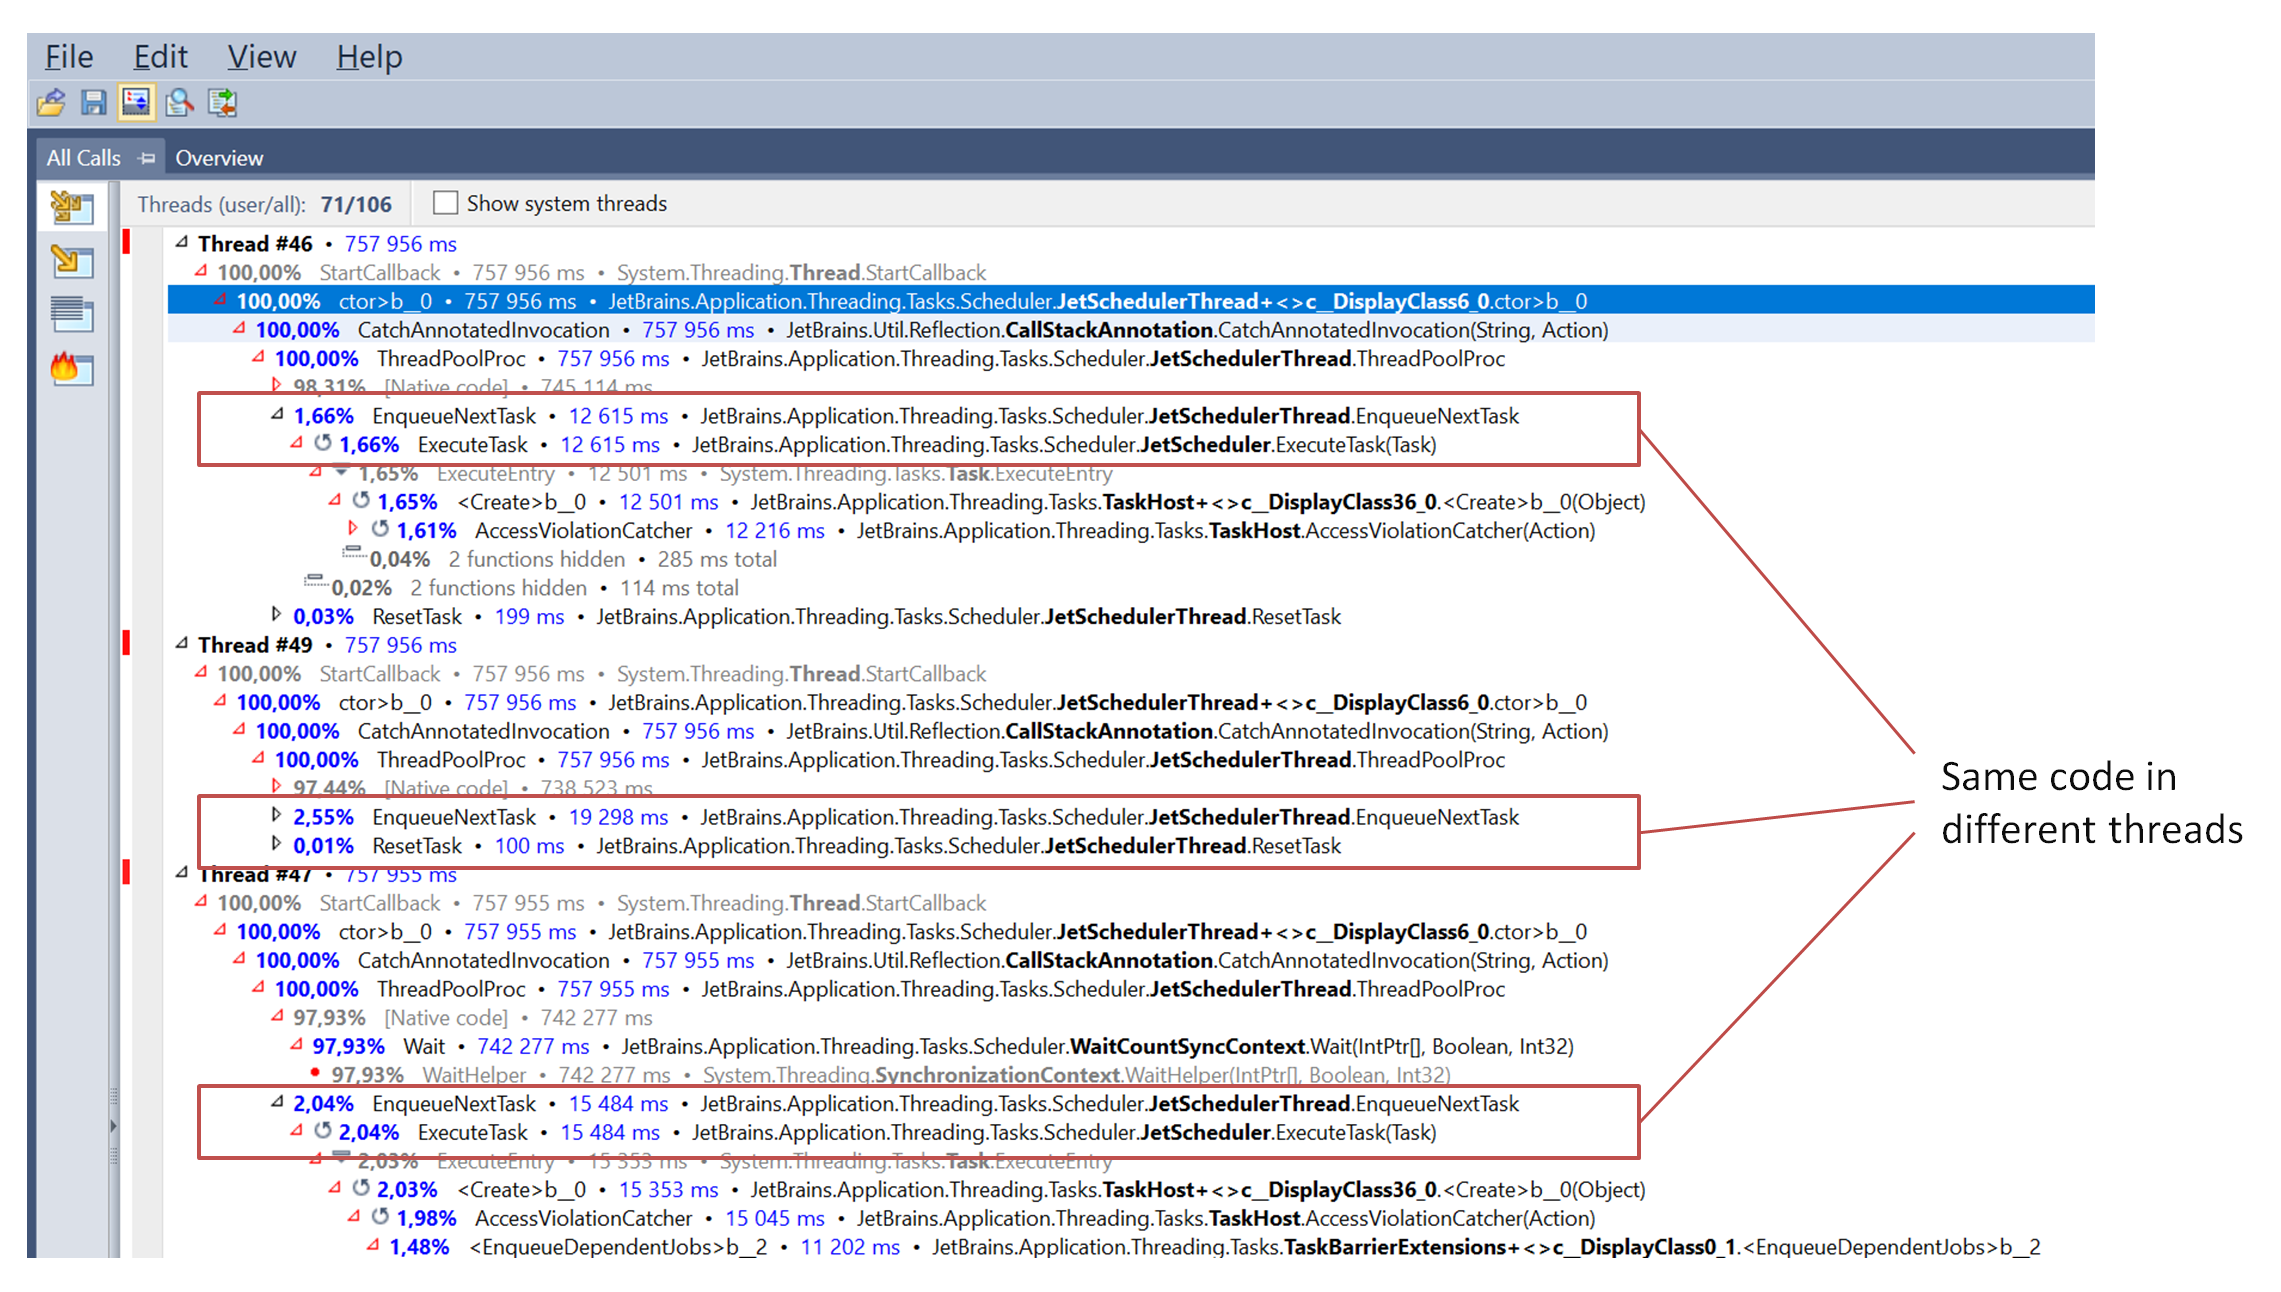
In Performance Viewer, you start your analysis with the Threads or with the Call Tree view. The main problem with the Threads view is that it doesn't allow merging method calls. Suppose your application runs the same code (method) in different threads. In Performance Viewer, you have to open all threads one by one probably without even realizing they are running the same code.
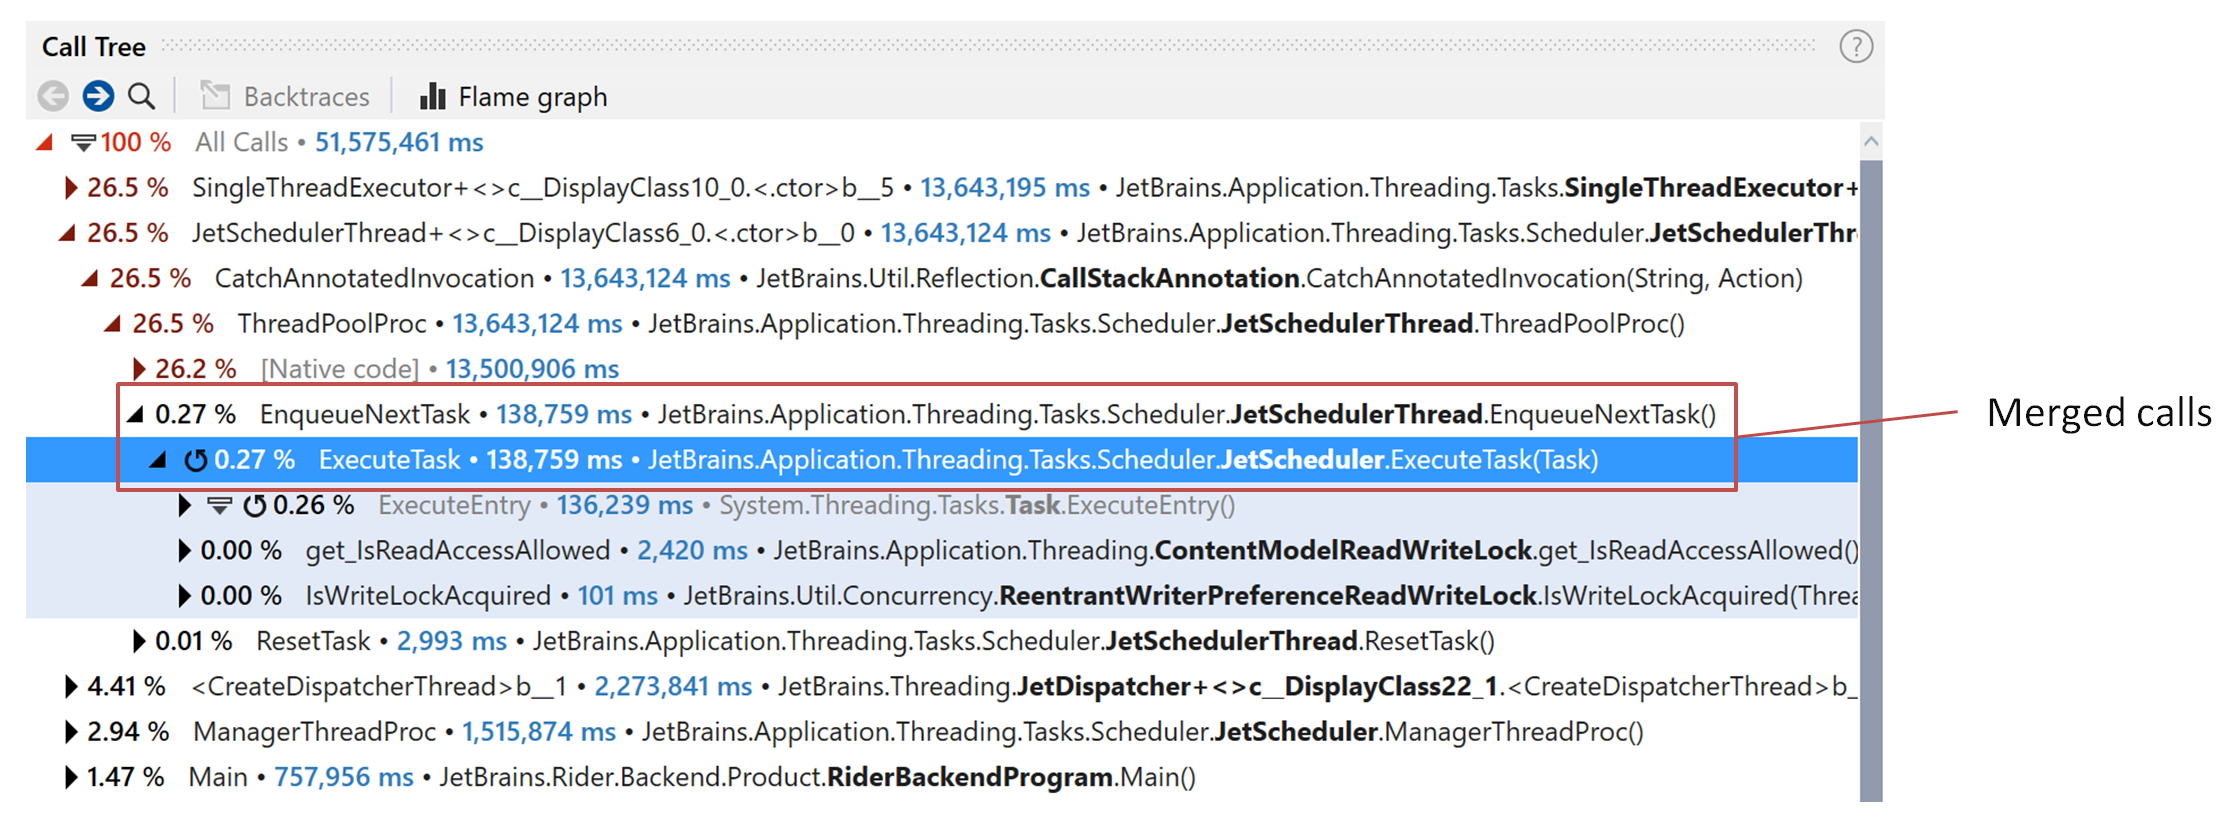
In dotTrace Viewer, your starting point is Call Tree. Unlike Performance Viewer, it shows you merged calls from all threads.
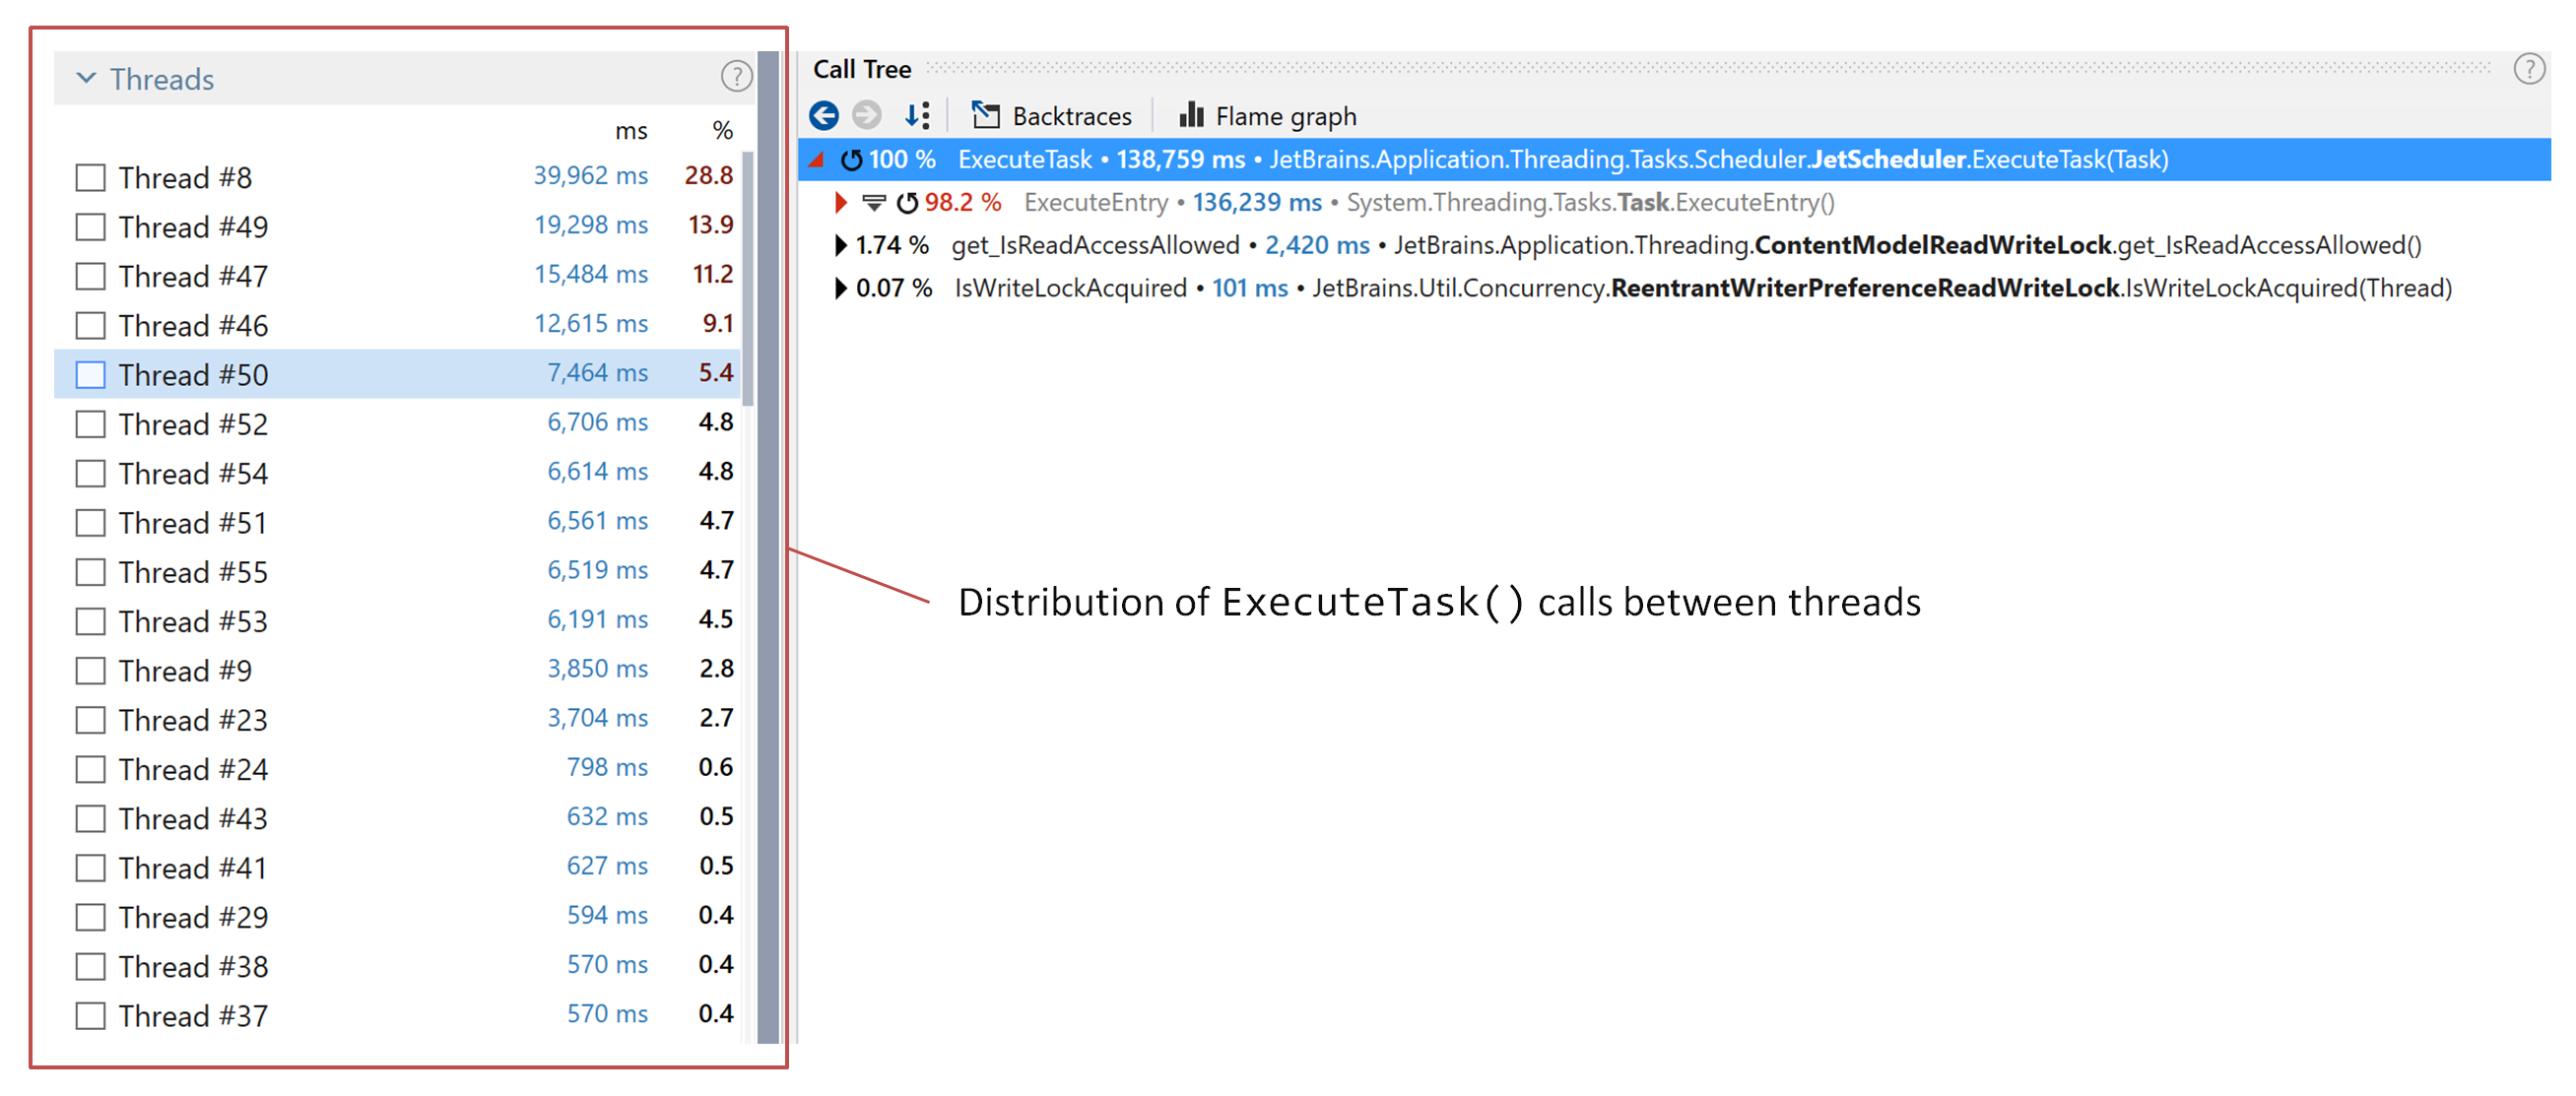
In dotTrace Viewer, the Threads list is a filter that not only lets you select particular threads for analysis but also shows data depending on other filters. For example, after you scope to a specific method, Threads will show you how method calls were distributed between different threads.
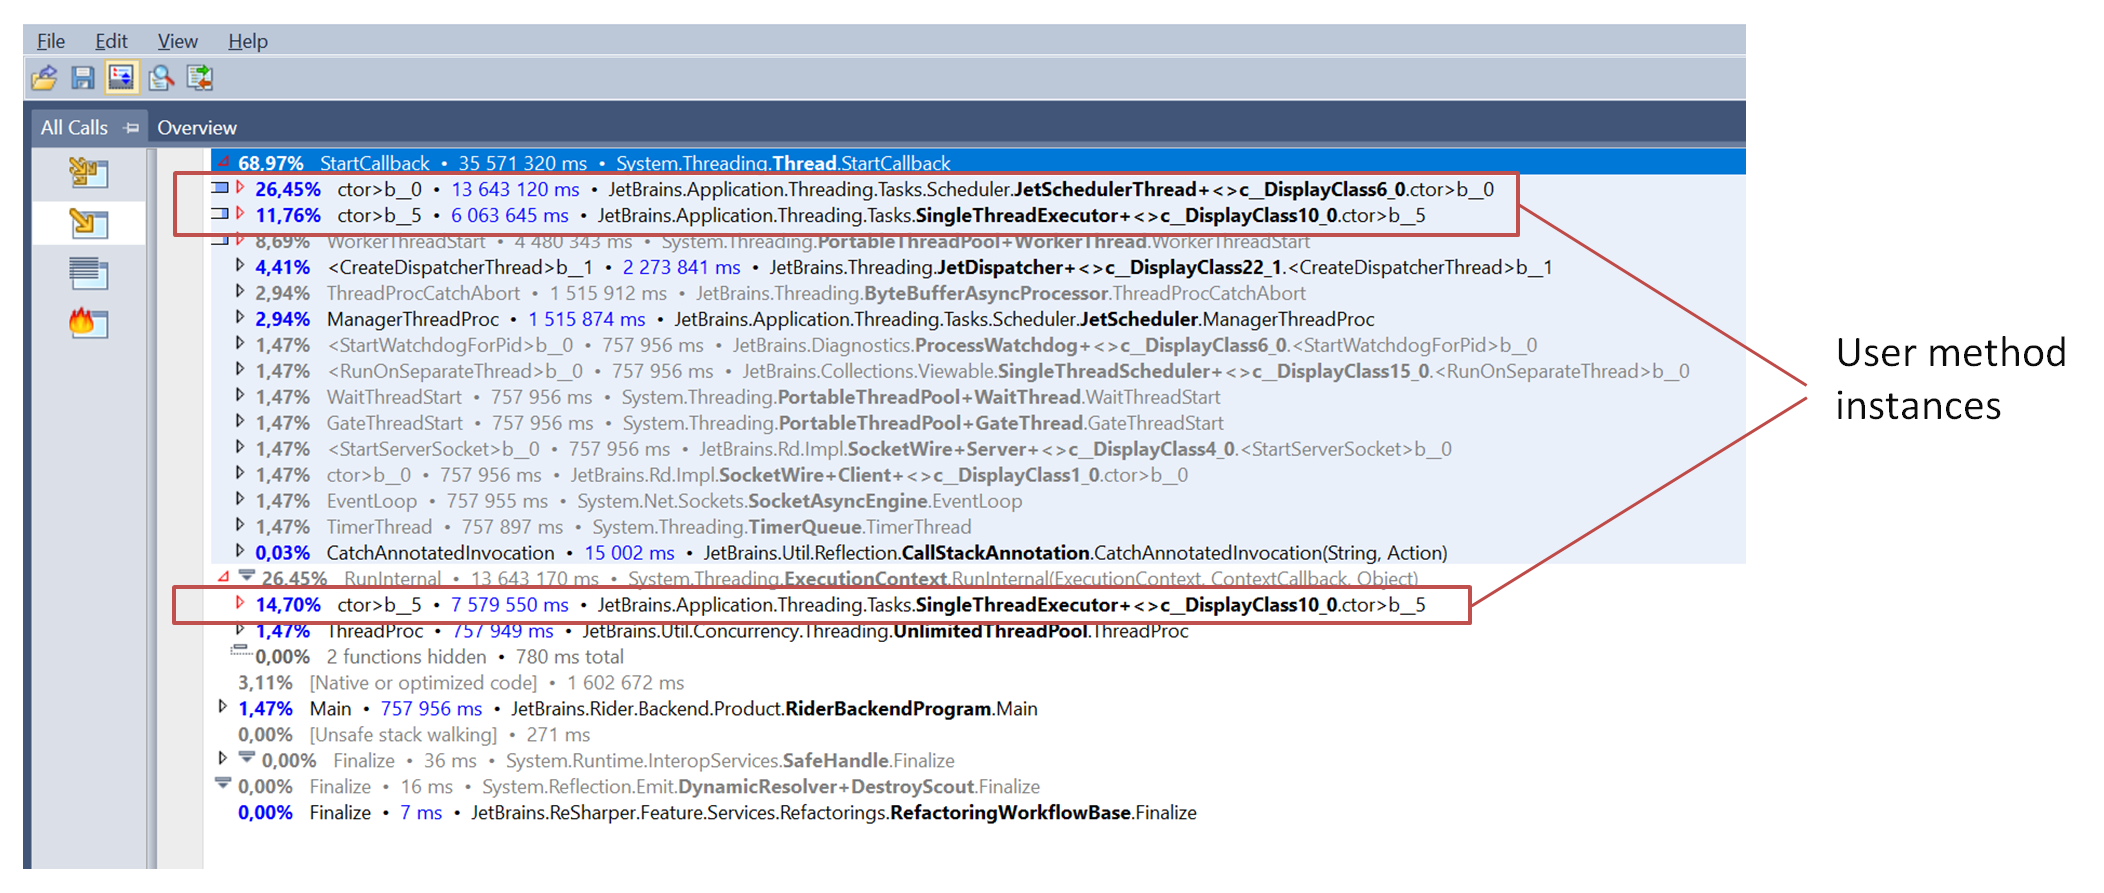
The Call Tree view in Performance Viewer has the same problem as the Threads view. The data is shown as it is – the view neither merges user calls nor groups the system calls. When you start, the tree is always a bunch of system calls on top with user calls hidden inside.

After you start digging into the tree, you'll find user methods you may be interested in. The problem is that these are separate call instances.
Compare to what you see in dotTrace Viewer – merged calls of user methods shown on top and no system calls at all. The system calls are hidden due to the system call folding.
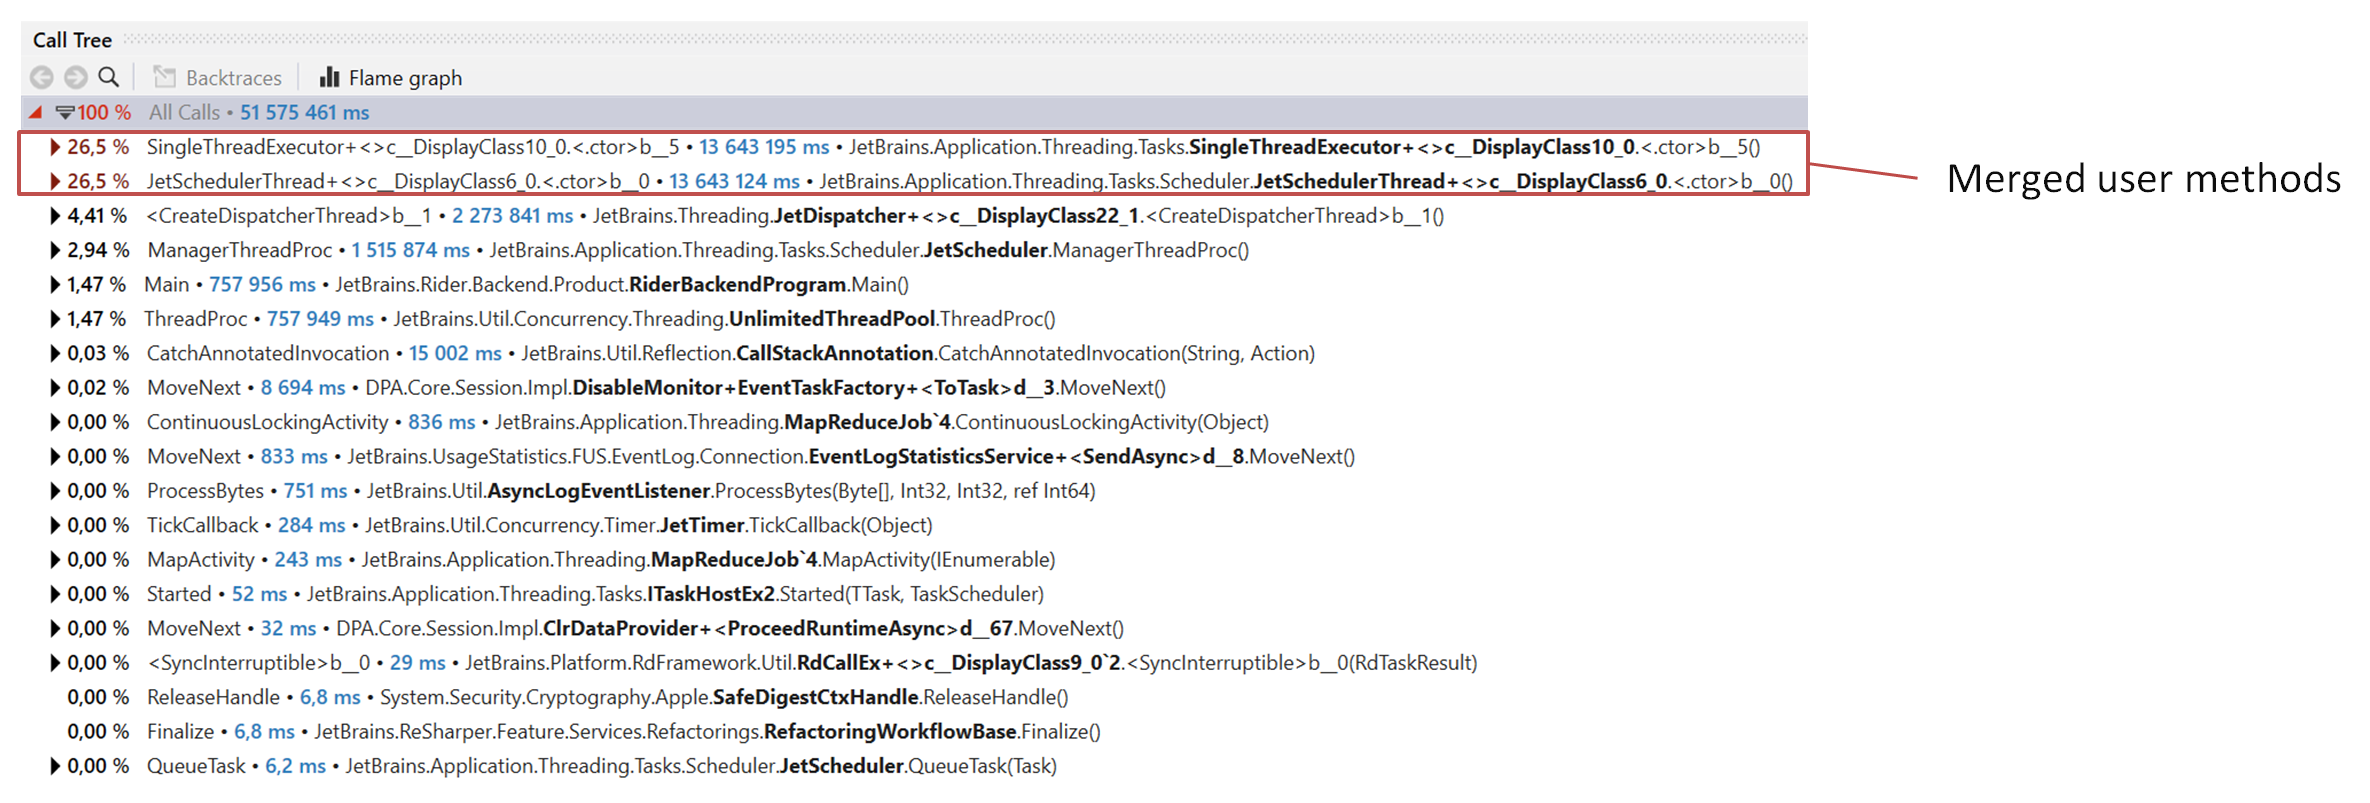
If required, you can unfold system calls to get a picture similar to the one in Performance Viewer. This will show the call tree as it is – with system calls and instances of user calls on their places:
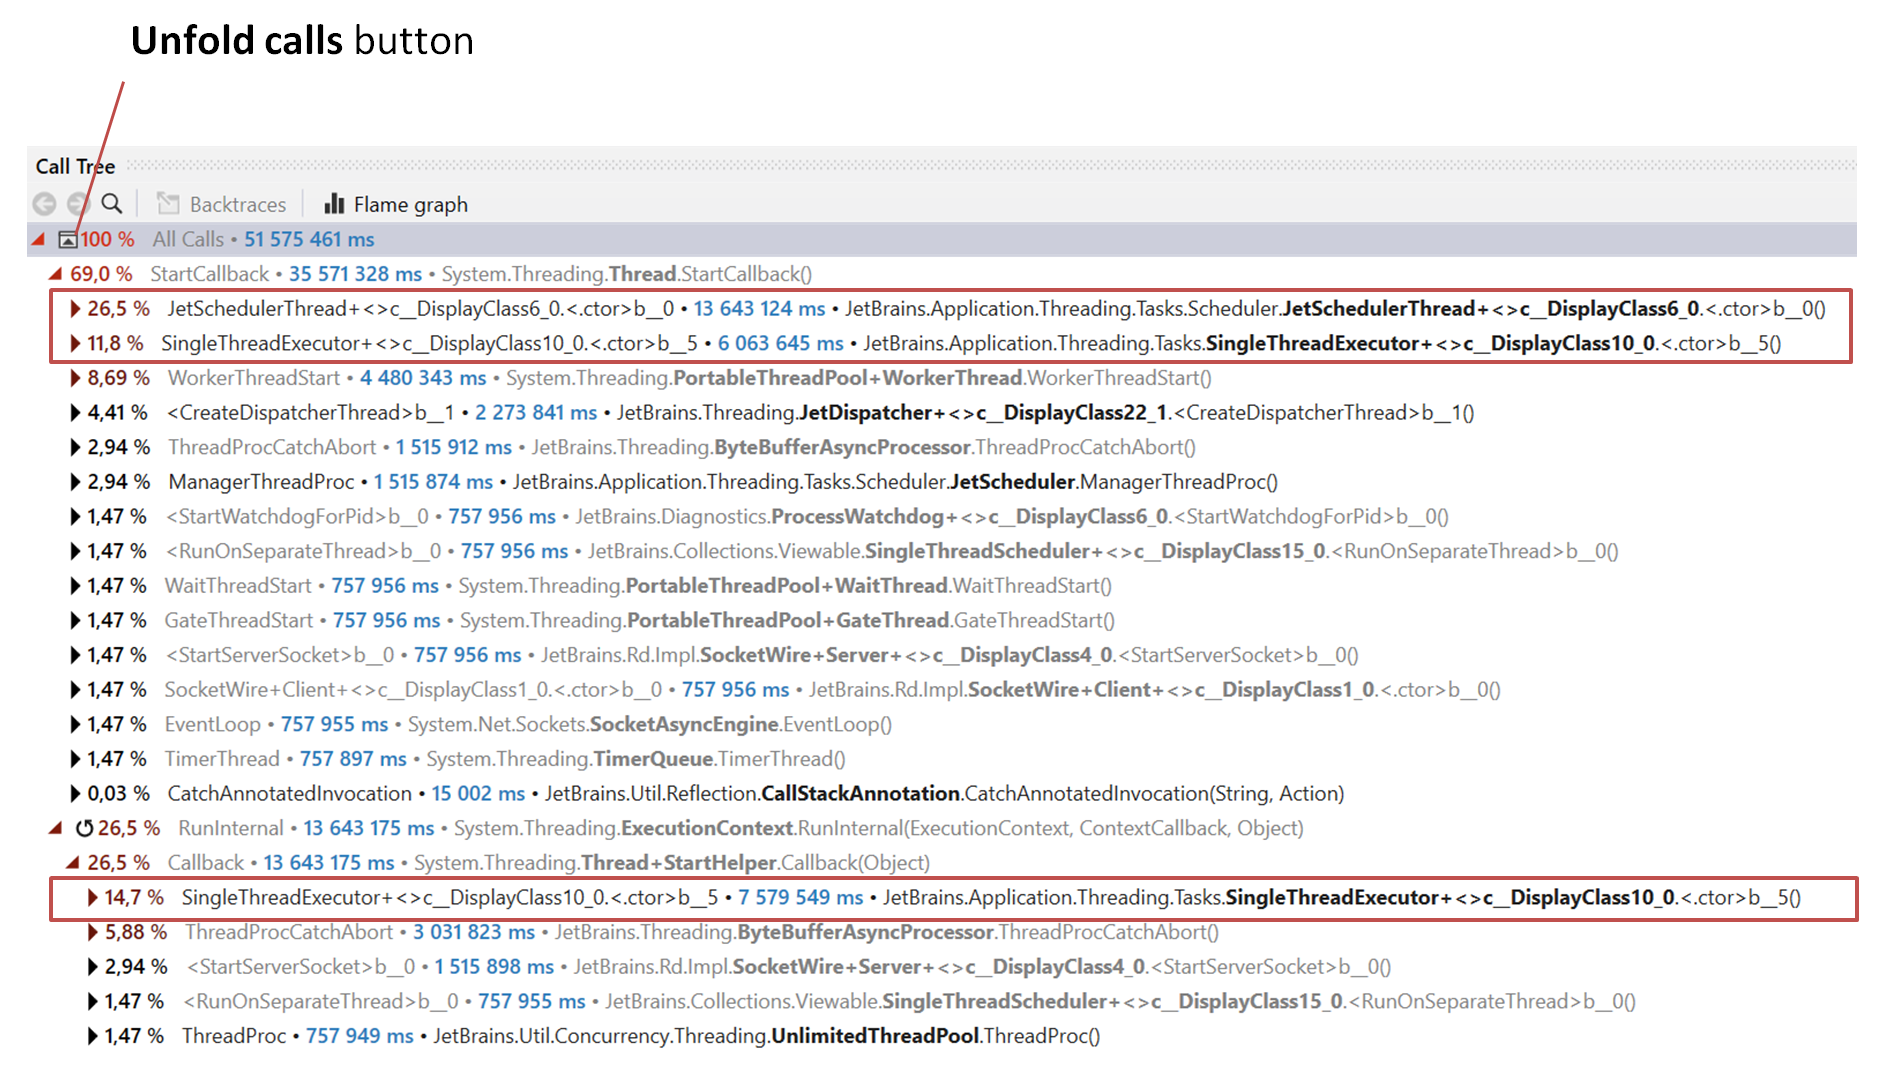
All in all, the main difficulty when using Performance Viewer is the starting point. It's not obvious where you should begin performance analysis. In dotTrace Viewer, you can always start with Call Tree and scope to a suspicious method. With high probability, the top five methods in Hotspots are what you're looking for.
- Data analysis
dotTrace Viewer offers you OLAP approach to snapshot analysis – every view not only shows you some data but also works as a filter for other views. By applying these filters, you can slice the snapshot in various dimensions.
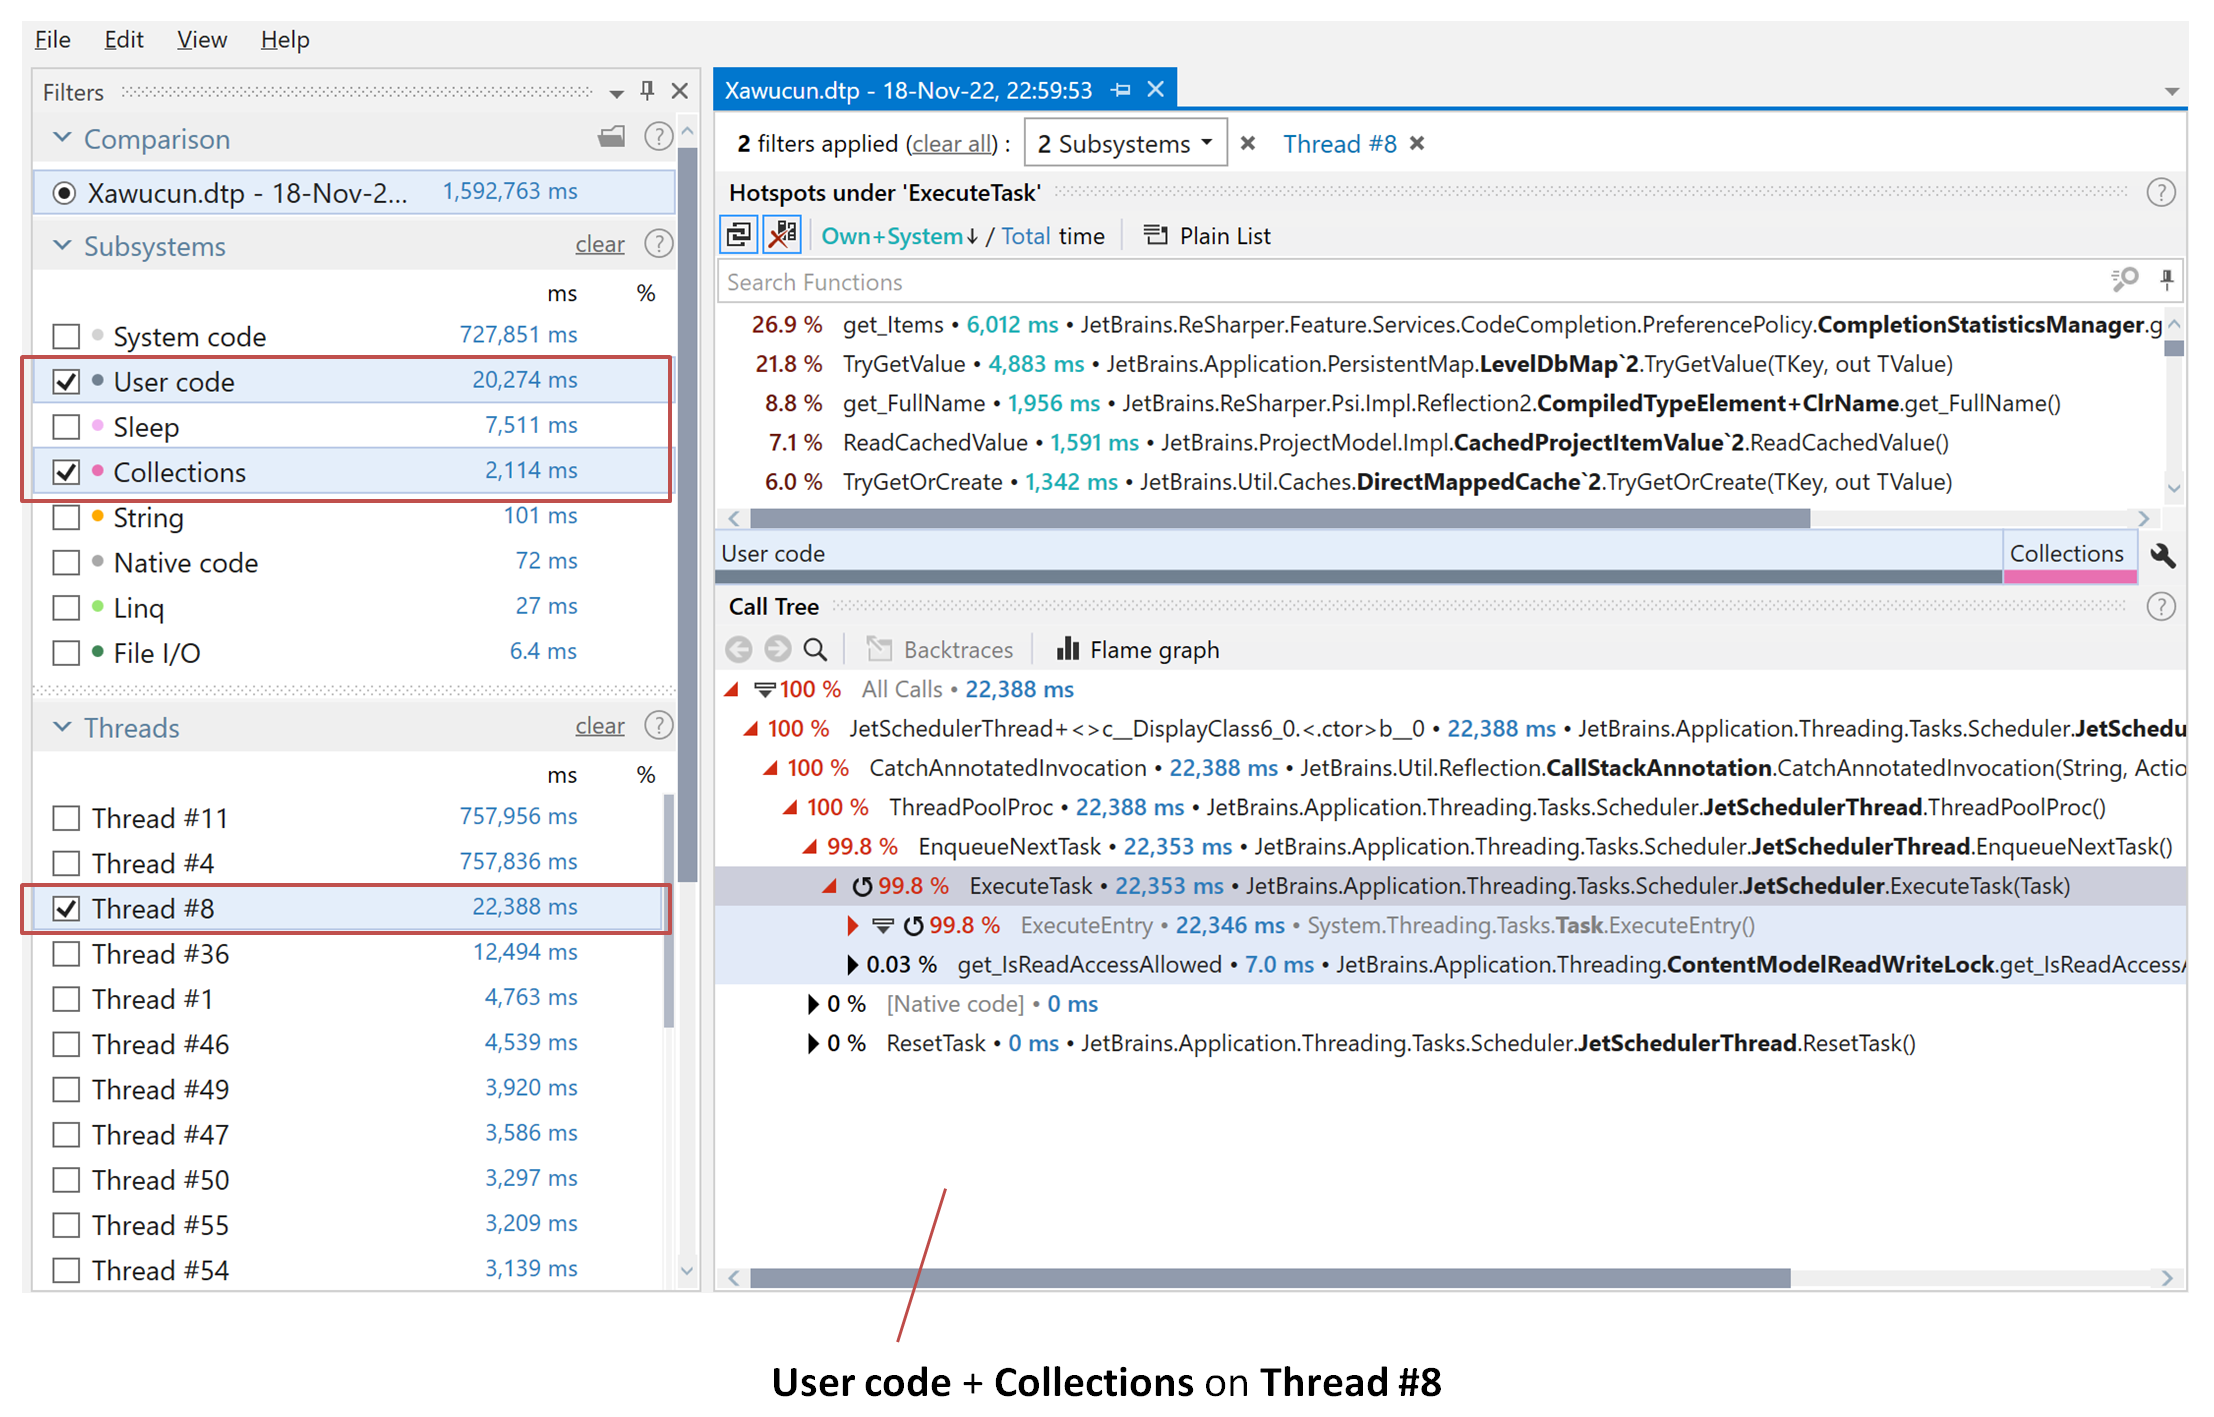
Performance Viewer shows you almost raw call stack data. Though there are cases where this approach might be preferable, filters in dotTrace Viewer provide incredible variability for analyzing data from different angles.
- Thread complexity analysis
Performance Viewer automatically calculates tree complexity for each thread and sorts threads in the Threads view based on this parameter. This sorting lets you quickly understand which threads are doing most work and are interesting for analysis.
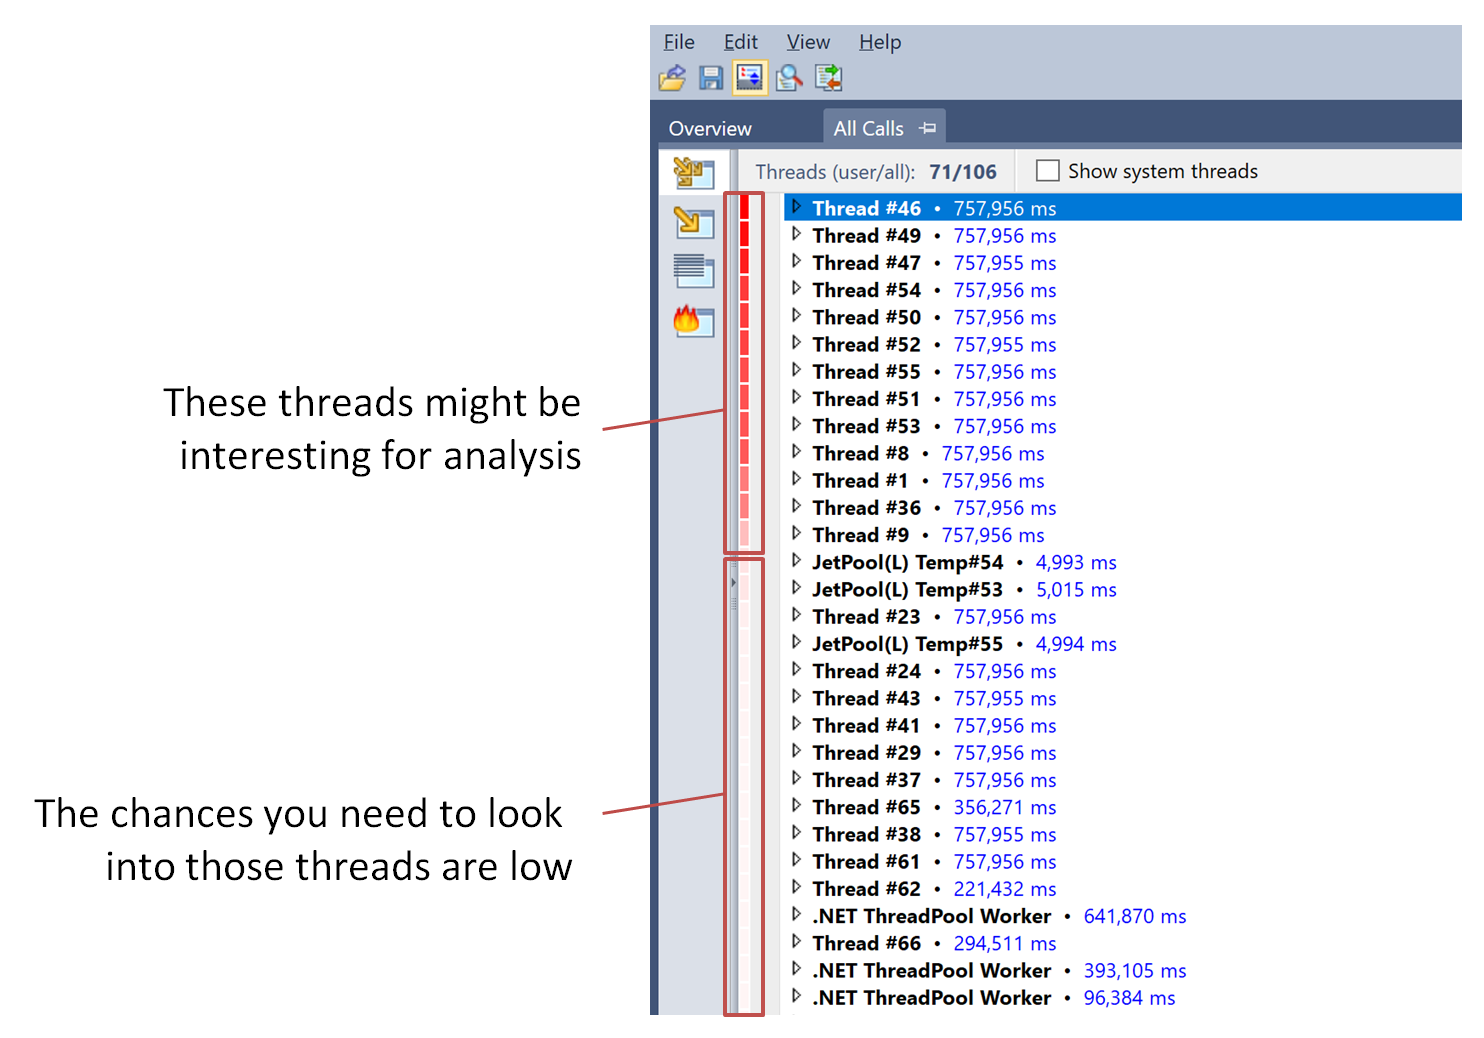
Currently, dotTrace Viewer doesn't provide such thread analysis, but we plan to support it in the future.
- Subsystems
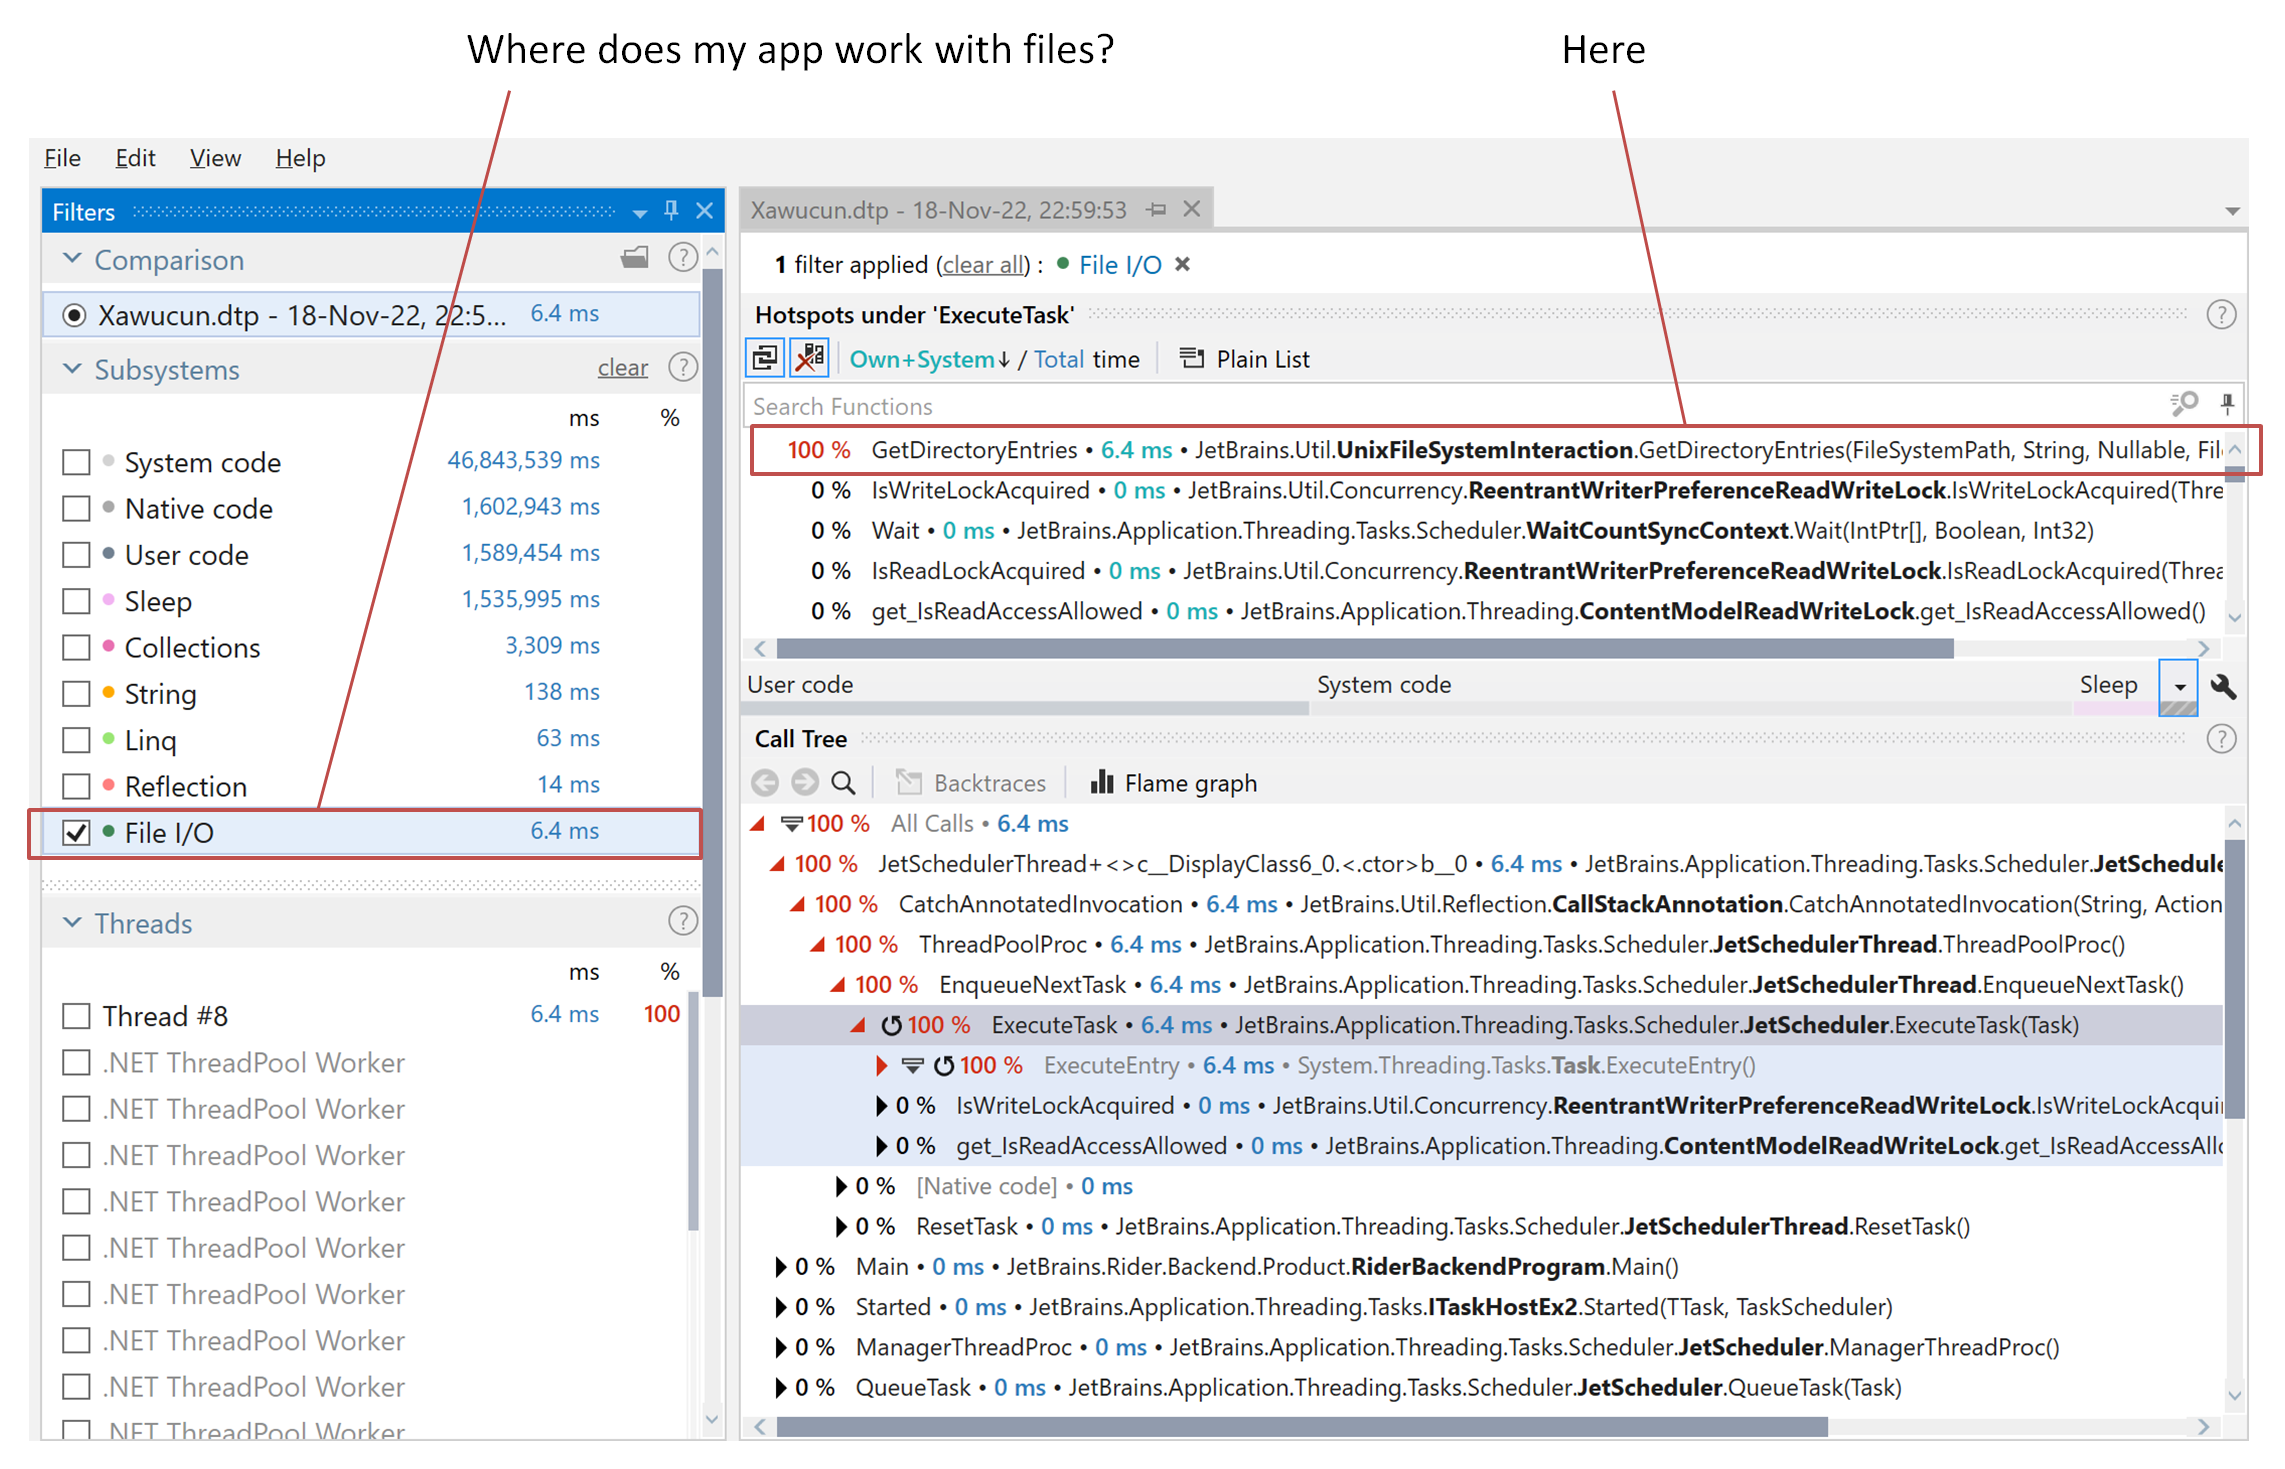
Due to the OLAP approach, subsystems in dotTrace Viewer are fully-functional filters as any others. You can choose a particular subsystem, and other views will show the filtered data, e.g., Call Tree will show only the parts of the call stack with methods belonging to the selected subsystem.
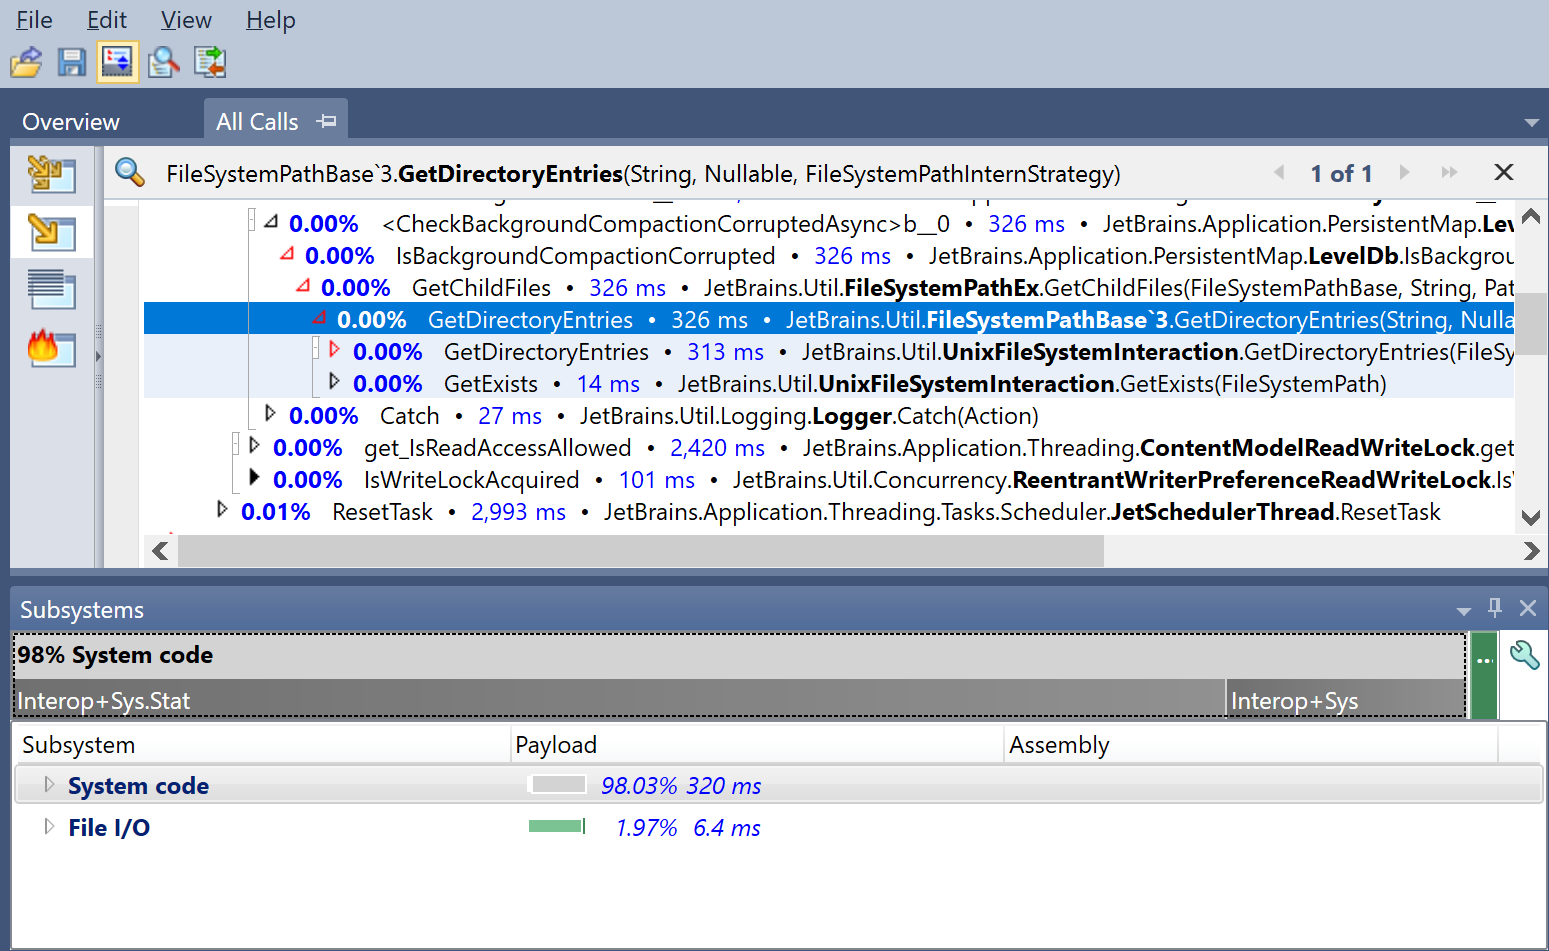
In Performance Viewer, subsystems are static entities. They only show time distribution between subsystems for the selected call tree.
- Tabs and the analysis state
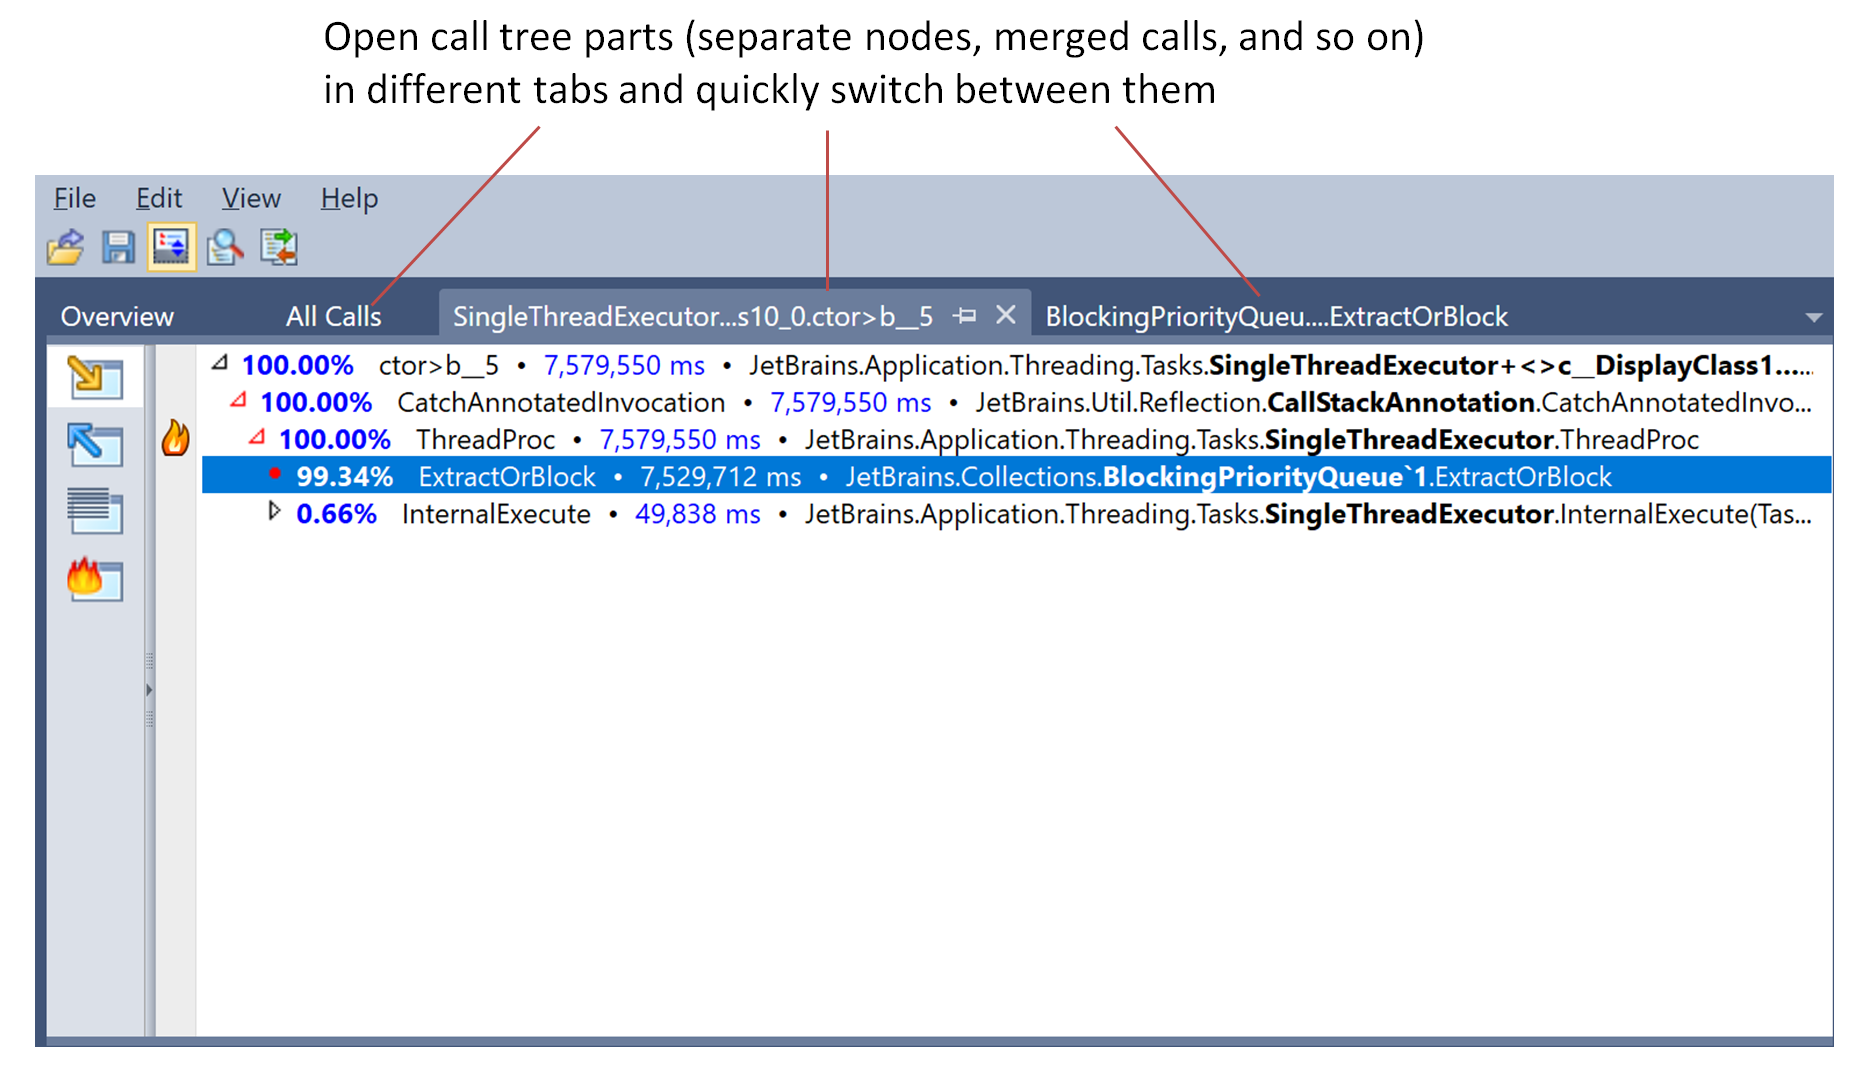
One of the strongest features of Performance Viewer is its ability to open particular parts of the call tree in separate tabs. This is helpful if you want to look at some suspicious part of the tree and then return to your analysis without losing the focus.
In dotTrace Viewer, the state of the analysis is determined by the set of currently enabled filters. Once you add or remove a filter, the state changes. In future dotTrace versions, we will add the ability to save the current state using tabs.
Introduction to Performance Viewer
When an application runs too slowly, it can be difficult to locate a problem and understand which action to take. Thus, the next step after profiling an application and getting a performance snapshot is analyzing snapshot data.
The analysis is performed in Performance Viewer - a set of views which give you different perspectives on the collected data. The viewer is run automatically after you collect a performance snapshot.
Snapshot analysis is a hardly formalized process, therefore, you will not find any step-by-step guidance in this chapter. Nevertheless, it will give you an overview of all basic operations essential for performance analysis:
In addition the chapter contains useful tips on how not to get lost in huge amount of snapshot data: