Preview Source Code
dotTrace automatically locates the underlying source code for selected functions. To make the source code visible in dotTrace, let it know where .pdb files for your project are located, or specify path to the source code.
Note that in case you choose the Line-by-Line profiling type, Source View will show additional information about how many times a particular line of code was invoked. Learn more in Source View and Line-by-Line Profiling.
To view source code
From the menu, choose .

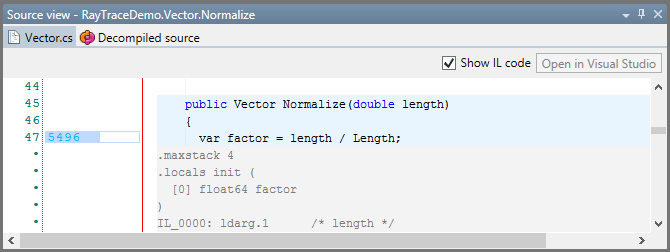
If you need to debug your code at a low level or for some other reason examine the code emitted by the compiler, you can easily do it right in Source View.
To view IL code
Select a function.
Select the Show IL Code checkbox in Source View.
IL code is displayed under each code statement.

Sometimes source code is not available right here right now, however dotTrace can recreate source code close to original using a built-in decompiler.
To view decompiled code
Select a function.
Click Decompiled Source in Source View.
In order to enable code decompiling, do one of the following:
Select the I accept the terms of the license agreement, allow to decompile checkbox and click Apply.
From the menu, choose . The Options dialog opens. Select the Decompiler node on the left pane. Select the I accept the terms of the license agreement, allow to decompile checkbox in the right pane, then click Save to apply changes.
The corresponding decompiled code is immediately displayed.