Insights
Insights let you examine aggregated data on organizational and team levels in Qodana Cloud. This feature is available under the Ultimate Plus license.
To view insights on an organization level, in the upper part of your organization page click the Insights button. To do the same on a team level, click this button on your team page.

Dashboard filters
The upper part of the Insights page contains filters that let you filter widgets by projects, severities, baseline, and inspections.
After you configure all the widgets, you can copy the link to the page that contains this configuration state.

Available widgets
Projects
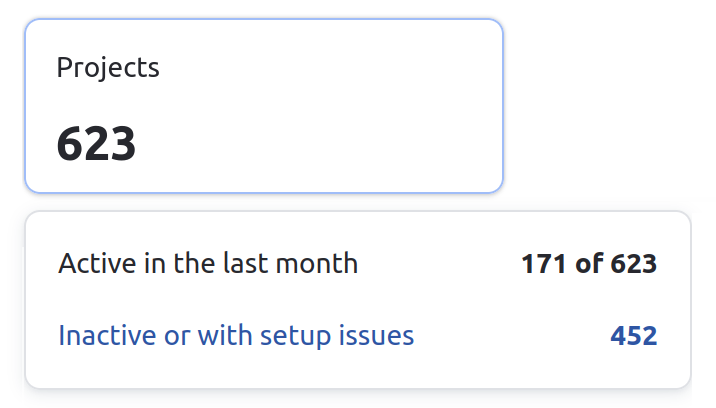
Displays the number of active and inactive projects in your organization.
Active are the projects which reports were uploaded to Qodana Cloud within 90 days. A project is classified as inactive in case it contains sanity problems or its reports are older than 90 days.
If you hover over this widget, you can see the number of active and inactive projects. Here, you can click the line describing inactive projects to navigate to a comprehensive list these projects.
Scans
This widget provides information about analyses performed on your projects excluding pull or merge requests and carried out by Qodana versions 2024.2 or later.
Average code coverage rate
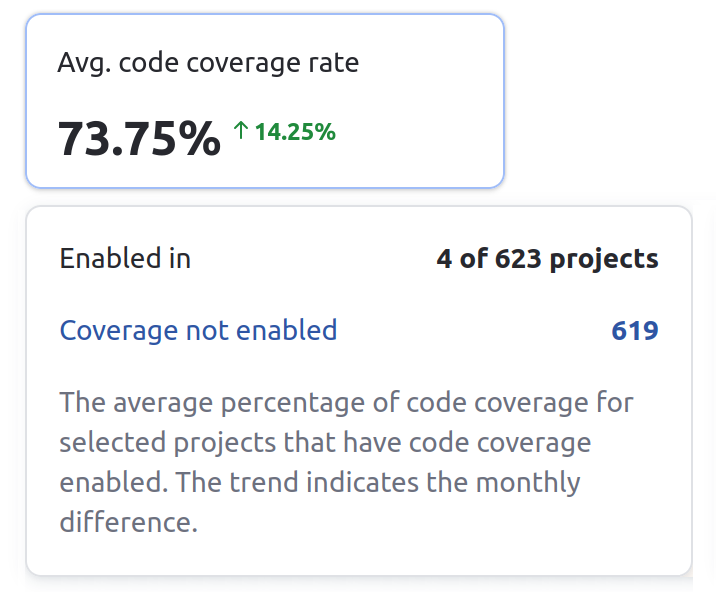
Indicates the extent to which your projects are covered with tests, calculated using the code coverage feature, and lets you navigate to the projects with disabled code coverage.
If you hover over the widget, you can view the number of projects covered and not covered with tests and navigate to the respective projects.
Average license audit rate
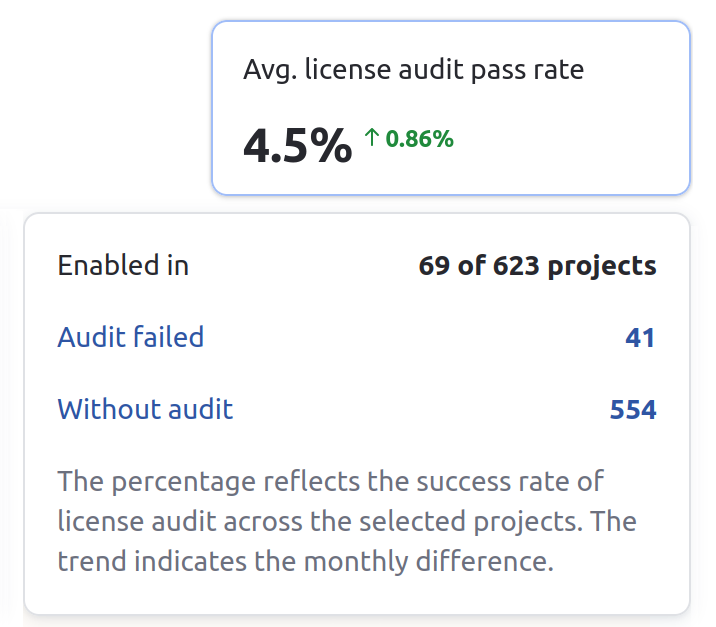
Indicates the percentage of projects that passed the codebase analysis using the license audit feature.
If you hover over the widget, you can navigate to the projects where license audit failed or was not enabled, and view related analysis reports.
Problems by severity
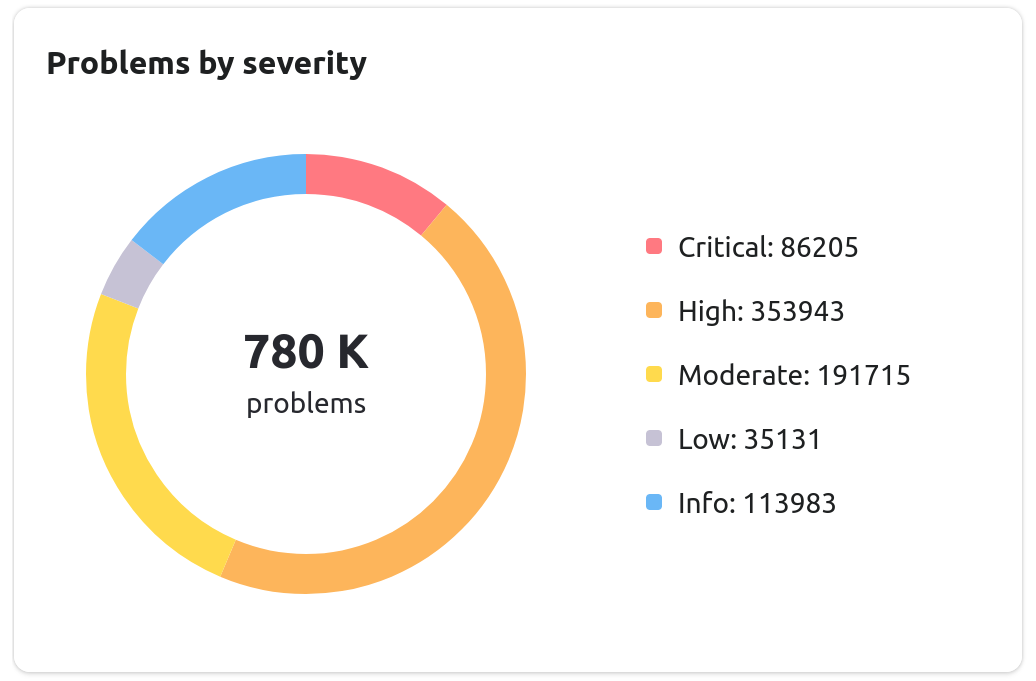
Contains the diagram showing the problem numbers by their severities, see the description of severities for details.
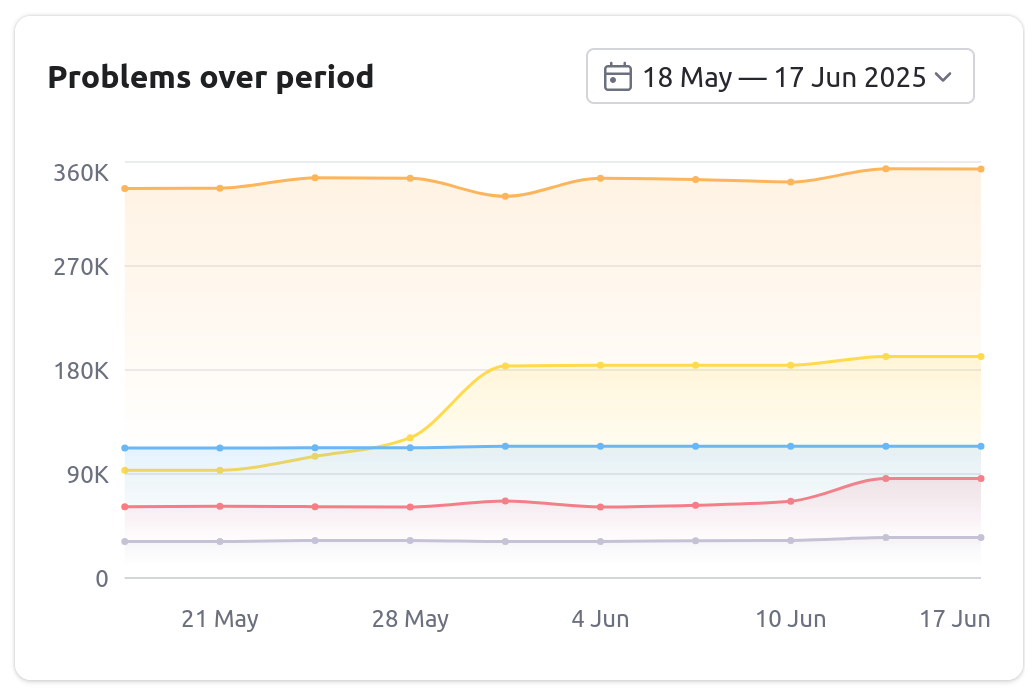
Problems over a specific period
Shows the number of problems detected in your projects for a specific time period. Using this diagram, you can see the progress in code quality.
Projects sorted
In the lower-left part of the Insights page, you can filter your projects by the number of problems, number of critical problems, as well as code coverage.
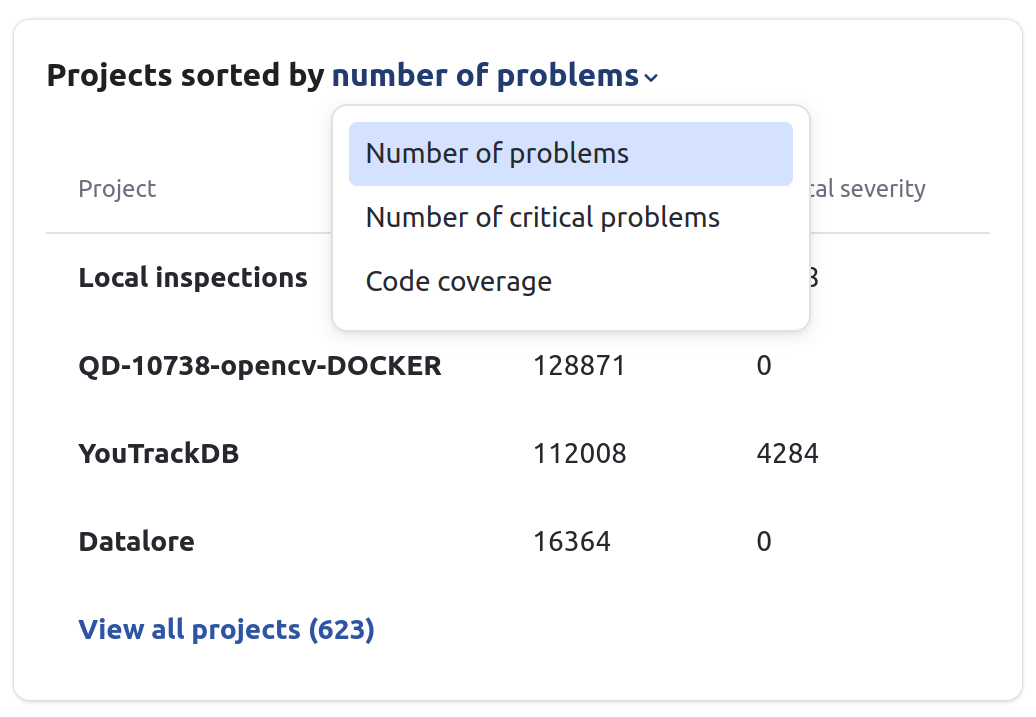
By clicking a specific project entry, you can navigate to a project page.
Problems sorted
In the lower part of the Insights page, you can sort problems detected in your projects by severity and occurrence.
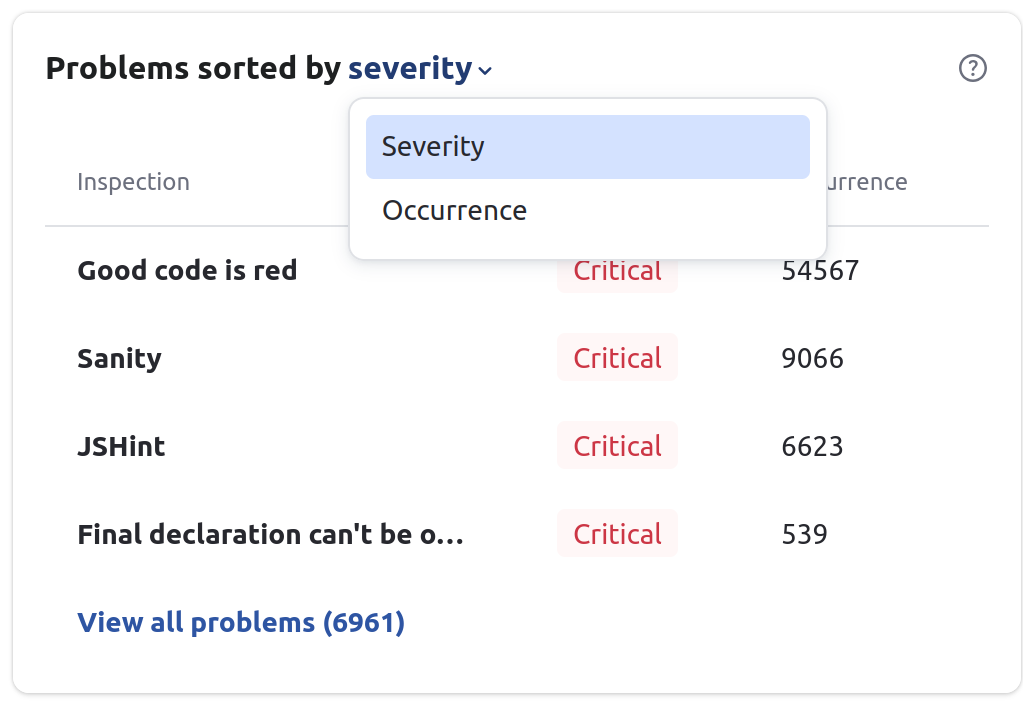
To view all projects containing a specific problem, click a problem in this widget. To search a problem by its name, in the lower part of the widget click View all problems and use the search field.