Find code issues in specific scope
Design-time code inspection is a great help when you are coding in the editor or reviewing specific files. However, JetBrains Rider also allows you to run static code analysis in the whole solution or narrower scope and examine the results in a friendly view.
Start code inspection
Inspect code in solution, project or in a custom scope
Decide whether you want the results of the solution-wide inspections (for example, unused public members) to be included in the report. If you want these results to be included, enable the solution wide-analysis. Note that when solution-wide analysis is enabled, JetBrains Rider has to analyze the whole solution even if you need to inspect a single project, so be prepared that it takes more time.
Do one of the following:
From the main menu, choose
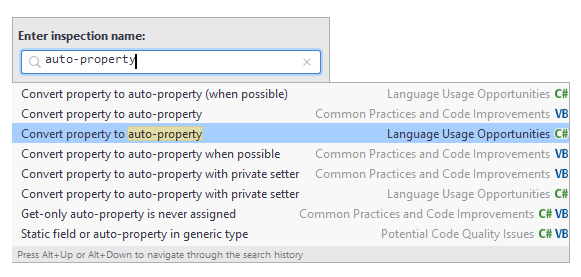
You can also inspect code in the desired scope with a single inspection of your choice — for example, you may want to check whether there are properties that could be converted to auto-properties.
To run a single inspection, press Ctrl+Alt+Shift+I or choose from the main menu, and then start typing the name of the inspection:

In the Solution Explorer, select items (files, folders, projects, solution folders) that you want to inspect, right-click the selection and choose Inspect Code... in the context menu.
In the dialog that opens, specify the scope where the code should be inspected.
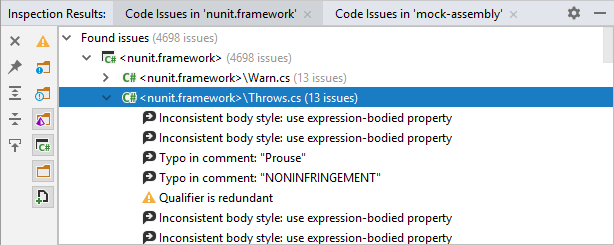
The Problems window will open displaying detected code issues.
Analyze inspection results
In the Problems window, you can view the list of discovered code issues and locate them in the editor by double-clicking the entries:

Each new run of code inspection opens a new tab in the window, so the results of previous runs are preserved until you close their tabs.
Optionally, you can toggle Navigate with Single Click so that issues are located in the editor as soon as they get focus in the tool window.
Run code inspection with Qodana
This functionality relies on the Qodana plugin, which is bundled and enabled in JetBrains Rider by default. If the relevant features are not available, make sure that you did not disable the plugin. For more information, refer to Open plugin settings.
You can inspect your code locally or remotely using Qodana. The main use case for Qodana is to perform resource-intensive code analysis remotely, on a CI/CD server. However, you can also run the same analysis in the IDE to make sure that you have the same results, and to be able to locate the detected issues in your source code.
In C#, Visual Basic, and C++, Qodana uses the same set of inspections as in the native Rider code analysis engine.
In the main menu, go to .
Select where you want to run inspections: locally or on your CI/CD server.
To run inspections on the server, you need to set up Qodana on your CI first.
The Qodana configuration file opens. In this file, you can specify a Qodana inspection profile, enable or disable specific inspections, and specify a list of plugins that should be installed before the analysis.
Click Run.
Once the analysis is finished, the report will be displayed in the Problems tool window on the Qodana tab. You can work with the results locally or send them to Qodana Cloud.
The reports of all local runs of Qodana analysis are saved and available from the main menu: . The currently opened report has a checkmark next to it, you can click it to close the report.
For more information about Qodana, refer to its documentation.