JetBrains IDEs
You can run Qodana using JetBrains IDE products installed via JetBrains Toolbox App, such as IntelliJ IDEA, PhpStorm, WebStorm, GoLand, PyCharm, Rider and CLion. Depending on the IDE, the available functionalities let you:
Run Qodana locally and upload reports to Qodana Cloud (not available in CLion)
Configure Qodana for running in a CI pipeline (not available in CLion)
UI overview
In your IDE, navigate to .

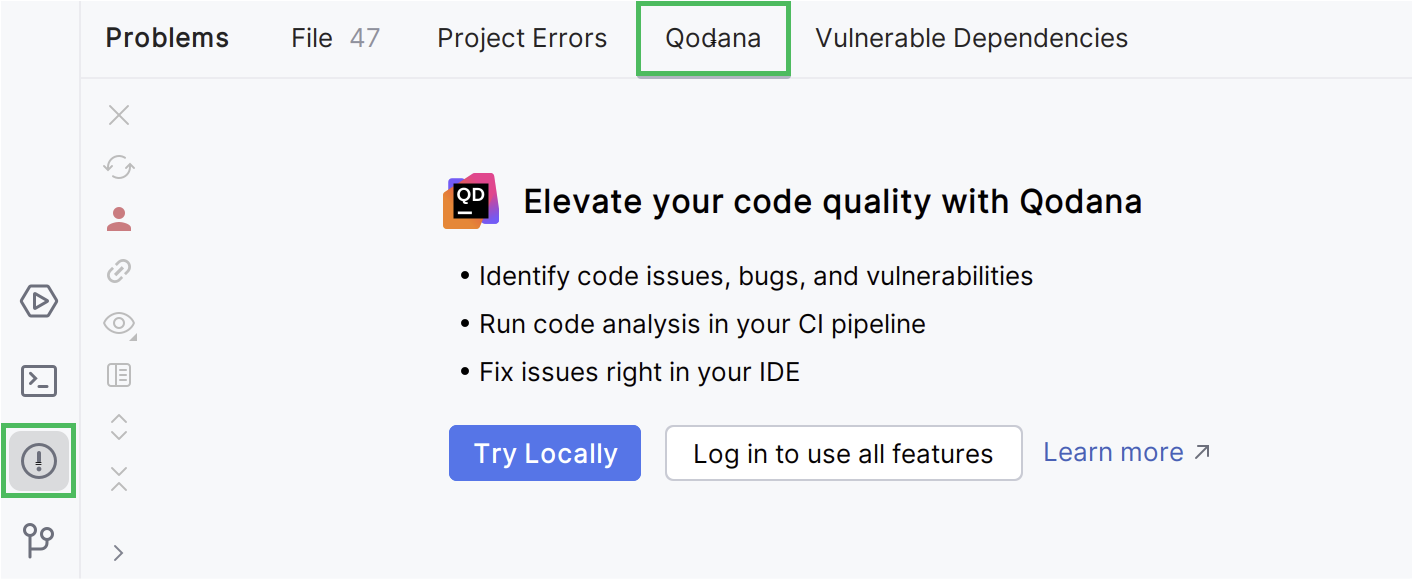
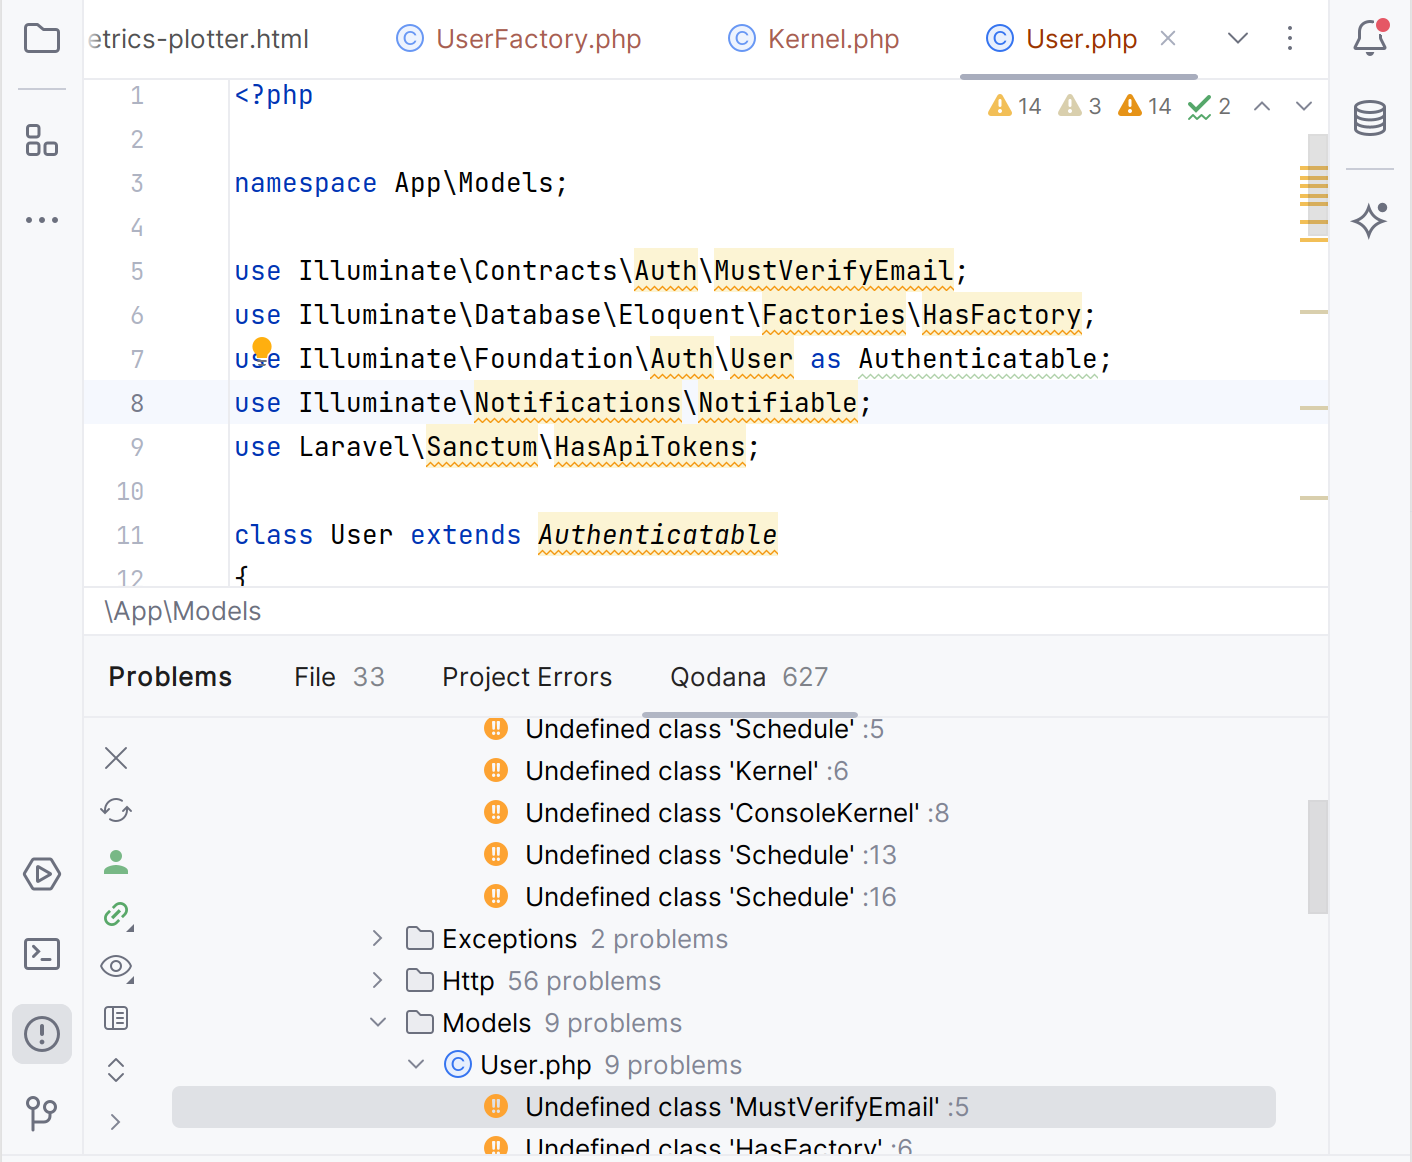
You can also have access to Qodana using the Qodana tab available in the Problems tool window of your IDE.
Run Qodana locally
You can run Qodana locally and then forward analysis reports to Qodana Cloud for storage and analysis purposes.
In your IDE, navigate to .
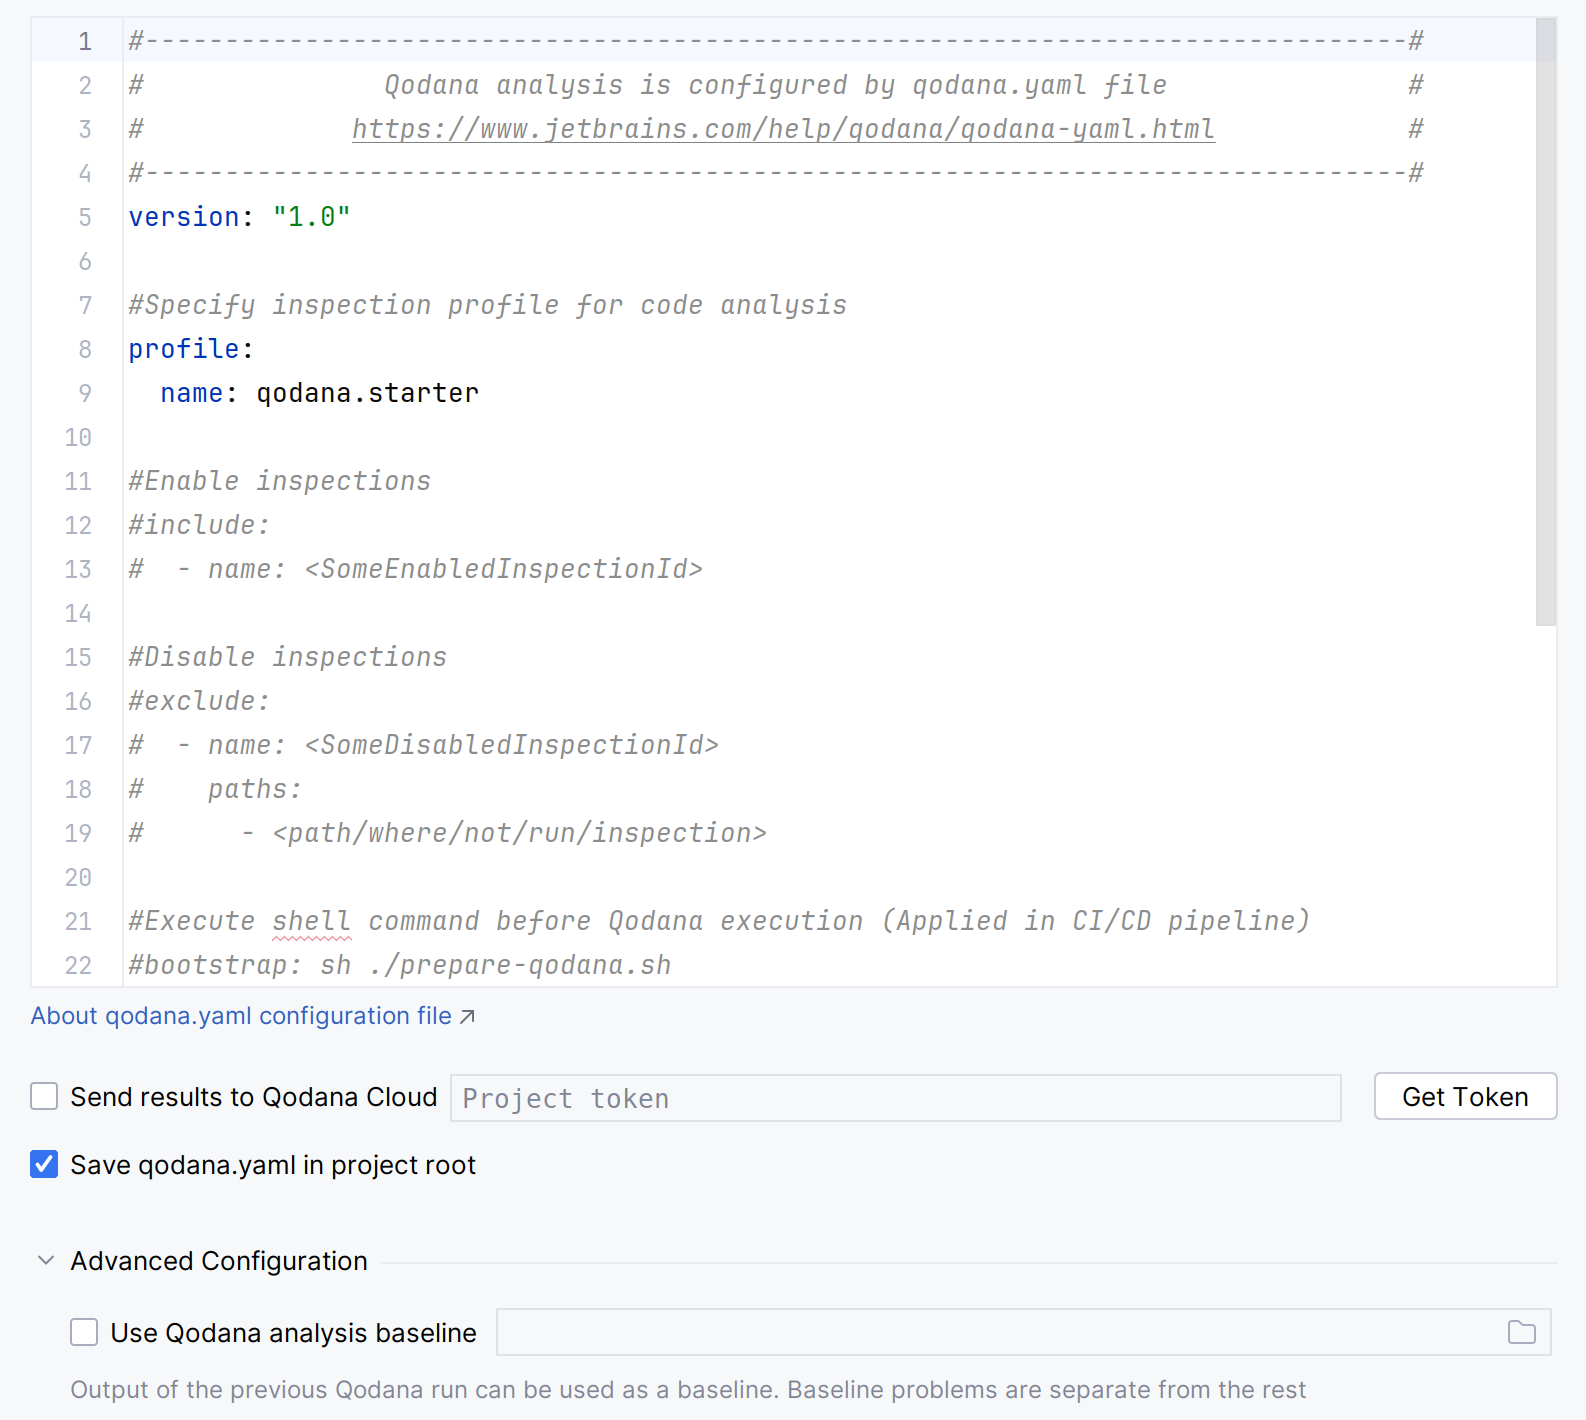
On the dialog, you can configure:
Options used by Qodana in the
qodana.yamlfileThe option using a project token
Click for analyzing your code.
On the tab of the tool window, see analysis results.
Connect to Qodana Cloud
You can log in to Qodana Cloud and connect your project opened in the IDE to a specific Qodana Cloud project to get the latest Qodana report and view it.
In your IDE, navigate to .
On the dialog, click .
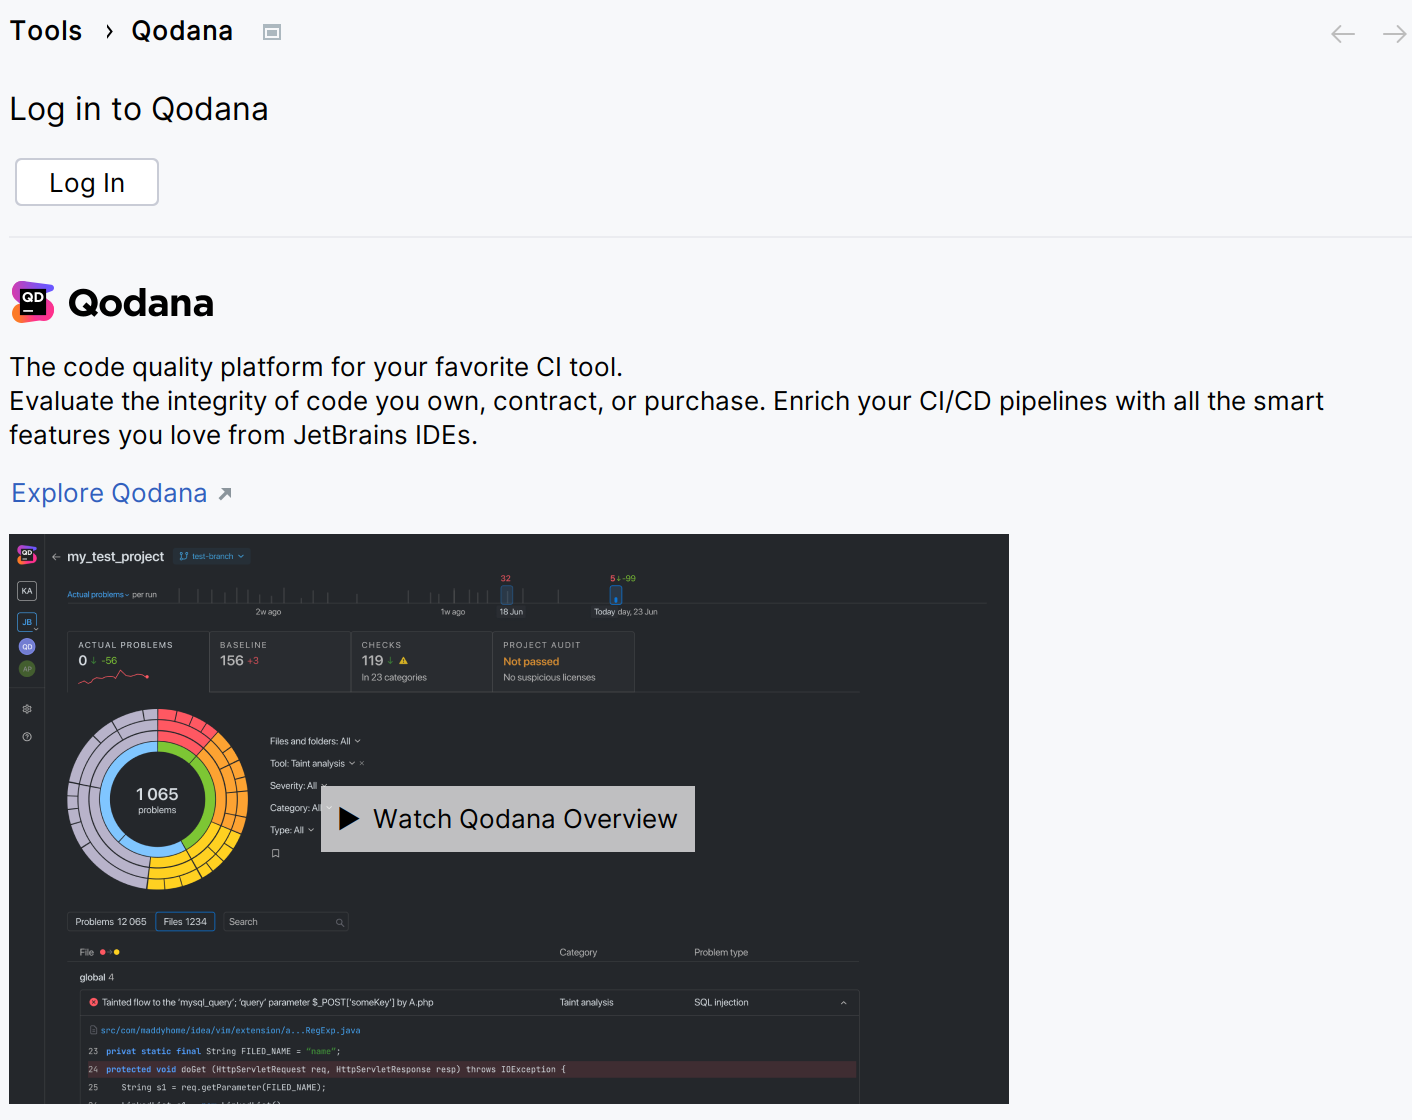
This will redirect you to the authentication page.
Select the Qodana Cloud project to link your local project with.
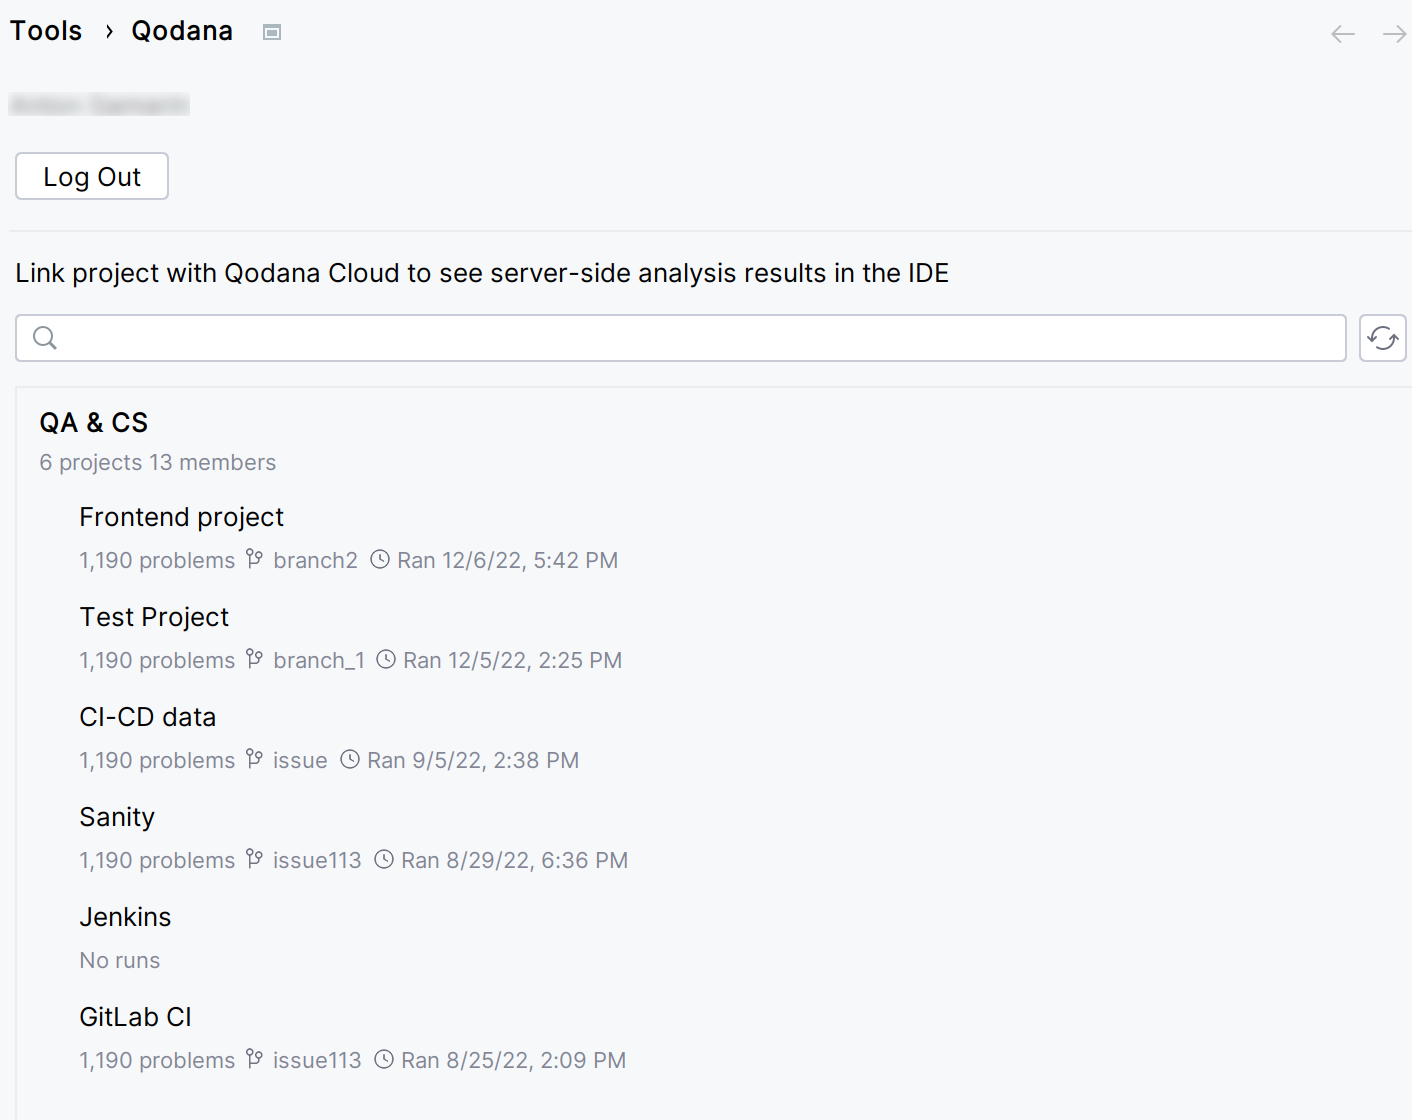
By enabling the option, you can get actual reports automatically retrieved from Qodana Cloud.
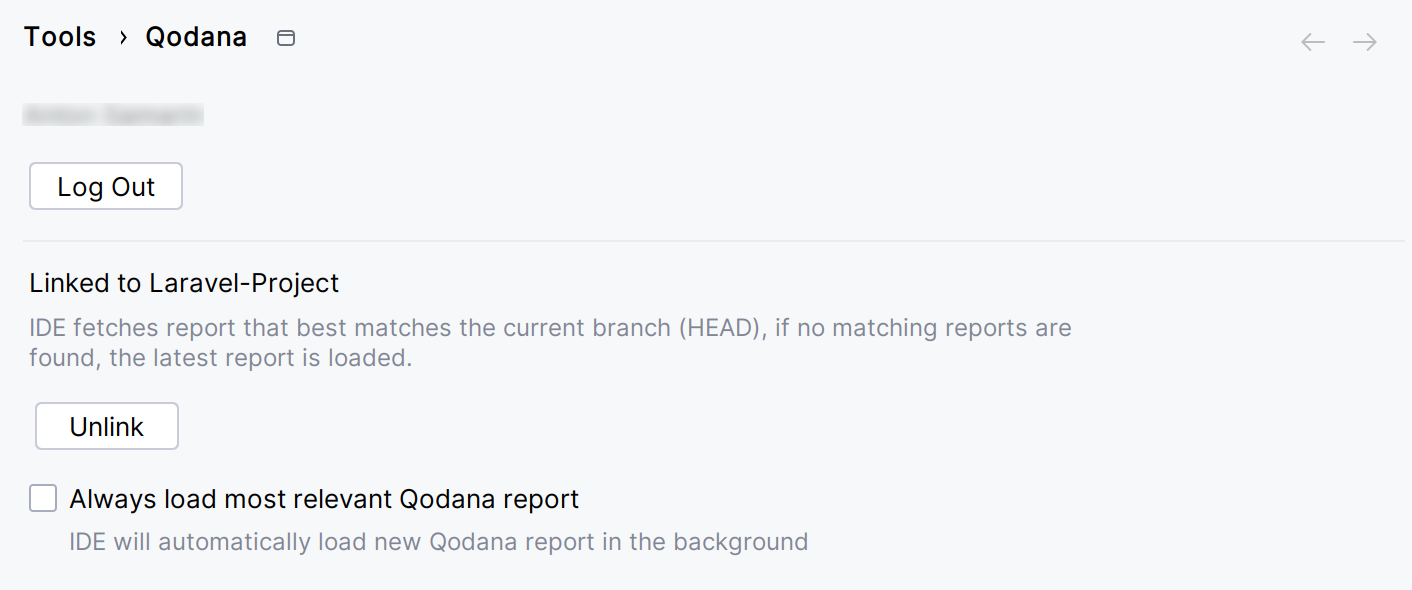
In this case, the IDE will search and fetch from Qodana Cloud the report with the revision ID corresponding to the current revision ID (HEAD). If this report was not found, the IDE will select the previous report with the revision closest to the current revision ID (HEAD). Otherwise, the IDE retrieves the latest available report from Qodana Cloud.
On the tab of the tool window, see analysis results.
Configure Qodana for CI
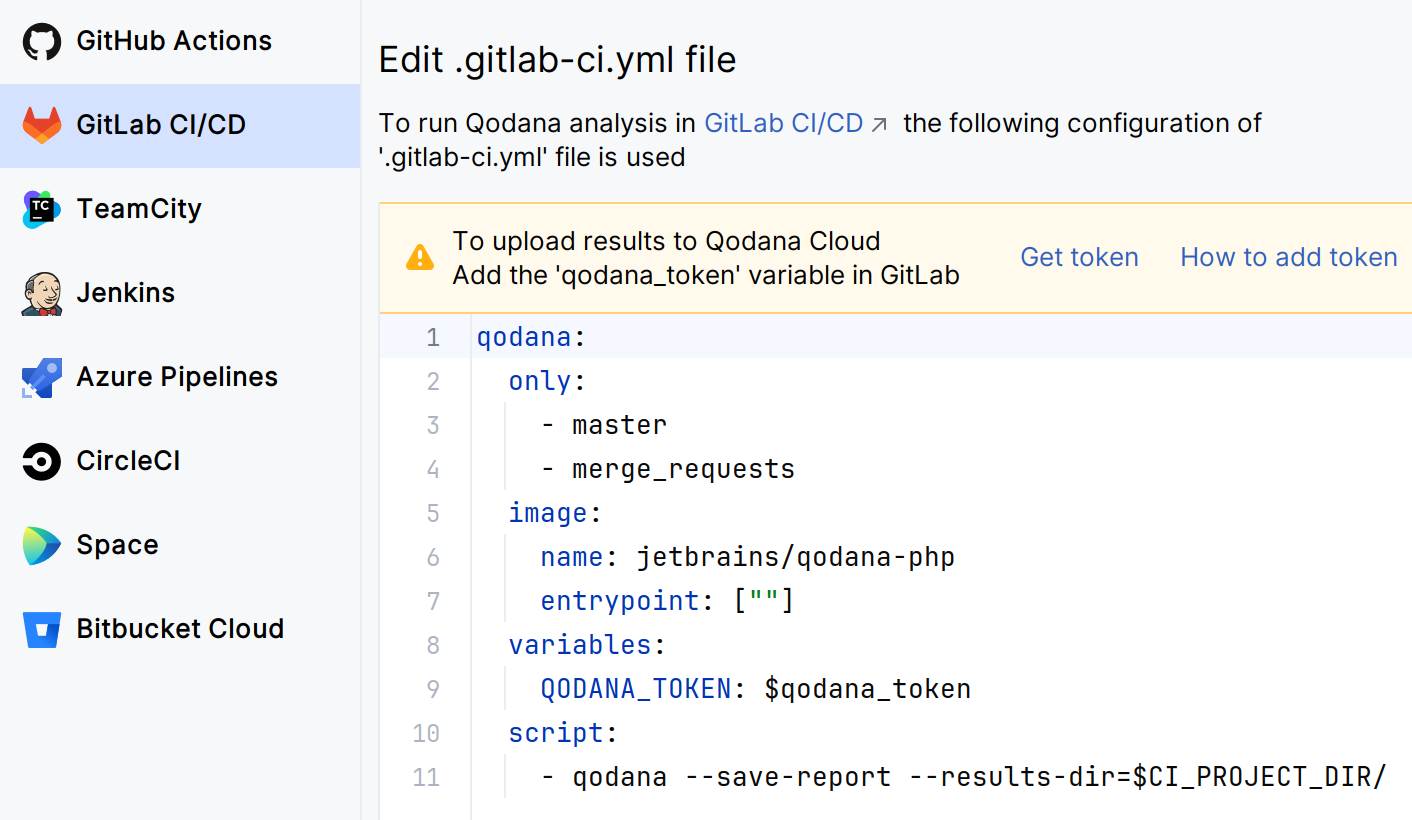
After logging in to Qodana Cloud, you can configure Qodana in your CI pipelines.
In your IDE, navigate to
On the dialog, follow the recommendations applicable to your CI/CD solution.
Open a local report
You can open and review SARIF-formatted Qodana reports in your IDE.
In your IDE, navigate to .
Select the SARIF-formatted report file you would like to open.
On the tab of the tool window, you can view analysis results.
Qodana report overview
Using the Qodana tab of the Problems tool window, you can view Qodana reports and navigate to the code fragments containing such problems.
The upper part contains information about the project and branch names, the inspection date, and the number of problems. The left part of the Qodana tab contains several buttons.
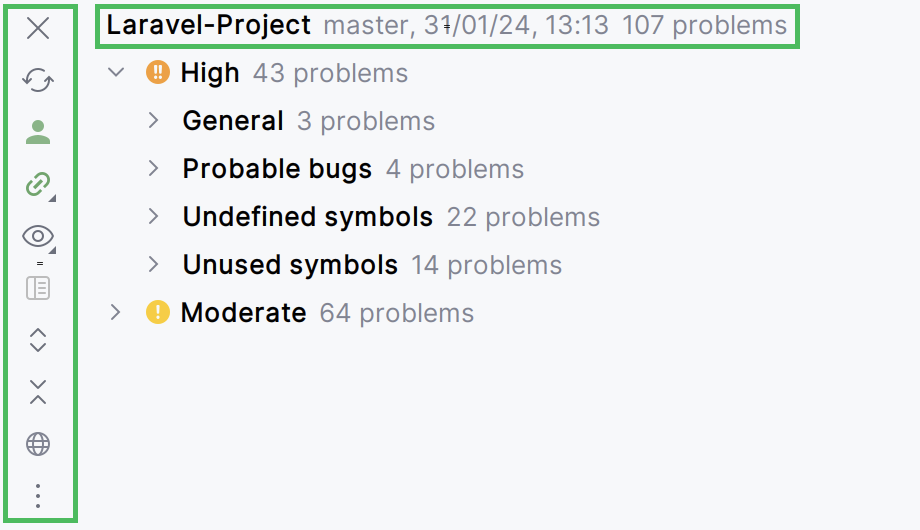
This table describes each button from top to bottom:
Button | Description |
|---|---|
Close the report that was previously opened | |
Download the updated version of the report from Qodana Cloud. This requires that you first link your project with Qodana Cloud | |
Log in Qodana Cloud, or log out. This action is a prerequisite for linking your project with Qodana Cloud-based reports | |
Link your project with a specific Qodana Cloud-based project, or unlink it. This requires that you first log in to Qodana Cloud | |
Filter out code issues by their severity and configure their sorting. When no grouping or sorting options are selected, the issues are listed in the order they appear in the file. You can also filter all issues by the baseline | |
Open the preview pane to view the selected issue in its source context. This preview lets you change the code and apply available Quick-Fixes | |
Expand all nodes to see all issues in the expanded form | |
Collapse all nodes that were previously expanded | |
Open the analysis report using your default browser | |
Functionalities from the menu |
Qodana log overview
In your IDE, navigate to Help | Collect Logs and Diagnostic Data. This will collect all necessary data and save them under a specific directory.