Problems tool window
The Problems tool window displays problems that JetBrains Rider detects in your solution on several tabs.
To jump to the corresponding line in the editor, you can select any problem in the window and press F4 or double-click it.
To cycle through the tool window tabs, press Alt+Right and Alt+Left.
To copy multiple problem descriptions at once, select them in the tool window and press Ctrl+C.
When the design-time code inspection is enabled, this tab lists all code issues found in the current file. The list is updated as you switch between files in the editor.

Toolbar
Item | Tooltip and shortcut | Description |
|---|---|---|
View Options | Filter out code issues by their severity and configure their sorting. When no grouping or sorting options are selected, the issues are listed in the order they appear in the file. | |
| Show Quick-Fixes Alt+Enter | Show quick-fixes available for the selected problem. Note that this item is only active for Web languages, such as JavaScript, HTML, and CSS. |
Open Editor Preview | Open the preview pane to view the selected issue in its source context right in the Problems window. Note that this preview is a normal editor where you can change the code and apply available quick-fixes. |
Context menu
Item | Shortcut | Description |
|---|---|---|
Show Quick-Fixes | Alt+Enter | Show quick-fixes available for the selected problem. Note that this item is only active for Web languages, such as JavaScript, HTML, and CSS. |
Copy Problem Description | Ctrl+C | Copy the problem description to the clipboard. |
Jump to Source | F4 | Open the code containing the problem in the editor. |
Show error details | Open error details in a separate dialog. |
If solution-wide analysis is enabled, JetBrains Rider will monitor all solution files and list the detected errors and warnings.
Click the icon in the tab to toggle solution-wide analysis. Click the
icon and then select Warnings to monitor warnings.

This tab displays any problems related to solution structure and properties, as well as security issues detected in project dependencies.

Right-click issues or press Alt+Enter to access related actions and settings.
If some issues are not relevant at the moment, you can hide them from view — right-click an issue and choose Ignore Issue. To view hidden issues, click
on the toolbar and select Ignored Items.
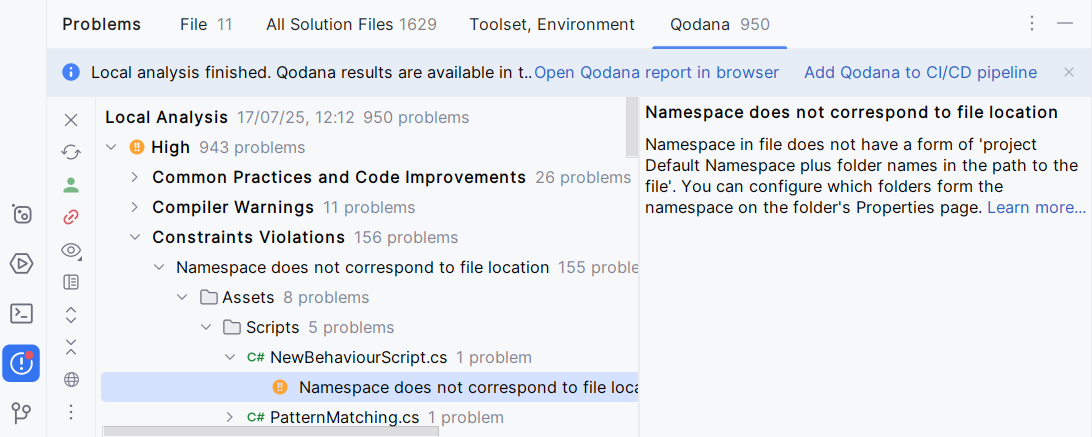
This tab displays code problems detected with Qodana. Qodana allows you to run inspections locally including your IDE, and as a part of CI/CD pipelines.

Toolbar
Item | Tooltip and shortcut | Description |
|---|---|---|
Log in to Qodana | Log in to Qodana Cloud. This action is a prerequisite for linking your project with Qodana Cloud-based reports. Alternatively, you can do it from the main menu: . For more information, refer to Qodana Cloud. | |
Logged in to Qodana | You are logged in to Qodana Cloud. You can link your project with Qodana Cloud. | |
Link Project with Cloud | Link your project and upload the report to Qodana Cloud. Alternatively, you can do it from the main menu: . For more information, refer to Open report from Qodana Cloud. | |
Linked with Cloud | Your project is linked with Qodana Cloud. By clicking this button, you can open the inspection report in the cloud or unlink your project from Qodana Cloud. | |
Refresh Cloud Report | Refresh the current cloud report. | |
View Options | Filter out code issues by their severity and configure their sorting. When no grouping or sorting options are selected, the issues are listed in the order they appear in the file. | |
Open Editor Preview | Open the preview pane to view the selected issue in its source context right in the Problems window. Note that this preview is a normal editor where you can change the code and apply available quick-fixes. | |
Expand All Ctrl+NumPad Plus | Expand all nodes. | |
Collapse All Ctrl+NumPad Minus | Collapse all nodes. | |
Show Qodana in Browser | Open the results of the analysis in your default browser. An interactive report opens allowing you to examine the problems in detail and navigate between the report and the IDE. |
Context menu options
Item | Shortcut | Description |
|---|---|---|
Show Quick-Fixes | Alt+Enter | Show quick-fixes available for the selected problem. Note that this item is only active for Web languages, such as JavaScript, HTML, and CSS. |
Jump to Source | F4 | Open the code with the problem in the editor. |
Show Error Details | Learn more in formation about the detected problem in a popup. | |
qodana.yaml | Modify the qodana.yaml configuration file by excluding from the analysis certain files, folders, or inspections. |