Debug remote applications via SSH
In this tutorial we'll see how to use an SSH tunnel to set up a secure connection between the development machine and a remote host to debug your web application running there.
Set up SSH server on the remote host
Depending on the operating system that the remote host runs, configure SSH access to it.
Install and configure JetBrains SSH server for remote debugging — it will quickly and securely start SSH on a remote host and generate access credentials that you can use to access the host.
Download the JetBrains SSH server executable for 32-bit Windows or for 64-bit Windows.
Run the executable. Optionally, you can specify the desired port with the
-portargument (for example,jetbrains_debugger_agent_20240726.40.0 -port=1234) otherwise the port will be randomly selected.The SSH will start, and you will see the access credentials (Login, Password, and Port) in the output.
Make sure that the port is accessible:
either both the development machine and the remote host should be in the same network,
or the firewall/port-forwarding should be configured so that the port is accessible from outside the network
Alternatively, you can install and configure OpenSSH For Windows.
Install and configure JetBrains SSH server for remote debugging — it will quickly and securely start SSH on a remote host and generate access credentials that you can use to access the host.
Download the JetBrains SSH server utility for x64-based macOS or for M1-based macOS.
Make the utility file executable. For example, run
chmod +x jetbrains_debugger_agent_20240726.40.0in the terminal.Run the executable. Optionally, you can specify the desired port with the
-portargument (for example,jetbrains_debugger_agent_20240726.40.0 -port=1234) otherwise the port will be randomly selected.The SSH will start, and you will see the access credentials (Login, Password, and Port) in the output.
Make sure that the port is accessible:
either both the development machine and the remote host should be in the same network,
or the firewall/port-forwarding should be configured so that the port is accessible from outside the network
Alternatively, configure the SSH manually as described in macOS User Guide: Allow a remote computer to access your Mac.
Install and configure JetBrains SSH server for remote debugging — it will quickly and securely start SSH on a remote host and generate access credentials that you can use to access the host.
Download the JetBrains SSH server utility for x64-based Linux, for arm64-based Linux, or for arm32-based Linux.
Make the utility file executable. For example, run
chmod +x jetbrains_debugger_agent_20240726.40.0in the terminal.Run the executable. Optionally, you can specify the desired port with the
-portargument (for example,jetbrains_debugger_agent_20240726.40.0 -port=1234) otherwise the port will be randomly selected.The SSH will start, and you will see the access credentials (Login, Password, and Port) in the output.
Make sure that the port is accessible:
either both the development machine and the remote host should be in the same network,
or the firewall/port-forwarding should be configured so that the port is accessible from outside the network
Alternatively, install and configure OpenSSH Server.
Create a web application
If you have a web application, you can go on with it. Otherwise, you can create a sample ASP .NET MVC application — choose from the main menu and use the New Solution wizard:
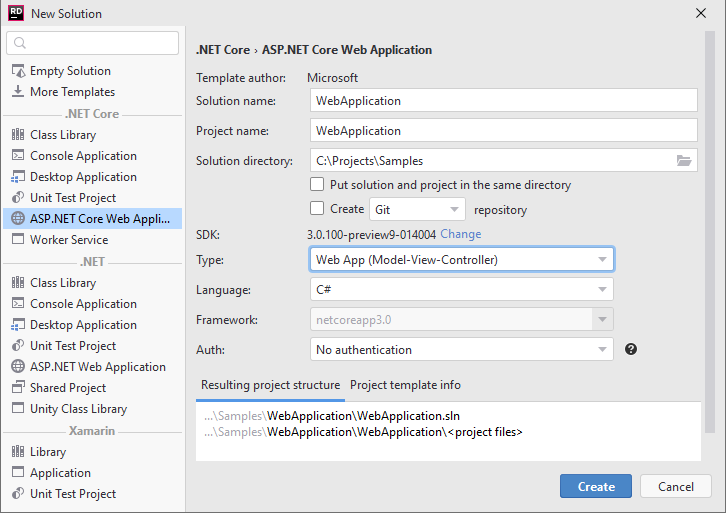
Configure connections to the remote host
The connection to the remote host will be used by two subsystems — first, to deploy the application remotely via SFTP and second, to establish a remote debugging session via SSH.
Press Ctrl+Alt+S or choose (Windows and Linux) or (macOS) from the menu .
Go to .
Click Add
Insert, choose SFTP, and specify any name that will help you identify the remote host.
Specify the address and the access credentials for the remote host, as well as the Root path — the path on the remote host where the application will be deployed. Make sure that this directory exists on the remote host. Web server URL that you will use for web browser access will be calculated automatically:
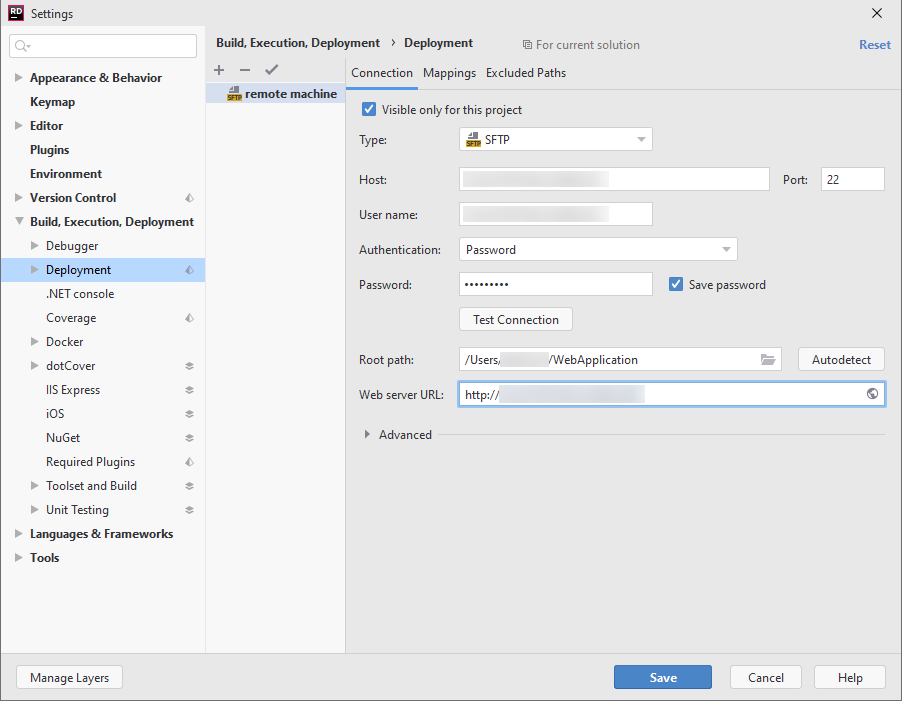
Without closing the Settings/Preferences dialog, go to .
Click Add
Insert and specify the SSH access credentials for the remote host. Often they are the same as the SFTP credentials:
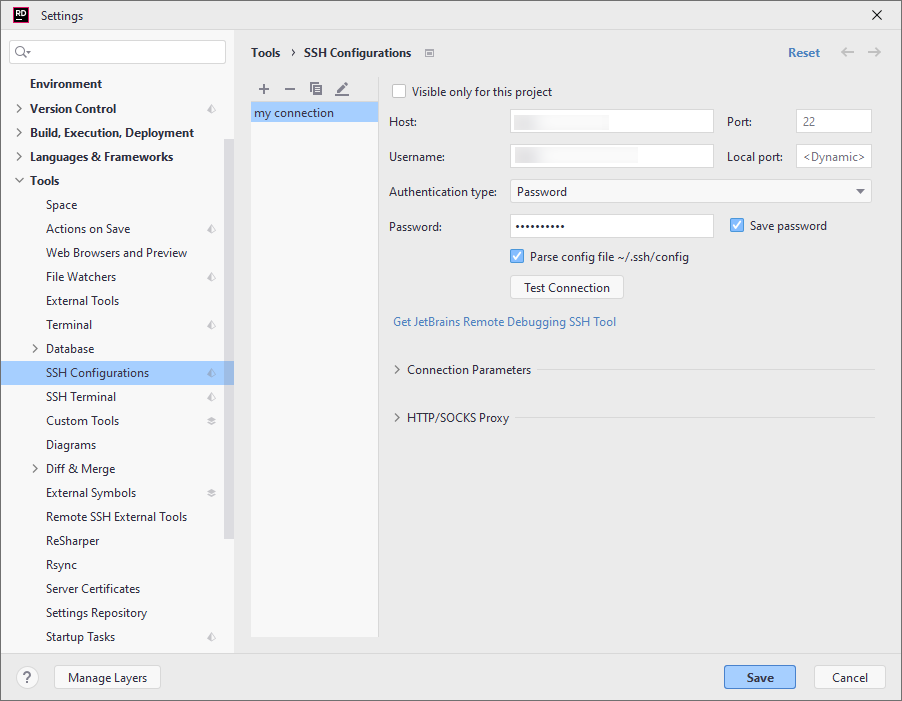
Click Save to save the settings and close the dialog
Deploy the application to the remote host
To deploy applications with JetBrains Rider, you need to create and use run configurations.
Open the Run/Debug Configuration dialog in one of the following ways:
Select from the main menu.
With the Navigation bar visible (), choose from the run/debug configuration selector.
Press Alt+Shift+F10 and then press 0.
In the Run/Debug Configuration dialog, click Add New Configuration
Alt+Insert, choose the Publish to custom server configuration type, and specify a name that will help you identify this configuration in the future.
Optionally, adjust the common settings of the configuration and configure before launch tasks.
Make sure the project that corresponds to the application is selected correctly.
In the Remote server field, select the SFTP access profile that you created in the previous steps on the page of JetBrains Rider settings Ctrl+Alt+S.
Specify other options that could differ depending on the target machine:
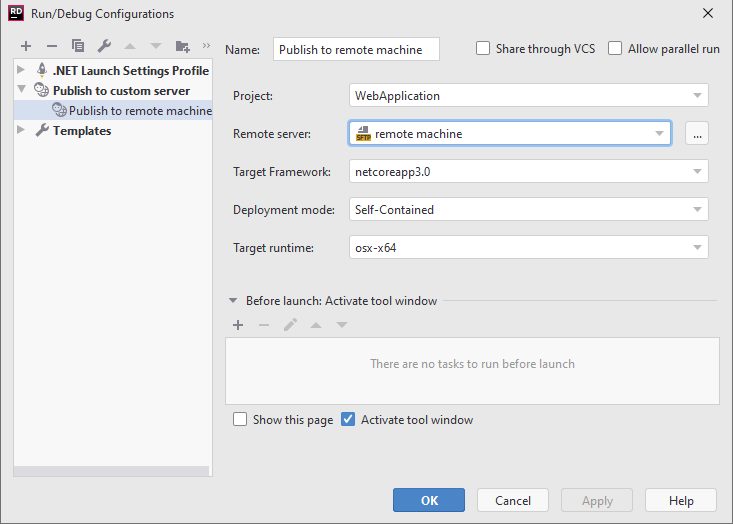
Click OK to save the configuration and close the dialog.
Now you will be able to publish your application to the remote host as soon as your application is ready or each time it is modified. As we used a boilerplate project template for the web application, it is ready to be published:

When the application is deployed, we can run it on the remote host.
Select from the menu and then select the SFTP access profile.

A new session will appear in the Terminal window. Assuming that the application root folder is WebApplication, type the following commands:
cd /[application path]/WebApplicationto go to the application root folder.chmod +x ./WebApplicationto add the executable bit if needed.ASPNETCORE_URLS=http://0.0.0.0:5000 ./WebApplicationto run the application

Debug the application on the remote host
In your application, set a breakpoint that should be hit when accessing one of its pages. If you created a new sample project in the beginning of the tutorial, you can set a breakpoint at
HomeController.cs:28: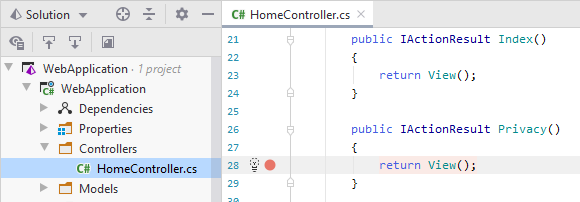
Select from the menu and choose the remote host and the application:

If the debugger attaches successfully, the breakpoint icon will be marked with a green check mark:
 .
.Now when the application is running with the debugger connected to it, open the application URL in a browser
http://[remote host name]:5000and try to access the page where the breakpoint is set.
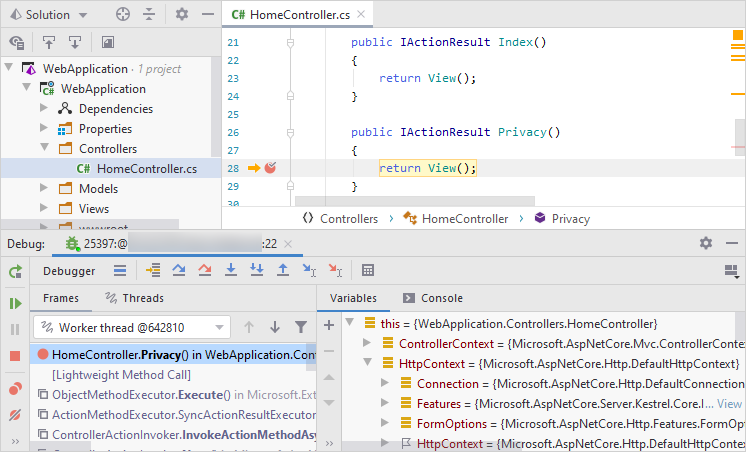
As soon as the application execution reaches the breakpoint, it will stop, and you will be able to debug it:
Optional deployment of remote debug tools
When the debugger connects to a remote host where the target application runs, it relies on the remote debug tools (dotnet executables, Rider agents, and their dependencies) that must be deployed on the remote host.
If there are no remote debug tools found, the debugger will silently deploy them when it connects to the application for the first time.
However, there are scenarios when the target environment is updated on each connection, for example if you debug an application inside a Docker container and the whole Docker image is rebuilt when you rebuild the application.
In such cases, each new debugging session has to start by deploying the remote debug tools, which may be slow.
To avoid this startup delay, you can manually or automatically deploy the remote debugging tools on the target host before connecting with the debugger.
Download the remote debug tools for Windows using one of the following links:
Unzip the tools to the RiderRemoteDebugger directory on the target machine or Docker image. For example %LOCALAPPDATA%\JetBrains\RiderRemoteDebugger\2022.1.1
Download the remote debug tools for macOS using one of the following links:
Unzip the tools to the RiderRemoteDebugger directory on the target machine or Docker image. For example /.local/share/JetBrains/RiderRemoteDebugger/2022.1.1
Apply the following command to all extracted files:
xattr -d com.apple.quarantine FILE_NAME
Download the remote debug tools for Linux using one of the following links:
Unzip the tools to the RiderRemoteDebugger directory on the target machine or Docker image. For example ~/.local/share/JetBrains/RiderRemoteDebugger/2022.1.1