Attach to process
JetBrains Rider provides a way to attach the debugger to both local and remote processes.
The steps to attach to a process depend on how and where the process was launched.
While JetBrains Rider debugger is capable of attaching to any .NET or .NET Core process, it is recommended to prefer a simpler way when there is one. You don't want to remotely attach to a 'hello world' running on the same machine.
Attach to a local process
Press Ctrl+Alt+F5 or select from the main menu.
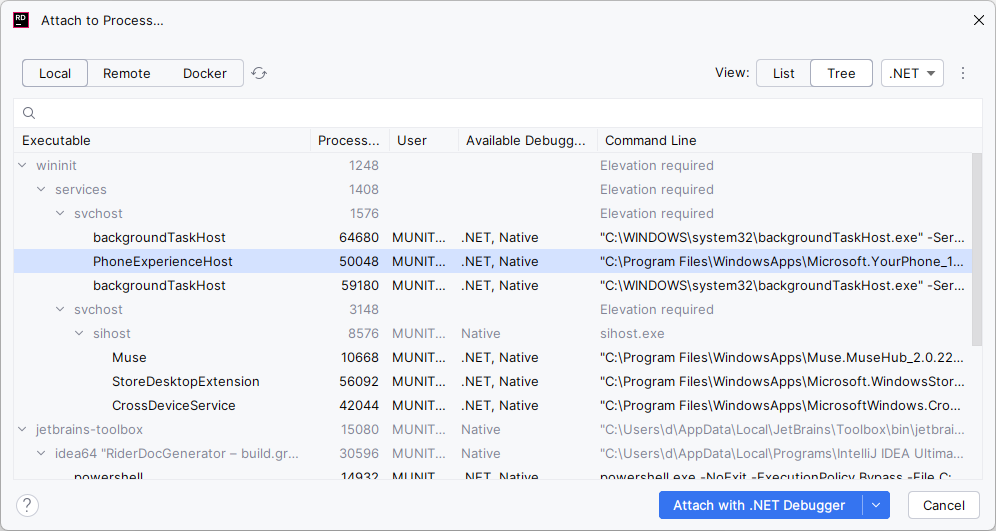
JetBrains Rider will show the list of the running local processes. Select the process to attach to.
When there are too many processes, you can narrow down the list by typing the first letters of the process name or PID. If the target process was started after you'd opened this dialog, you may need to click Refresh
.

If you don't know the name or ID of the desired process, try the following:
Click Show as: Tree on the toolbar and start with expanding the parent process nodes.
Select a specific debugger in the top-right corner of the dialog. For example, if you are debugging a .NET process, select .NET to hide all native and JVM processes.
To connect to the process with the default debugger, press Enter. If there are several debuggers that can be used for the process, you can choose the debugger with the selector in the bottom-right corner of the dialog.
If you don't have sources of the target .NET process, you can still attach to it either as described above or by clicking Attach to Process on the Welcome screen, right after you start the IDE. JetBrains Rider will automatically load and decompile all assemblies from the process.
To get a proper starting point for debugging the target process, you can search for types in the loaded assemblies and set breakpoints in the decompiled code.
Attach to recent processes
All processes that you have attached to in the current session are listed in the Recently attached section at the top of the Attach to Process dialog, so you can easily return to processes that you worked with.
JetBrains Rider will list recent processes even if they were terminated and then relaunched with a different PID.
You can attach again to the very last process that you have attached to, even without opening the dialog. To do so, press Ctrl+Alt+Shift+F5 or choose from the main menu.
Attach to a remote process
Debugging a remote process (usually, a Web application running on a remote host), is a completely different scenario, which requires setting up the debug agent on the remote host and configuring the connection before actually attaching to the target process. All those steps are described in the Debug remote applications via SSH tutorial.
Attach to child .NET processes
When debugging .NET processes, JetBrains Rider allows you to automatically attach the debugger to child and grandchild processes spawned by the original process.
To debug child processes, you need to use either a .NET Project or .NET Executable run configuration and make sure that Attach to child .NET processes is selected in the configuration settings.
Attach to unstarted process
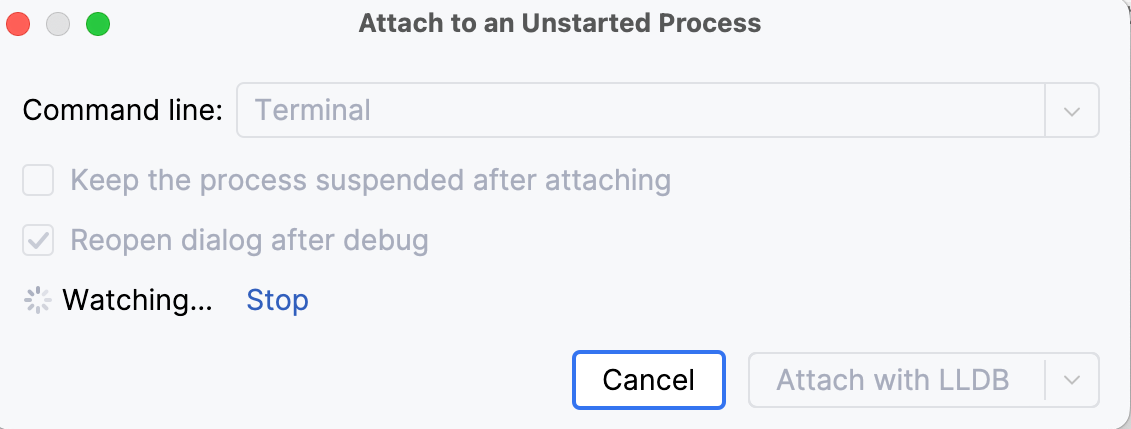
If the process you would like to attach to is not running yet, you can preconfigure attachment using the Attach to an Unstarted Process action:
Set the necessary breakpoints in your code.
Select from the main menu.
In the dialog that opens, specify the command line of the process or an executable name.
Set the Keep the process suspended after attaching checkbox if you would like the process to be paused once JetBrains Rider attaches to it.
Clear the Reopen dialog after debug checkbox if you do not want JetBrains Rider to reopen this dialog once the debugging session terminates.
Click Attach and select the debugger (if applicable).

JetBrains Rider will begin watching. Once it identifies the process, it will automatically attach to it and trigger debugging.
Detach from the process
The steps to detach from a remote process are the same as for stopping a local debug session. However, unlike local sessions, the target process continues to run after the debugger detaches.
Click the Stop
button on the Debug tool window's toolbar on in the Debug window.
Alternatively, click Stop
on the main toolbar or press Ctrl+F2, then select the session to be closed.